
Temporal and spatial distribution characteristics of water resources in Guangdong Province based on a cloud model
2015-01-16 01:21:07QiZhouWiWngYongPngZhiyongZhouHuipingLuo
Water Science and Engineering 2015年4期
Qi Zhou,Wi Wng,Yong Png*,Zhi-yong Zhou,Hui-ping Luo
aKey Laboratory for Integrated Regulation and Resources Development on Shallow Lakes,Ministry of Education,Hohai University,Nanjing 210098,PR China
bCollege of Environment,Hohai University,Nanjing 210098,PR China
cCollege of Architecture Engineering,Tongling University,Tongling 244061,PR China
dCollege of Water Conservancy and Hydropower Engineering,Hohai University,Nanjing 210098,PR China
eWater Conservancy Bureau of Tongling City,Tongling 244000,PR China
Temporal and spatial distribution characteristics of water resources in Guangdong Province based on a cloud model
Qi Zhoua,b,c,Wei Wangd,Yong Panga,b,*,Zhi-yong Zhoue,Hui-ping Luoa
aKey Laboratory for Integrated Regulation and Resources Development on Shallow Lakes,Ministry of Education,Hohai University,Nanjing 210098,PR China
bCollege of Environment,Hohai University,Nanjing 210098,PR China
cCollege of Architecture Engineering,Tongling University,Tongling 244061,PR China
dCollege of Water Conservancy and Hydropower Engineering,Hohai University,Nanjing 210098,PR China
eWater Conservancy Bureau of Tongling City,Tongling 244000,PR China
With a focus on the diffculty of quantitatively describing the degree of nonuniformity of temporal and spatial distributions of water resources,quantitative research was carried out on the temporal and spatial distribution characteristics of water resources in Guangdong Province from 1956 to 2000 based on a cloud model.The spatial variation of the temporal distribution characteristics and the temporal variation of the spatial distribution characteristics were both analyzed.In addition,the relationships between the numerical characteristics of the cloud model of temporal and spatial distributions of water resources and precipitation were also studied.The results show that,using a cloud model,it is possible to intuitively describe the temporal and spatial distribution characteristics of water resources in cloud images.Water resources in Guangdong Province and their temporal and spatial distribution characteristics are differentiated by their geographic locations.Downstream and coastal areas have a larger amount of water resources with greater uniformity and stronger stability in terms of temporal distribution.Regions with more precipitation possess larger amounts of water resources,and years with more precipitation show greater nonuniformity in the spatial distribution of water resources.The correlation between the nonuniformity of the temporal distribution and local precipitation is small,and no correlation is found between the stability of the nonuniformity of the temporal and spatial distributions of water resources and precipitation.The amount of water resources in Guangdong Province shows an increasing trend from 1956 to 2000,the nonuniformity of the spatial distribution of water resources declines,and the stability of the nonuniformity of the spatial distribution of water resources is enhanced. ©2016 Hohai University.Production and hosting by Elsevier B.V.This is an open access article under the CC BY-NC-ND license(http:// creativecommons.org/licenses/by-nc-nd/4.0/).
Water resources;Temporal and spatial distribution characteristics;Cloud model;Guangdong Province
1.Introduction
Water is one of the essential natural resources that sustain the existence and development of human society.However,theshortageofwaterresourceshasbecomeaworldwideproblemdue to population growth and socio-economic development(Wei et al.,2004).Variation in climate and topography results in spatial and temporal variations of water resources over a region. The temporal and spatial distribution characteristics of water resources have impacts on the management of water resources, agriculture,and theaquaticecosystem(Liloveretal.,1998;Petts et al.,1999;Hannah et al.,2000;Harris et al.,2000;Disalvo and Hart,2002).Therefore,research on the regional temporal and spatial distribution characteristics of water resources is signifcant to any understanding the variation of regional water resources as well as their management and allocation.
At present,methods for research on the temporal and spatial distribution characteristics of water resources involve analyzing the time domain and frequency domain of time sequences of water resources and studying the period and trend variations of water resources based on statistical theories(Conway et al.,2009;Ling et al.,2013).In some studies,simulations of the hydrological process have been carried out to describe the temporal and spatial variations of water resources and to forecast trends based on hydrological models(Xu et al.,2007;Zhang et al.,2013).In recent years, the chaos theory(Dai et al.,2007),information entropy (Zhang and Liu,2000),wavelet analysis(Conway et al., 2009),and fractal theory(Lovejoy et al.,1987;Sivakumar, 2000)have also been used to study the temporal and spatial distribution characteristics of water resources.However,in these studies,most descriptions of the nonuniformity of temporal and spatial distributions of water resources are qualitative,and no quantitative description of the degree of nonuniformity of the distribution is provided.There have been few studies on the temporal variation of the spatial distribution characteristics and the spatial variation of the temporal distribution characteristics of water resources.In addition,only the temporal trend in water resources is analyzed in most of these studies(Lins and Slack,1999, 2005;Milly et al.,2005).Based on the traditional fuzzy set theory and probability statistics,the cloud model was proposed by Li and Du(2005)and became a method for uncertain conversion between a qualitative concept and its quantitative description.
In this study,with a focus on the diffculty of describing the degree of nonuniformity of temporal and spatial distributions of water resources in a quantitative way,a cloud model was built for the temporal and spatial distribution characteristics of water resources in Guangdong Province.The spatial variation of temporal distribution characteristics and the temporal variation of spatial distribution characteristics of water resources were both analyzed.
2.Research area and data
2.1.Research area
As shown in Fig.1,Guangdong Province ranges from 20°08′N to 25°32′N and from 109°40′E to 117°20′E at the southern end of China,with the Tropic of Cancer passing through its middle region.The overall topography of Guangdong Province is high in the north and low in the south,and the topographic pattern is complex.In addition to the river system in the Pearl River Basin,there are many medium and small rivers fowing into the sea in the province,such as the Hanjiang River.The Dongjiang,Xijiang,and Beijiang rivers in the Pearl River Basin converge at the border of Guangdong Province,running into the South China Sea through the Pearl River Delta.Guangdong Province is located in the downstream area of the Pearl River Basin and borders the South China Sea on the south,which enables moisture to enter from the Bay of Bengal in the Indian Ocean and the Pacifc Ocean. The climate is warm and humid,with abundant precipitation, and the river runoff is completely recharged by precipitation. Compared with other provinces and districts in China,surface water resources are abundant in Guangdong Province.However,due to the large population,the amount of water resources per capita in Guangdong Province is only at the nationalaverage level,and the temporaland spatialdistributions of water resources have the characteristic of nonuniformity.Meanwhile,the province's economy and population are centralized in downstream and delta areas,and the nonuniformity in terms of the environment,resources,population,and economy causes a large discrepancy between the supply of and demand for water resources in some areas. Water shortage due to resources,engineering,and water quality reasons exist to various extents in Guangdong Province.

Fig.1.Location of Guangdong Province and regional map of research areas.
In this study,the whole province was divided using a threelevel regionalization scheme.The frst-level district was the entire province,the second-level districts were the class III water resources areas in the province,including 13 areas,and the third-level districts were the prefectural-level cities in each second-level district,including 45 areas.The detailed regional division is illustrated in Fig.1.The research area codes indicated in Fig.1 are the codes of the third-level districts,which contain two parts:the letter corresponds to a second-level district in Guangdong Province,and the digit part is the code of each prefectural-level city.See Table 1 and Table 2 for the meaning of the codes.
2.2.Data sources and processing
Water resources sequences of each research area from 1956 to 2000 were analyzed in this study.Because the amount of water resources that can be captured from rainfall is related to the area,Eq.(1)was applied to convert each sequence of the total amount of water resources into a sequence of the average amount of water resources per area to guarantee the accuracy of the results.The average amount of water resources per unit area(3AWR)was used as the analysis object:

wherewij,Wij,andAijare the 3AWR,total amount of water resources,and area of thejth region in theith year,respectively.The frst research area is Guangdong Province,thesecond to fourteenth research areas are the second-level districts,and the ffteenth to ffty-ninth research areas are the third-level districts.

Table 1 Codes of second-level districts.

Table 2 Codes of prefectural-level cities.
3.Research methods
3.1.Cloud model
3.1.1.Concept andnumericalcharacteristics ofcloudmodel
The cloud model,as a cognition model of uncertainty,is an approach to realizing the bidirectional conversion between a qualitative concept and its quantitative description (Li and Du,2005;Li et al.,1995;Yang and Li,1998;Di et al.,1999;Li,2000).The detailed defnition of the cloud model is as follows:Uis a quantitative universe of discourse described by accurate numbers,andCis a qualitative concept inU;if there is a quantitative valuex∈U,xis a stochastic implementation ofC,and the membership degree ofxinC,i.e.,μ(x)∈[0,1],is a random number with a stable trend;the distribution ofxinUis called a cloud;eachxis called a cloud droplet;and many cloud droplets form a cloud(Li and Du,2005).Each cloud droplet is an implementation of the qualitative concept in the quantitative universe of discourse.The implementation comes with some uncertainty and the membership degree of the cloud droplet has its own degree of fuzziness.Therefore,the cloud droplet and its membership degree can both be described by probability distribution functions.The normal distribution function is the most commonly used distribution function in natural and social sciences.The normal cloud model is a fundamental cloud model and was therefore used in this study.
The shape of the cloud model refects the general features of the qualitative concept.Three digital parameters,expectation(Ex),entropy(En),and excess entropy(He),represent the numerical characteristics of the cloud model.Conversely,the generation of cloud droplets can also be accomplished using the numerical characteristics of the cloud model.

Fig.2.Cloud modelof young people and its numerical characteristics.
For example,Fig.2 shows a cloud model of young people which is used to explain the concepts ofEx,En,andHe.Exis the expectation of the cloud droplet(x)with respect to its distribution in the universe of discourse(U).In other words,it is the most representative sample of the qualitative concept (C).Usually,the most representative age of young people is considered to be 25.Therefore,theExvalue of the cloud model of young people is 25.In Fig.2,the cloud droplets become more concentrated and the membership degree(μ(x)) increases to the vicinity of 25,which conforms to the common expectation of the age of young people.Enis a measure of the uncertainty of samples inCand represents the degree of discreteness of the cloud droplets.The greater the value ofEnis,the more discrete the cloud droplets are.Enalso refects whether the range of the cloud droplet values is acceptable forCinU.The value ofEnis jointly determined by the randomness and fuzziness ofC.The more explicitCis,the smaller the value ofEnis.Normally,the range of the cloud droplet values is[Ex-3En,Ex+3En].According to various understandings,the age range of young people is[16,34],so the value ofEnis calculated to be 3.However,the most representative age range of young people is[22,28].As shown in Fig.2,the cloud droplets are concentrated in the interval [22,28]with higher membership degrees,and the intervals [16,22]and[28,34]have fewer cloud droplets and lower membership degrees.He,i.e.,the entropy's entropy,is a measure of the entropic uncertainty.It is jointly determined by the randomness and fuzziness ofEn.Because the perception of the age range of young people is relatively uniform,Heis small,and its value is set to be 0.1.This means that the uncertainty ofEnis low,and the cloud shown in Fig.2 is less thick.
According to the analysis described above,it is clear that the mapping between qualitative concepts and quantitative values can be achieved using a cloud model,which provides a new approach for related analyses and evaluations.In this study,Exrepresents the mean value of the water resources sequence,Enrepresents the nonuniformity of the temporal and spatial distributions of the water resources sequence,andHerepresents the stability of the distribution's nonuniformity.
3.1.2.Computation of cloud model
The algorithm of a cloud model,including the forward normal cloud generator,the backward normal cloud generator, theX-conditional cloud generator,and theY-conditional cloud generator,is called the cloud generator(Li and Du,2005). Based on the requirements of this study,only the details of the forward and backward normal cloud generators are introduced.
The forward normal cloud generator is the mapping from qualitative concepts to quantitative values.It generates cloud droplets according to the numerical characteristics,i.e.,Ex,En, andHe,and the algorithm is as follows:
(1)A normal random numberwithEnas the expectation andas the variance is generated.
(2)A normal random numberxwithHeas the expectation andas the variance is generated.
(4)xwith the membership degree μ(x)becomes a cloud droplet in the universe of discourseU.
(5)These steps are repeated until enough cloud droplets are generated according to the requirements.
The backward normal cloud generator is a method of performing the conversion from quantitative values to qualitative concepts.It converts a certain amount of accurate data into a qualitative concept described by numerical characteristics(Ex,En,andHe).The algorithm is based on statistical principles. There are actually two algorithms:one requires a membership degree,while the other one does not.In practical application, it is easy to provide a set of data that expresses a qualitative concept,but it is usually hard to determine the membership degree.Hence,the algorithm used in this study does not require the membership degree.The computation formulas are as follows:
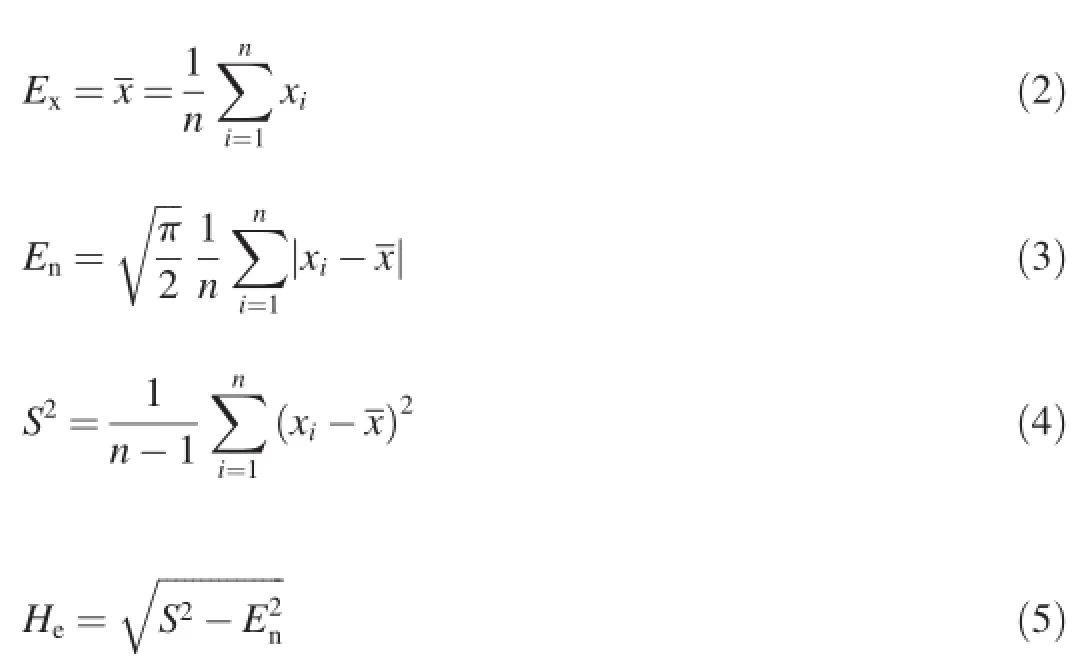
wherexi,n,x,andS2are the value of a cloud droplet,the number of cloud droplets,the mean value of cloud droplets, and the variance of cloud droplets,respectively.
3.2.Methods of trend analysis
3.2.1.Rescaled range analysis
Hurst(1951)proposed therescaled rangeanalysis method when he summarized hydrological data collected through years of observation from the Nile River.This method analyzes the smoothness of a fractal time series based on the asymptotic pattern of the rescaled range of the process.
First,the accumulated deviation of the mean of a time series over time is computed.The computation formulas are

wherey(i)is a time series,(y)τis the mean ofy(i)over time τ, andY(t,τ)is the accumulated deviation of(y)τover time τ.
Then,the rangeRand the standard deviationSof the time series are computed.The computation formulas are

The rescaled rangeR/Sfollows a power law relationship with time τ,which can be computed by the linear regression method,and the computation formula is

whereHis the Hurst index andcis a constant.His an important parameter indicating the characteristics of the time series,and the value ofHranges from 0 to 1.The time series has different characteristics whenHhas different values. When the value ofHis 0.5,it indicates a pure random walk, which means that there is no correlation between any current elements and future elements in the time series.When the value ofHis between 0 and 0.5,it indicates that the time series has anti-persistent behavior,which means that the trend of the time series will be reversed.The strength of the anti-persistent behavior increases asHapproaches 0.When the value ofHis between 0.5 and 1,it indicates persistent behavior,which means that the trend of time series will be persistent.The strength of the persistent behavior increases asHapproaches 1.In this study,the persistence analysis of the trend variations of the time sequences of three numerical characteristics was based on the rescaled range analysis.
3.2.2.Wavelet analysis
The wavelet analysis is a mathematical method that provides a view of a time series at a time scale,expressing the process in terms of averages and changes of averages at a continuous large time scale(Zou et al.,2012).In the wavelet analysis,a time series is decomposed into several basis functions(wavelets)which are localized in time and limited in a specifed frequency range.Thus,the wavelet analysis is a suitable method for investigating the wave power of phenomena limited in both time and frequency.
Since the time series is mapped to the time-frequency domain,the wavelet transform has two parameters corresponding to time and frequency,respectively.There are two types of wavelet transform,the continuous transform and the discrete transform.The continuous wavelet transform is not orthonormal,whilethediscretewavelettransform can construct an orthonormal set.For a time seriesx(i),the discrete wavelet transform is expanded as follows:


The variance of the Mexican hat function(MHF)wavelet is written as

As a common wavelet basis,one of Daubechies wavelets (Daubechies,1988),i.e.,the Db8 wavelet function,in which 8 indicates an order,was used in this study to analyze the time sequences of three numerical characteristics of the cloud model.The Db8 wavelet function is a biorthogonal compactly supported wavelet and has the advantages of orthogonality, compact support,and smoothness.
4.Results and discussion
4.1.Temporal distribution characteristics of water resources
Considering the 3AWR time sequence of each research area as the research object,the backward normal cloud generator was used to compute the numerical characteristics of each cloud model.The computational results for Guangdong Province and the second-level districts are shown in Table 3. The computation results ofEx,En,andHeas well as the trend lines of the third-level districts in the main river basins(the Beijiang,Xijiang,Dongjiang,and Hanjiang river basins)are shown in Fig.3.In Fig.3,the third-level districts in the main river basins are ranked,left to right,from upstream todownstream and from longer distances to shorter distances from the coastline.

Table 3 Numerical characteristics of cloud model of 3AWR time sequences for Guangdong Province and second-level districts.

Fig.3.Numerical characteristics and trend lines of cloud model of 3AWR temporal distribution of third-level districts in main river basins.
As shown in Table 3,theExvalues of Guangdong Province and the second-level districts vary from 80 to 120,and the range is wide.TheExvalue of Guangdong Province is 103.05. The maximumExvalue of the second-level districts is 118.49 in the Hanjiang River downstream of Bailian City and rivers in East Guangdong,and the minimumExvalue of the secondlevel districts is 80.73 in the Ganjiang River upstream of Dongbei City.Moreover,theExvalues in downstream areas are greater than those in upstream areas in the same river basin,including the Dongjiang and Xijiang river basins,the Beijiang River Delta,and,in particular,the Hanjiang River Basin.The minimum and maximumEnvalues are 17.02 and 31.98,in the Dongjiang River Delta and the Dongjiang River downstream of the Qiuxiang River Estuary,respectively,and theEnvalue of the Dongjiang River upstream of the Qiuxiang River Estuary is 28.18.These three values indicate that theEnvalues in upstream areas of the Dongjiang River Basin are greater than those in downstream areas.The same situation also exists in the Beijiang and Xijiang river basins and the Hanjiang River Basin,but is less evident in the latter.As forHe,the minimum and maximum values are 2.08 and 12.20,in the Ganjiang River upstream of Dongbei City and the Dongjiang River upstream of the Qiuxiang River Estuary,respectively.TheHevalues of the Dongjiang River downstream of the Qiuxiang River Estuary and the Dongjiang River Delta are 6.36 and 3.86,respectively,which means that theHevalues,as in the case ofEn,are also greater in upstream areas than in downstream areas.This is also true in the Beijiang and Xijiang river basins and the Hanjiang River Basin,though it is less evident in the former.
According to Fig.3,theExvalues of the third-level districts in the Beijiang and Xijiang river basins,the Dongjiang River Basin,and the Hanjiang River Basin increased from upstream to downstream over the study period,while the correspondingEnandHevalues decreased.The fndings are consistent with the variation trends ofEx,En,andHeshown in Table 3.
According to this analysis,the 3AWR in downstream areas of the main river basins in Guangdong Province is greater than in upstream areas.In addition,the nonuniformity of the temporal distribution of 3AWR in downstream areas is lesser,and the nonuniformity is also more stable in downstream areas. This means that the 3AWR in downstream areas exhibits less temporal variation and greater stability.The reason lies in the different rainfall conditions in upstream and downstream areas,which have different topographies and distances from the South China Sea.
In order to refect the correspondence between the numerical characteristics of the cloud model and the cloud images, the forward normal cloud generator algorithm was used to draw the cloud image of each area based on the numerical characteristics shown in Table 3.Due to the length limitation of the paper,only four cloud images are presented in Fig.4: the entire province,the Dongjiang River Delta,the Dongjiang River downstream of the Qiuxiang River Estuary,and the Dongjiang River upstream of the Qiuxiang River Estuary.In Fig.4,the horizontal axisxrepresents the 3AWR in units of 104m3/km2,and the vertical axis μ(x)represents the membership degree.It can be seen that the shape of each cloud image and the values of the corresponding numerical characteristics are well matched.Comparing Figs.4(b)and(d),according to the above analysis,a larger value ofExindicates a greaterxvalue of the corresponding image center and a larger3AWR of the corresponding area,thus the 3AWR of the Dongjiang River Delta is larger than that of the Dongjiang River upstream of the Qiuxiang River Estuary.Comparing Figs.4(b)and(c),a larger value of indicates a greater cloud span and a greater nonuniformity of the 3AWR temporal distribution in the corresponding area,thus the nonuniformity of the 3AWR temporal distribution in the Dongjiang River downstream of the Qiuxiang River Estuary is greater than that in the Dongjiang River Delta.Comparing Figs.4(c)and(d),a larger value ofHeindicates a thicker cloud,which means that the nonuniformity of the 3AWR temporal distribution is less stable,thus the nonuniformity of the 3AWR temporal distribution in the Dongjiang River downstream of the Qiuxiang River Estuary is more stable than that in the Dongjiang River upstream of the Qiuxiang River Estuary.
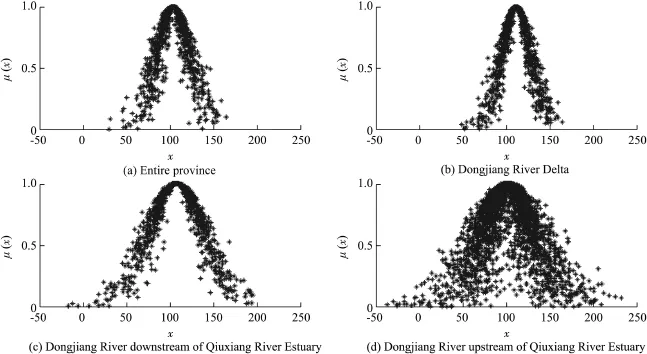
Fig.4.Cloud images of 3AWR temporal distribution for different regions.
4.2.Spatial distribution characteristics of water resources
Water resources data for the third-level districts from 1956 to 2000 were used to analyze the spatial distribution of water resources in research areas.To eliminate the effect of area on the amount of water resources and ensure the accuracy of analysis,the amount of water resources per square kilometer was taken in the analysis of the spatial variation of water resources in Guangdong Province.In this study,the research area was 177 579 km2,and accordingly,there were 177 579 calculation units,which were all in the third-level districts. The backward normal cloud generator was used to calculate the numerical characteristics of the cloud model of spatial distribution of average water resources from 1956 to 2000 in Guangdong Province.The value ofExis 103.05,which is equal to that of the cloud model of 3AWR temporal distribution in Guangdong Province listed in Table 3.The values ofEnandHeare 20.30 and 6.76,respectively,which are greater than those of the cloud model of 3AWR temporal distribution in Guangdong Province listed in Table 3,which means that, compared with the temporal distribution,the nonuniformity of the spatial distribution of water resources in Guangdong Province is slightly higher and less stable.
The backward normal cloud generator was used to calculate the numerical characteristics of the cloud model of spatial distribution of water resources from 1956 to 2000 in Guangdong Province.Then,the least-squares method was used with the time sequences of three numerical characteristics to analyze the trends inEx,En,andHevalues.In addition,the rescaled range analysis method(Wang et al.,2002)was used to calculate the Hurst index of the time sequences of three numerical characteristics to refect the persistence of the trend variations.The results are given in Table 4,in which it can be seen that the amount of water resources in Guangdong Province increased from 1956 to 2000.However,the nonuniformity of thespatialdistribution of waterresourcesin Guangdong Province decreased,and the stability of the nonuniformity improved.The Hurst indices of the time sequences of three numerical characteristics are greater than 0.5, which indicates that the trend variations ofEx,En,andHeare persistent.This means that,in the future,the amount of water resources in Guangdong Province will continuously increase, while the nonuniformity of the spatial distribution of waterresources will decline and the stability of the nonuniformity will be enhanced.The Mann-Kendall(M-K)test(Mann,1945; Kendall,1948)was used to evaluate the signifcance of the trends in the time sequences ofEx,En,andHe.The results show that the M-K test values of the time sequences ofExandEnsatisfy the 90%signifcance level,and the M-K test value of the time sequences ofHesatisfes the 95%signifcance level.The Hurst index and the M-K test value indicate the long-term persistence(LTP)in trend analysis,but the shortterm persistence(STP)is also vital.The lag-1 autocorrelation,which is commonly used to quantify time series persistence,was used to evaluate the STP of the time sequences ofEx,En,andHe(Damien et al.,2015).The lag-1 autocorrelation indices of the time sequences ofEx,En,andHeare-0.118 7, -0.120 7,and-0.016 3,respectively.Their absolute values are all less than 0.3,which indicates that the STPs of the time sequences of the three numerical characteristics are poor.

Table 4 Analysis results of numerical characteristics of cloud model of spatial distribution of water resources from 1956 to 2000 in Guangdong Province.
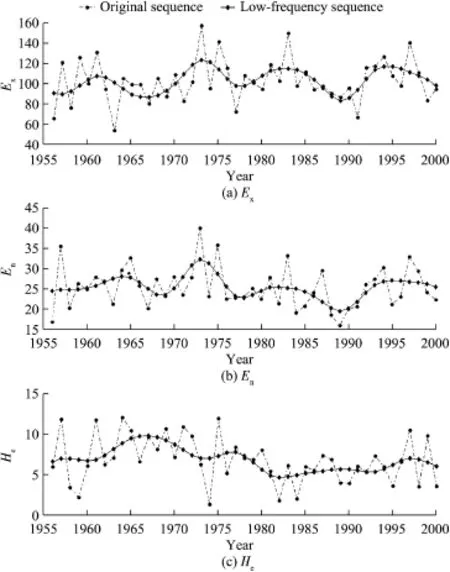
Fig.5.Original and low-frequency sequences ofEx,En,andHeof cloud model of spatial distribution of water resources in Guangdong Province from 1956 to 2000.
In order to analyze the local trend of the time sequences ofEx,En,andHe,the Db8 wavelet function was used to perform the wavelet decomposition and reconstruction of the time sequences of three numerical characteristics at a binary scale (Wang et al.,2005).As a result,low-frequency sequences ofEx,En,andHewere obtained(Fig.5).According to the lowfrequency sequence shown in Fig.5(a),the trend in the amount of water resources can be divided into three stages:the frst stage was from 1956 to 1973,during which the amount of water resources was generally increasing,with a slow increase atfrst(1956-1961),followed by a smalldecrease (1961-1967),and then a rapid increase(1967-1973);the second stage was from 1973 to 1989,during which the amount of water resources was decreasing except for a certain increase from 1978 to 1982;and the third stage was from 1989 to 2000, during which the amount of water resources varied in a pattern of increasing frst and then decreasing,and the peak occurred in 1994.According to the low-frequency sequence shown in Fig.5(b),the trend in the nonuniformity of the spatial distribution of water resources can also be divided into three stages: the frst stage was from 1956 to 1973,during which the general trend was increasing with a slow increase at frst (1956-1964),then a small decrease(1964-1969),and fnally a rapid increase(1969-1973);the second stage was from 1973 to 1989,during which the general trend was decreasing except for a small increase from 1978 to 1982;and the third stage was from 1989 to 2000,during which the overall trend was characterized by a rapid increase at frst and then a slow decrease, with a peak occurring in 1995.According to the low-frequency sequence shown in Fig.5(c),the trend in the stability of the spatial distribution nonuniformity of water resources can be divided into three stages as well:the frst stage was from 1956 to 1967,during which the general trend was decreasing,with an initial period of no major variation(1956-1960)and a signifcantly decreasing period from 1960 to 1967;the second stage was from 1967 to 1982,during which the general trend was increasing except for a small decrease from 1973 to 1977; and the third stage was from 1982 to 2000,during which the general trend was decreasing with a continuous decrease at frst(1982-1997)except for a small increase from 1989 to 1992,and an increase from 1997 to 2000.
4.3.Relationships between numerical characteristics of cloud model of temporal and spatial distributions of water resources and precipitation
To measure the correlations between the numerical characteristics of the cloud model of temporal and spatial distributions of water resources in Guangdong Province and precipitation,the least-squares method was used to determine the linear relationships between the numerical characteristics and precipitation.Fig.6 provides the ftting curves of the numerical characteristics of the temporal distribution of water resources against the average annual precipitation in the thirdlevel districts.Fig.7 provides the ftting curves of the numerical characteristics of the spatial distribution of water resources againstthe annualprecipitation in Guangdong Province from 1956 to 2000.According to the data shown in Figs.6 and 7,the numerical characteristics of temporal and spatial distributions of water resources are positively correlated with precipitation,except forHe.The correlations betweenExvalues and the average annual precipitation are relatively strong,and even stronger from the view of spatial distribution.The correlation between theEnvalue of the temporal distribution of water resources and precipitation is relatively weak,but the correlation between theEnvalue of thespatial distribution of water resources and precipitation is strong,with a coeffcient of determination above 0.6.Almost no correlation is found betweenHevalues of the temporal distribution of water resources and precipitation.Comparatively,the correlation betweenHevalues of the spatial distribution of water resources and precipitation is slightly better, but not very signifcant.

Fig.6.Correlation of numerical characteristics of temporal distribution of water resources with average annual precipitation in third-level districts.
5.Conclusions
This paper describes research on the temporal and spatial distribution characteristics of the water resources in Guangdong Province from 1956 to 2000 based on a cloud model.In addition,the spatial variation of temporal distribution characteristics and the temporal variation of spatial distribution characteristics of water resources in Guangdong Province were analyzed.The relationships between the temporal and spatial distribution characteristics of water resources and precipitation were also analyzed.The conclusions can be summarized as follows:
(1)The cloud model is capable of providing a quantitative description of the nonuniformity of the temporal and spatial distribution characteristics of water resources,and it can also be used to quantitatively analyze the stability of the nonuniformity through the cloud image.
(2)The amount of regional water resources of Guangdong Province is affected by geographic location and local precipitation.Downstream areas possess more abundant water resources than upstream areas and greater precipitation usually results in more abundant water resources.The nonuniformity of the temporal distribution of water resources in downstream areas is greater than that in upstream areas,and the nonuniformity ispositively correlated with precipitation.The nonuniformity of the temporal distribution of water resources in downstream areas is more stable than that in upstream areas, and the stability of the nonuniformity of the temporal distribution of water resources has almost no correlation with precipitation.
(3)In Guangdong Province,the nonuniformity of the spatial distribution of water resources is greater than that of the temporal distribution of water resources,and the positive correlation of the former with precipitation is higher than that of the latter.The stability of the nonuniformity of the spatial distribution of water resources is weaker than that of thetemporal distribution of water resources.Although the former has a higher correlation with precipitation,but the two correlations are both not signifcant.

Fig.7.Correlation of numerical characteristics of spatial distribution of water resources with annual precipitation in third-level districts from 1956 to 2000.
(4)From 1956 to 2000,the amount of water resources in Guangdong Province was on the rise generally,the nonuniformity of the spatial distribution of water resources declined,and thestabilityofthenonuniformityincreased.Inthelongterm,the general variation trends of the three numerical characteristics are persistent and the local trends can be divided into three stages.As for the amount of water resources and the nonuniformity of the spatial distribution of water resources,the trend was upward in the earlier stage and downward in the middle stage,andinthelatterstagetherewasanincreaseatfrstandthen a decrease.In contrast,the trends of the stability of the nonuniformity are the inverse of those of the other two characteristics,and its fuctuation range is the narrowest.
Conway,D.,Persechino,A.,Ardoin-Bardin,S.,Hamandawana,H., Dieulin,C.,Mahˊe,G.,2009.Rainfall and water resources variability in Sub-Saharan Africa during the twentieth century.J.Hydrometeorol.10(1), 41-59.http://dx.doi.org/10.1175/2008JHM1004.1.
Dai,T.,Shao,D.G.,Huang,X.F.,2007.Research on space-time variability of water resources based on chaos theory.Eng.J.Wuhan Univ.40(5),15-19, 24(in Chinese).
Damien,D.,Chul,E.C.,Petri,R.,2015.Strategies for reducing the climate noise in model simulations:Ensemble runs versus a long continuous run. Clim.Dyn.44(5),1367-1379.
Daubechies,I.,1988.Orthonormal bases of compactly supported wavelets. Commun.Pure Appl.Math.41(7),909-996.http://dx.doi.org/10.1002/ cpa.3160410705.
Di,K.C.,Li,D.R.,Li,D.Y.,1999.Cloud theory and its applications in spatial data mining and knowledge discovery.J.Image Graph.4(11),929-935(in Chinese).
Disalvo,A.C.,Hart,S.C.,2002.Climatic and stream-fow controls on tree growth in a western montane riparian forest.Environ.Manag.30(5), 678-691.http://dx.doi.org/10.1007/s00267-002-2719-2.
Hannah,D.M.,Smith,B.P.G.,Gurnell,A.M.,McGregor,G.R.,2000.An approach to hydrograph classifcation.Hydrol.Process.14(2),317-338. http://dx.doi.org/10.1002/(SICI)1099-1085(20000215)14:2<317::AID-HY P929>3.0.CO;2-T.
Harris,N.M.,Gurnell,A.M.,Hannah,D.M.,Petts,G.E.,2000.Classifcation ofriverregimes:A contextforhydroecology.Hydrol.Process. 14(16-17),2831-2848.http://dx.doi.org/10.1002/1099-1085(200011/ 12)14:16/17<2831::AID-HYP122>3.0.CO;2-O.
Hurst,H.E.,1951.Long-term storage capacity of reservoirs.Trans.Am.Soc. Civ.Eng.116(1),770-799.
Kendall,M.G.,1948.Rank Correlation Methods.Charles Griffn,London.
Li,D.Y.,Meng,H.J.,Shi,X.M.,1995.Membership clouds and membership cloud generators.J.Comput.Res.Dev.32(6),16-21(in Chinese).
Li,D.Y.,2000.Uncertainty in knowledge representation.Eng.Sci.2(10), 73-79(in Chinese).
Li,D.Y.,Du,Y.,2005.Uncertainty Artifcial Intelligence.China National Defence Industry Press,Beijing(in Chinese).
Lilover,M.J.,Lips,U.,Laaneraru,J.,Liljebladh,B.,1998.Flow regime in the Irbe Strait.Aquat.Sci.60(3),253-265.http://dx.doi.org/10.1007/s000 270050040.
Ling,H.B.,Xu,H.L.,Fu,J.Y.,2013.Temporal and spatial variation in regional climate and its impact on runoff in Xinjiang,China.Water Resour.Manag. 27(2),381-399.http://dx.doi.org/10.1007/s11269-012-0192-0.
Lins,H.F.,Slack,J.R.,1999.Streamfow trends in the United States.Geophys. Res.Lett.26(2),227-230.
Lins,H.F.,Slack,J.R.,2005.Seasonal and regional characteristics of US streamfow trends in the United States from 1940 to 1999.Phys.Geogr. 26(6),489-501.http://dx.doi.org/10.2747/0272-3646.26.6.489.
Lovejoy,S.,Schertzer,D.,Tsonis,A.A.,1987.Functional box counting and multiple elliptical dimensions in rain.Science 235(4792),1036-1038. http://dx.doi.org/10.1126/science.235.4792.1036.
Mann,H.B.,1945.Nonparametric tests against trend.J.Econ.Soc.13(3), 245-259.http://dx.doi.org/10.2307/1907187.
Milly,P.C.D.,Dunne,K.A.,Vecchia,A.V.,2005.Global pattern of trends in streamfow and water availability in a changing climate.Nature 438, 347-450.http://dx.doi.org/10.1038/nature04312.
Petts,G.E.,Bickerton,M.A.,Crawford,C.,Lerner,D.N.,Evans,D.,1999. Flow management to sustain groundwater-dominated stream ecosystems. Hydrol.Process.13(3),497-513.http://dx.doi.org/10.1002/(SICI)1099-1085(19990228)13:3<497::AID-HYP753>3.0.CO;2-S.
Sivakumar,B.,2000.A preliminary investigation on the scaling behavior of rainfall observed in two different climates.Hydrol.Sci.J.45(2),203-219. http://dx.doi.org/10.1080/02626660009492320.
Wang,W.S.,Ding,J.,Li,Y.Q.,2005.Hydrology Wavelet Analysis.Chemical Industry Press,Beijing(in Chinese).
Wang,X.L.,Hu,B.Q.,Xia,J.,2002.R/S analysis method of trend and aberrance point on hydrological time series.Eng.J.Wuhan Univ.35(2),10-12 (in Chinese).
Wei,G.W.,Liu,H.,Zheng,F.,Weng,L.D.,2004.The points of water evaluation in American.Express Water Resour.Hydropower Inf.25(9),7,21 (in Chinese).
Xu,J.J.,Yang,D.W.,Liu,Z.Y.,Lei,Z.D.,2007.Analysis of spatial-temporal variability of water resources in upstream of Yangtze river using distributed hydrological mode.J.China Hydrol.27(3),10-15,28(in Chinese).
Yang,Z.H.,Li,D.Y.,1998.Plane model and its application in forecast.J. Comput.21(11),962-968(in Chinese).
Zhang,J.G.,Liu,X.R.,2000.Information entropy analysis on nonuniformity of precipitation distribution in time-space.Adv.Water Sci.11(2),133-143 (in Chinese).
Zhang,Y.Y.,Zhang,S.F.,Xia,J.,Hua,D.,2013.Temporal and spatial variation of the main water balance components in the three rivers source region, China from 1960 to 2000.Environ.Earth Sci.68(4),973-983.http://dx. doi.org/10.1007/s12665-012-1800-2.
Zou,C.X.,Shen,X.D.,Li,H.Y.,Li,X.Z.,Li,Z.J.,2012.Wavelet analysis of spring climate characteristics in arid aeolian area of agro-pastoral ecotone in China.Water Sci.Eng.5(3),269-277.http://dx.doi.org/10.3882/j.issn. 1674-2370.2012.03.003.
Received 28 February 2015;accepted 16 September 2015
Available online 12 December 2015
This work was supported by the National Science and Technology Major ProjectofWaterPollutionControland Treatment(GrantsNo.2014ZX07405002, 2012ZX07506007,2012ZX07506006,and 2012ZX07506002),the Natural Science Foundation of the Anhui Higher Education Institutions of China(Grant No. KJ2016A868),and the Priority Academic Program Development of Jiangsu Higher Education Institutions.
*Corresponding author.
E-mail address:pangyonghhu@163.com(Yong Pang).
Peer review under responsibility of Hohai University.
http://dx.doi.org/10.1016/j.wse.2015.09.001
1674-2370/©2016 Hohai University.Production and hosting by Elsevier B.V.This is an open access article under the CC BY-NC-ND license(http:// creativecommons.org/licenses/by-nc-nd/4.0/).
 Water Science and Engineering2015年4期
- Water Science and Engineering的其它文章
- Observation and modeling of tide-and wind-induced surface currents in Galway Bay
- Deposited sediment settlement and consolidation mechanisms
- Seepage and stress analysis of anti-seepage structures constructed with different concrete materials in an RCC gravity dam
- Numerical simulation of fow past twin near-wall circular cylinders in tandem arrangement at low Reynolds number
- Analysis of effect of nicotine on microbial community structure in sediment using PCR-DGGE fngerprinting
- Impacts of water quality variation and rainfall runoff on Jinpen Reservoir, in Northwest China