
Analysis of spatio-temporal evolution of droughts in Luanhe River Basin using different drought indices
2015-01-16 01:21KaiyanWangQiongfangLiYongYangMingZengPenghengLiJiexiangZhang
Water Science and Engineering 2015年4期
Kai-yan Wang,Qiong-fang Li,*,Yong Yang,Ming Zeng,Peng-heng Li, Jie-xiang Zhang
aCollege of Hydrology and Water Resources,Hohai University,Nanjing 210098,PR China
bCenter for International River Research,Hohai University,Nanjing 210098,PR China
cChina Railway 16th Bureau Group Co.,Ltd.,Beijing 100018,PR China
Analysis of spatio-temporal evolution of droughts in Luanhe River Basin using different drought indices
Kai-yan Wanga,b,Qiong-fang Lia,b,*,Yong Yangc,Ming Zenga,b,Peng-cheng Lia,b, Jie-xiang Zhanga,b
aCollege of Hydrology and Water Resources,Hohai University,Nanjing 210098,PR China
bCenter for International River Research,Hohai University,Nanjing 210098,PR China
cChina Railway 16th Bureau Group Co.,Ltd.,Beijing 100018,PR China
Based on the monthly precipitation and air temperature from 1960 to 1989 in the Luanhe River Basin,the standardized precipitation evapotranspiration index(SPEI)and standardized precipitation index(SPI)at three-and six-month time scales and the self-calibrating Palmer drought severity index(sc-PDSI)were calculated to evaluate droughts in the study area.Temporal variations of the drought severity from 1960 to 1989 were analyzed and compared based on the results of different drought indices,and some typical drought events were identifed.Spatial distributions of the drought severity according to the indices were also plotted and investigated.The results reveal the following:the performances of different drought indices are closely associated with the drought duration and the dominant factors of droughts;the SPEI is more accurate than the SPI when both evaporation and precipitation play important roles in drought events;the drought severity shown by the sc-PDSI is generally milder than the actual drought severity from 1960 to 1989;and the evolution of the droughts is usually delayed according to the sc-PDSI.This study provides valuable references for building drought early warning and mitigation systems in the Luanhe River Basin. ©2015 Hohai University.Production and hosting by Elsevier B.V.This is an open access article under the CC BY-NC-ND license(http:// creativecommons.org/licenses/by-nc-nd/4.0/).
Drought index;Drought assessment;Self-calibrating Palmer drought severity index(sc-PDSI);Standardized precipitation evapotranspiration index (SPEI);Standardized precipitation index(SPI);Luanhe River Basin
1.Introduction
Droughts are the world's most damaging natural hazards (Keyantash and Dracup,2002;Wilhite et al.,2007),affectingenormous portions of the world population(Wilhite,2000).In recent decades,China has experienced severe droughts,which have caused large economic losses and severe societal damage every year(Xin et al.,2006;Lu et al.,2010;Wu et al.,2011), particularly in northern China(Liang et al.,2006;Qian et al., 2011;Wang et al.,2012).Many studies over recent decades have focused on the droughts in northern China.Because a drought index is an important means of monitoring and evaluating droughts,a number of drought indices have been developed and applied(Heim,2002).At present,the selfcalibrating Palmer drought severity index(sc-PDSI)(Wells et al.,2004;Yu,2007)and the standardized precipitation index(SPI)(McKee et al.,1993)are the most widely used drought indices in global and regional drought monitoring,and the standardized precipitation evapotranspiration index(SPEI)(Vicente-Serrano et al.,2010)is becoming popular in drought assessment.Recently,the formulation of a multivariate drought index by assembling different components of the water cycle(such as precipitation,soil moisture,evaporation, and runoff),and geomorphologic parameters(Anderson et al., 2011,2012;Hao and AghaKouchak,2013,2014;Brown et al., 2008;Zhang and Jia,2013;Mu et al.,2013;Hao et al.,2014) has attracted wide attention.However,the applicability of a multivariate drought index is limited by the scarcity in observations of hydrological variables over a large spatial scale. For example,the soil moisture data needed in these approaches are diffcult to obtain.Thus,drought indices based only on the easily obtained hydro-meteorological variables (e.g.,precipitation and temperature)have gained wide acceptance.As a region prone to droughts,northern China has been a site for drought investigation and assessment by many researchers.Wang and Zhai(2003)calculated the Palmer moisture anomaly index(Zindex)based on monthly precipitation from 1950 to 2000 and showed an increasing trend in drought intensity and frequency in northern China's main agricultural area.Zou et al.(2005)calculated the Palmer drought severity index(PDSI)based on the monthly air temperature and precipitation from 1951 to 2003 and demonstrated a signifcant increase in drought areas in northern China,which has suffered a severe dry period since the late 1990s.Yu et al.(2014)computed the SPEI based on monthly precipitation and air temperature from 1951 to 2010 and revealed that consecutive multi-year severe droughts were frequent in northern China and drought durations have expanded over decades,with the longest ones occurring during the 1990s and 2000s.Although these indices have been used in northern China,detailed comparison of their performances in the assessment of typical historical droughts has seldom been reported.The objective of this study was to investigate the applicability of the sc-PDSI,SPI,and SPEI by monitoring the spatio-temporal evolution of droughts from 1960 to 1989 in the Luanhe River Basin.According to the results of evaluation of drought evolution using different drought indices,three typical historical drought events,the 1962/1963 drought,1972 drought,and 1989 drought,were identifed,and more detailed analysis on the performances of these three drought indices in evaluating the three typical historical drought events was carried out.This study can provide valuable references for building drought early warning and mitigation systems in semi-arid and semi-humid regions.
2.Study area
TheLuanheRiverBasin,rangingfrom115°34′Eto119°50′E and 39°02′N to 42°43′N,in the northeastern part of the North China Plain,has a drainage area of 44 750 km2and an average width of 103 km.Originating from the northern foot of the Bayanguertu Mountain in Zhangjiakou,in Hebei Province,the Luanhe River travels through 27 cities and counties of Hebei Province,the Inner Mongolia Autonomous Region,and Liaoning Province,and fnally fows into Bohai Bay.The basin is inclined from northwest to southeast.It contains diverse geomorphic types,and a typical temperate continental climate prevails,where the average temperature is 23.9°C in July and -9°C in January.The annual precipitation ranges from 400 to 700 mm,with an annual mean precipitation of 520 mm,most of which falls from June to September,a period accounting for approximately 80%of the total annual precipitation.The basin contributesalargewatervolumetotheHaiheRiverBasinandis the major water source for the cities of Tianjin,Tangshan,and Chengde.With global climate change,the intensity,duration, and frequency of droughts in the basin have shown increasing trendsoverthe pastdecades.Drought-induced watershortage is increasingly becoming a critical constraint to the sustainable socio-economic developmentofTianjin,Tangshan,and Chengde(Zhangetal.,2013a,2013b).Inaddition,theinfuence of droughts is most serious in the agricultural sector,due to agriculturebeingthelargestwateruser.Therefore,investigation of the spatio-temporal evolution characteristics of droughts using anappropriate droughtindexinthe LuanheRiverBasin is highly useful.The sub-basin,upstream of the Luanxian Hydrological Station,with a drainage area of 44100 km2was selected as the study area(Fig.1).
3.Methods and data
3.1.Methods
In order to determine which drought index can best monitor the evolution of droughts in the Luanhe River Basin,three drought indices(the sc-PDSI,SPEI,and SPI)were selected to evaluate the drought evolution from 1960 to 1989,a period that included several of the most severe droughts historically recorded.Since the SPI is widely used in China,only a brief introduction to the sc-PDSI(Wells et al.,2004)and SPEI (Vicente-Serrano et al.,2010)is given below.
3.1.1.sc-PDSI
The current PDSI valueXiis a weighted sum of the previous PDSI valueXi-1and the current moisture anomaly indexZi,as shown in Eq.(1).

Fig.1.Study area.

wherepandqare the duration factors,and the moisture anomaly indexZis calculated as

whereKis the climatic characteristic value;dis the moisture departure;K˜ refects the monthly average precipitation and soil conditions;andandare the averages of potential evapotranspiration,recharge,runoff,precipitation, loss in soil water,and moisture departure,respectively.The potential evapotranspiration is estimated using Thornthwaite's method(Thornthwaite,1948),anddis the difference between the actual precipitationPin a month and a climatically appropriate amount of precipitationP∧needed to maintain a normal soil moisture level for the single month,i.e.,

wherecan be calculated as follows:

The algorithm described above is that of the traditional PDSI based on empirically derived coeffcients at a few weather stations in the USA,which are not applicable to diverse climatological regions.The sc-PDSI provides a solution by automatically calculating the climate characteristic value and the duration factors based on the historical climate data at the meteorological stations(Wells et al.,2004).
(1)Automated calculation ofK
For calculation ofK,˜Kshould be determined frst as follows:

whereandare the expected average and observed average values of PDSI,respectively.Palmer defned the range of non-extreme PDSI values varying from-4.00 to 4.00.To avoid an average PDSI value of zero,the tails of the PDSI distribution rather than its central tendency are used in Eq.(7), andKcan be calculated as follows:

wherefeis the frequency of extreme events.In this study,fewas determined to be 2%through defnition of extreme drought events with a recurrence interval of 50 years.
(2)Automated calculation ofpandq
Based on the linear relationship between the summation of theZindex and the PDSI value,pandqcan be calculated as

whereCis the value of the calibration index(e.g.,-4,-3,…, 4),mis the slope of the line,andbis its intercept in the vertical direction.
3.1.2.SPEI
The SPEI is built by introducing evaporation into the SPI. According to Thornthwaite(1948),the monthly potential evapotranspiration is computed as follows:
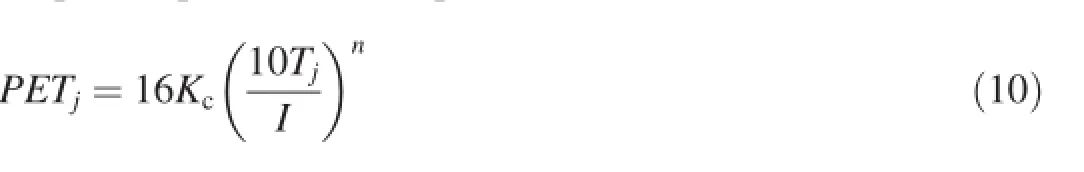
wherePETjis the potential evapotranspiration of monthj;Tjis the mean temperature of monthj;Iis the heat index,which is the summation of the monthly index values over a year;nis a coeffcient depending onI,andn=6.75×10⁻⁷I3-7.71× 10⁻⁵I2+1.79×10⁻²I+0.492;andKcis the correction coeffcient as a function of the elevation and month.
The difference between the monthly precipitation and potential evapotranspiration of monthjis

The calculatedDjvalues can be aggregated at different time scales,following the same procedure as that of the SPI.The accumulated difference at thek-month time scale for yeari, expressed as,is calculated as follows:

whereDi,lis the value ofDlfor yeari,andkequals 3 for the three-month SPEI and 6 for the six-month SPEI.
The log-logistic distribution was selected for standardizing theDseries to obtain the SPEI.The probability density function of a variablexin the log-logistic distribution is expressed as

where α,β,and γ are the scale,shape,and origin parameters, respectively.ForDvalues in the range ofD>γ,the three parameters in the Pearson type III distribution can be obtained following Singh et al.(1993).Thus,the probability distribution function of theDseries is

Then,the SPEI valueXscan be easily obtained by means of the standardized value ofF(x)according to the classical approximation by Abramowitz and Stegun(1965):

3.2.Data collection and processing
The daily precipitation and daily air temperature from 1960 to 1989 were collected at six meteorological stations in or neighboring the Luanhe River Basin from the international exchanging stations of China Meteorological Administration, including Chengde(40.98°N,117.95°E),Duolun(42.18°N, 116.47°E),Fengning(41.22°N,116.63°E),Qinglong(40.40°N, 118.95°E),Weichang (41.93°N,117.75°E),and Zunhua (40.20°N,117.95°E)meteorological stations.The monthly precipitation and monthly air temperature from 1960 to 1989 were computed based on the daily values.Considering the spatial unevenness of underlying conditions,the study area was divided into 699 grid cells with sizes of 10 km×10 km.The inverse distance weighting interpolation method was employed to spatially interpolate the precipitation and air temperature for every grid cell.The variation of air temperature with elevation should be considered in the interpolation.The monthly sc-PDSI,SPEI,and SPI of every grid cell were computed thereafter,and the temporal variations of the sc-PDSI,SPEI,and SPIwere analyzed and compared.The drought severity was classifed according to different drought indices(Alley,1984),as shown in Table 1.Then,typical drought events were identifed and further investigated,the spatial distributions of the typical drought events were plotted,and the driving forces were further explored.
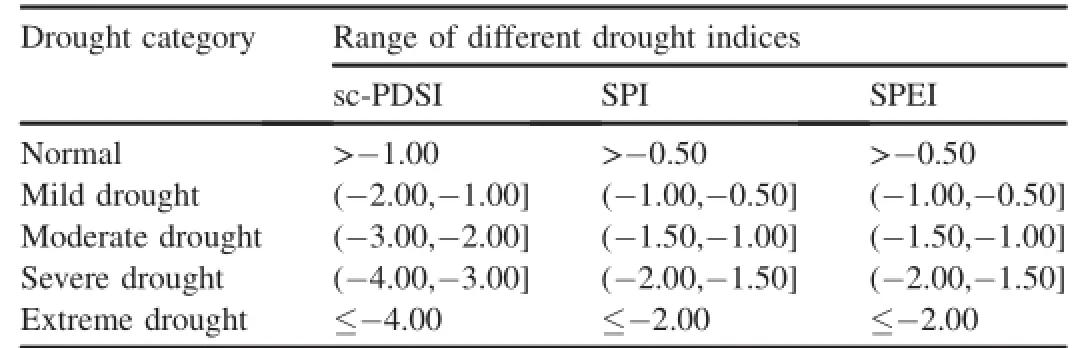
Table 1 Drought categories according to sc-PDSI,SPI,and SPEI(Alley,1984).
4.Results and discussion
4.1.Identifcation of typical drought events based on
temporal variations of different drought indices
Fig.2 shows the temporal variations of different drought indices in the Luanhe River Basin from 1960 to 1989.It can be seen that different drought indices demonstrate similar variation patterns in the long term,but display some differences in particular drought events in terms of the drought severity and drought duration(Table 2).All the drought indices detect the 1962/1963 drought,but they paint different pictures in terms of the drought severity and drought duration:the sc-PDSI shows mild drought in the winter of 1962 and spring of 1963;the three-month SPEI shows moderate drought from the winter of 1962 to spring of 1963;the six-month SPEI shows severe drought in the spring of 1963 and moderate drought in the summer of 1963;the three-month SPI detects extreme drought in the winter of 1962 and moderate drought in the spring and summer of 1963;and the six-month SPI detects severe drought in the winter of 1962,extreme drought in the spring of 1963,and moderate drought in the summer of 1963. Except for the sc-PDSI,which detects moderate drought from the summer to autumn of 1972,all the drought indices show severe drought in the summer of 1972.All the drought indices also detect the 1989 drought,but the drought severity varies with drought indices:both the sc-PDSI and six-month SPI show severe drought in the summer of 1989 and moderate drought in the spring and autumn of 1989;both the six-month SPEI and three-month SPI show moderate drought from the spring to autumn of 1989;and the three-month SPEI shows severe drought in the spring of 1989 and moderate drought in the summer of 1989.Synthesizing the analysis above,we can identify three typical historical drought events:the 1962/1963 drought,1972 drought,and 1989 drought,which were recorded by Zhang et al.(2009).
4.2.Temporal evolution of drought indices for typical drought events
Different drought indices were used to investigate the evolution process of the 1962/1963,1972,and 1989 drought events falling within the gray shaded areas in Fig.2.The temporal variations of different drought indices for the three typical historical drought events are illustrated in Fig.3.

Fig.2.Temporal variations of sc-PDSI,SPEI,and SPI in Luanhe River Basin.
The 1962/1963 drought lasted a relatively long period of time,from October 1962 to June 1963(Zhang et al.,2008). According to the historical records,during this period,the monthly rainfall decreased by 20%-40%compared with the average monthly values,aggravating the drought.As shown in Fig.3(a),the SPI displays the largest fuctuations,while the sc-PDSI shows the mildest fuctuations during the drought period.Only the three-month SPEI and three-month SPI detect the beginning of the drought.Both the three-month SPI and six-month SPI detect the end of the drought in July,but the three-month SPEI and six-month SPEI fail to do so.That is because the SPEI considers the impacts of both precipitation and evaporation on droughts,and an apparent increase in airtemperature in July led to an evident rise in evaporation, although the rainfall signifcantly increased in the same period. The sc-PDSI almost fails to detect the 1962/1963 drought due to its inherent disadvantages:the sc-PDSI is calculated under the assumption that runoff cannot occur unless the soil moisture reaches the feld capacity,which is different from the runoff generation mechanism in which runoff is dominated by excessive infltration during the drought event;a crude water balance model used in the PDSI computation cannot better account for the lag between moisture surplus and streamfow (Alley,1984).The three-month SPEI and six-month SPEI show similar drought variation patterns on the whole,with some differences existing in the drought duration and drought severity.Compared with the three-month SPEI,the six-month SPEI shows more severe droughts.For example,in March 1963,there is moderate drought according to the three-month SPEI,but severe drought according to the six-month SPEI.In comparison with the three-month SPI,the six-month SPI shows a signifcant delay in the drought start time due to the six-month cumulative effects of rainfall.The SPI is based only on precipitation,and thus more sensitive to the precipitation variations than SPEI.The drought detected by the SPI is more severe than that detected by the SPEI,and the results of the SPI correspond well to the actual 1962/1963 drought(Zhang et al.,2009).

Table 2 Drought assessment by sc-PDSI,SPEI,and SPI.

Fig.3.Temporal variations of sc-PDSI,SPEI,and SPI for three typical drought events.
The 1972 drought was one of the most severe droughts in the Luanhe River Basin.According to Zhang et al.(2009),the runoff during that period decreased by 56%compared with the mean annual values,reaching its lowest level since 1949.The 1972 drought infuenced nearly 80%of the total cultivated agriculture,and the area residents experienced a serious crisis in drinking water.Some rivers in the basin even suffered cutoff.A decrease in rainfall and an increase in air temperature aggravated the drought.The SPI displays the most signifcant fuctuation,while the sc-PDSI shows the mildest fuctuation(Fig.3(b)).Both the sc-PDSI and SPEI detect the beginning of the drought,but the SPI fails to do so.The drought duration detected by the sc-PDSI,six-month SPEI, and six-month SPI is longer than that detected by the threemonth SPEI and three-month SPI,and the six-month SPEI and six-month SPI detect the end of the drought.The drought severity detected by the sc-PDSI remains milder than those detected by the SPEI and SPI.According to Zhang et al. (2009),the drought in June 1972 was severe.Obviously,the sc-PDSI does not refect the actual drought.In contrast to the performance of the sc-PDSI during the 1962/1963 drought,the sc-PDSI shows no delay in response to the start of the 1972 drought,but it demonstrates a certain delay at the end of the drought.In most cases,the drought detected by the six-month SPEI is more severe than that detected by the three-month SPEI,a result that is similar to the SPI results at different time scales.Generally,the drought severity detected by the SPI is milder than that detected by the SPEI.This might be due to the fact that higher evaporation induced by higher air temperature and less rainfall were the main causes of the 1972 drought(Zhang et al.,2009),and that the SPEI can refect the impacts of evaporation and rainfall on droughts(Vicente-Serrano et al.,2010),while the SPI can only consider the infuence of rainfall on droughts.According to the historical record of the 1972 drought provided by Zhang et al.(2009), the six-month SPEI best depicts the drought evolution in terms of the drought severity.
The 1989 drought from March to October is shown in Fig.3(c).According to Zhang et al.(2009),the 1989 drought threatened an area of more than 30 970 km2.The monthly rainfall decreased by 30%-70%compared with the averagemonthly values,and higher air temperature lasted for several months.In May 1989,the air temperature signifcantly increased and was apparently higher than normal,exacerbating the drought.As shown in Fig.3(c),the fuctuation of the sc-PDSI is much greater than the fuctuations of the SPEI and SPI.According to the results of different drought indices, the drought starts in March,is aggravated in May,eases in June,gradually intensifes in July,and extends to October. The six-month SPEI and six-month SPI detect both the beginning and end of the drought.The SPEI performs better than the sc-PDSI and SPI in May due to the fact that the drought severity detected by the SPEI best coincides with the real situation.The drought detected by the sc-PDSI and sixmonth SPI is more severe than that detected by the SPEI and three-month SPI in the later stage of the drought.For example,in August,severe drought is shown by the sc-PDSI and six-month SPI,but moderate drought is shown by the SPEI and three-month SPI.The inherent disadvantages of the sc-PDSI discussed above result in a delay in drought evolution.Since the six-month SPI in August is computed based on the total rainfall from March to August,an amount of rainfall signifcantly less than normal aggravates the drought in August,and its cumulative effects leads to a delay in drought evolution.
4.3.Spatial distribution of typical drought events
According to the analysis described above,the 1972 drought was one of the most severe drought events from 1960 to 1989.Thus,the 1972 drought was selected for investigation of the spatio-temporal evolution of droughts in the Luanhe River Basin.
Fig.4 shows the spatial evolution of the 1972 drought detected by the sc-PDSI.The drought severity shows an increasing trend in most areas of the basin,with a small area of the basin suffering mild drought in February of 1972,and with a small area in the northern part of the basin suffering moderate drought and the rest of the area experiencing mild drought in August of 1972.The fact that the drought shown by the sc-PDSI is apparently milder than what was recorded by Zhang et al.(2009)demonstrates that the sc-PDSI cannot accurately depict the distribution of droughts.This can be attributed to the shortcomings of the sc-PDSI discussed above.
Fig.5 shows the spatial evolutions of the 1972 drought detected by the three-month SPEI and six-month SPEI.The spatial evolutions of the drought shown by the SPEI at different time scales are similar.The results of the three-month SPEI show the following:mild drought occurs in February,the drought is aggravated in March and April,severe drought occurs from May to June,the situation eases to moderate drought in July,and the drought is further alleviated after July with mild drought across the basin.The spatial distributions of the drought severity shown by the three-month SPEI and sixmonth SPEI reveal that extreme drought may occur in the southeast of the basin,and severe drought may occur in different parts of the basin.The drought severity of the basin shown by the SPEI varies with time scales.The drought severity shown by the three-month SPEI is generally milder than that shown by the six-month SPEI.For example,Chengde in the southwest of the basin experiences moderate drought according to the three-month SPEI but severe drought according to the six-month SPEI in April.According to the drought recorded by Zhang et al.(2009),Chengde suffered a severe drought from April to June.Thus,the six-month SPEI better refects the actual situation.
Fig.6 illustrates the spatial evolutions of the 1972 drought detected by the three-month SPI and six-month SPI,which are similar to those shown by the SPEI.However,the drought shown by the SPI is milder than that shown by the SPEI.
According to the records,the SPEI performs better than the sc-PDSI and SPI in detecting the spatial evolution of the 1972 drought,particularly in June.The reasons are as follows: higher evaporation caused by higher air temperature and less rainfall were two major factors controlling the evolution of the 1972 drought,and were both considered in the calculation of the SPEI.
5.Conclusions
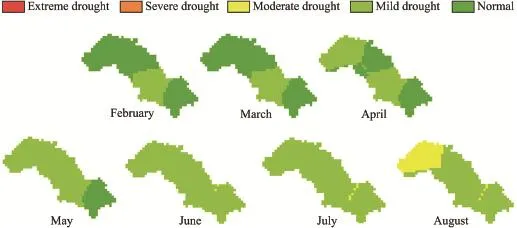
Fig.4.Spatial evolution of 1972 drought detected by sc-PDSI.

Fig.5.Spatial evolutions of 1972 drought detected by SPEI.

Fig.6.Spatial evolutions of 1972 drought detected by SPI.
The spatio-temporal evolution of droughts in the Luanhe River Basin from 1960 to 1989 was investigated using the sc-PDSI,SPEI,and SPI.The results reveal the following:the performances of different drought indices are closely associated with the drought duration and the dominant factors of droughts;the SPEI is more accurate than the SPI in drought assessment when there are some other factors,apart from precipitation,causing droughts;the drought severity shown by the sc-PDSI is generally milder than the actual drought severity from 1960 to 1989;and the evolution of the droughts is usually delayed by the sc-PDSI.Using the Thornthwaite algorithm,which responds only to changes in air temperature, to simplify the evaporation might be the limitation of the SPEI in drought assessment,and more attention should be paid to further improvement of the SPEI.
These three different drought indices provide different references for building drought early warning and mitigation systems in the basin.According to Hao et al.(2014),an effective drought early warning and mitigation system should be based on a variety of drought events,data,indicators,and models.Thus,methods of effectively integrating multiple drought-related variables deserve further study.
Abramowitz,M.,Stegun,I.A.,1965.Handbook of Mathematical Functions with Formulas,Graphs,and Mathematical Tables.Dover Publications, INC.,New York,pp.1046.
Alley,W.M.,1984.The Palmer drought severity index:Limitations and assumptions.J.Clim.Appl.Meteorol.23(7),1100-1109.http://dx.doi.org/ 10.1175/1520-0450(1984)023<1100:TPDSIL>2.0.CO;2.
Anderson,M.C.,Christopher,H.,Wardlow,B.,Pimstein,A.,Mecikalski,J.R., Kustas,W.P.,2011.Evaluation of drought indices based on thermal remote sensing of evapotranspiration over the continental United States.J.Clim. 24(8),2025-2044.http://dx.doi.org/10.1175/2010JCLI3812.1.
Anderson,M.C.,Allen,R.G.,Morse,A.,Kustas,W.P.,2012.Use of landsat thermal imagery in monitoring evapotranspiration and managing water resources.Remote Sens.Environ.122,50-65.http://dx.doi.org/10.1016/ j.rse.2011.08.025.
Brown,J.F.,Wardlow,B.D.,Tadesse,T.,Hayes,M.J.,Reed,B.C.,2008.The vegetation drought response index(VegDRI):A new integrated approach for monitoring drought stress in vegetation.GIScience Remote Sens.45(1), 16-46.http://dx.doi.org/10.2747/1548-1603.45.1.16.
Hao,Z.C.,AghaKouchak,A.,2013.Multivariate standardized drought index:a parametric multi-index model.Adv.Water Resour.57,12-18.http:// dx.doi.org/10.1016/j.advwatres.2013.03.009.
Hao,Z.C.,AghaKouchak,A.,2014.A nonparametric multivariate multi-index drought monitoring framework.J.Hydrometeorol.15(1),89-101.http:// dx.doi.org/10.1175/JHM-D-12-0160.1.
Hao,Z.C.,AghaKouchak,A.,Nakhjiri,N.,Farahmand,N.,2014.Global integrated drought monitoring and prediction system.Sci.Data 1,1-10. http://dx.doi.org/10.1038/sdata.2014.1.
Heim Jr.,R.R.,2002.A review of twentieth-century drought indices used in the United States.Bull.Amer.Meteor.Soc.83(8),1149-1165.
Keyantash,J.,Dracup,J.A.,2002.The quantifcation of drought:An evaluation of drought indices.Bull.Amer.Meteor.Soc.83(8),1167-1180.
Liang,E.,Liu,X.H.,Yuan,Y.J.,Qin,N.S.,Fang,X.Q.,Huang,L.,Zhu,H.F., Wang,L.L.,Shao,X.M.,2006.The 1920s drought recorded by tree rings and historical documents in the semi-arid and arid areas of northern China. Clim.Change 79(3-4),403-432.http://dx.doi.org/10.1007/s10584-006-9082-x.
Lu,G.H.,Yan,G.X.,Wu,Z.Y.,He,H.,2010.Analysis on aridifcation within last 50 years in China.Water Resour.Hydropower Eng.41(3),78-82. http://dx.doi.org/10.3969/j.issn.1000-0860.2010.03.020(in Chinese).
McKee,T.B.,Doesken,N.J.,Kleist,J.,1993.The relationship of drought frequency and duration to time scales.In:The 8th Conference on Applied Climatology.American Meteorological Society,Anaheim,pp.179-184.
Mu,Q.Z.,Zhao,M.S.,Kimball,J.S.,Mcdowell,N.G.,Running,S.W.,2013.A remotely sensed global terrestrial drought severity index.Bull.Amer. Meteor.Soc.94(1),83-98.http://dx.doi.org/10.1175/BAMS-D-11-00213.1.
Qian,W.H.,Shan,X.L.,Zhu,Y.F.,2011.Ranking regional drought events in China for 1960-2009.Adv.Atmos.Sci.28(2),310-321.http://dx.doi.org/ 10.1007/s00376-009-9239-4.
Singh,V.P.,Guo,H.,Yu,F.X.,1993.Parameter estimation for 3-parameterloglogistic distribution(LLD3)by Pome.Stoch.Hydrol.Hydraul.7(3), 163-177.
Thornthwaite,C.W.,1948.An approach toward a rational classifcation of climate.Geogr.Rev.38(1),55-94.
Vicente-Serrano,S.M.,Begueˊrıa,S.,Lˊopez-Moreno,J.I.,2010.A multiscalar drought index sensitive to global warming:The standardized precipitation evapotranspiration index.J.Clim.23(7),1696-1718.http://dx.doi.org/ 10.1175/2009JCLI2909.1.
Wang,L.,Wen,H.Y.,Yang,C.S.,Cheng,B.F.,Li,Q.F.,Shi,Z.G.,Li,P.C., 2012.Comparison of three drought indices in Beijing area.Water Resour. Power 30(3),5-7(in Chinese).
Wang,Z.W.,Zhai,P.M.,2003.Climate change in drought over northern China during 1950-2000.Acta Geogr.Sin.58(7),61-68.http://dx.doi.org/ 10.3321/j.issn:0375-5444.2003.z1.007(in Chinese).
Wells,N.,Goddard,S.,Hayes,M.J.,2004.A self-calibrating Palmer drought severity index.J.Clim.17(12),2335-2351.http://dx.doi.org/10.1175/ 1520-0442(2004)017<2335:ASPDSI>2.0.CO;2.
Wilhite,D.A.,2000.Drought as a Natural Hazard:Concepts and Defnitions. Routledge,London.
Wilhite,D.A.,Svoboda,M.D.,Hayes,M.J.,2007.Understanding the complex impacts of drought:A key to enhancing drought mitigation and preparedness.Water Resour.Manag.21(5),763-774.http://dx.doi.org/ 10.1007/s11269-006-9076-5.
Wu,Z.Y.,Lu,G.H.,Wen,L.,Lin,C.A.,2011.Reconstructing and analyzing China's ffty-nine year(1951-2009)drought history using hydrological model simulation.Hydrol.Earth Syst.Sci.15(9),2881-2894.http:// dx.doi.org/10.5194/hess-15-2881-2011.
Xin,X.,Yu,R.,Zhou,T.,Wang,B.,2006.Drought in late spring of South China in recent decades.J.Clim.19(13),3197-3206.http://dx.doi.org/ 10.1175/JCLI3794.1.
Yu,M.X.,Li,Q.F.,Hayes,M.J.,Svoboda,M.D.,Heim,R.R.,2014.Are droughts becoming more frequent or severe in China based on the standardized precipitation evapotranspiration index:1951-2010?Int.J.Climatol.34(3),545-558.http://dx.doi.org/10.1002/joc.3701.
Yu,S.B.,2007.Variations in Drought over China Based on the Modifed Selfcalibrating Palmer Drought Severity Index.The Chinese Academy of Meteorological Sciences,Beijing(in Chinese).
Zhang,A.Z.,Jia,G.S.,2013.Monitoring meteorological drought in semiarid regions using multi-sensor microwave remote sensing data.Remote Sens. Environ.134,12-23.http://dx.doi.org/10.1016/j.rse.2013.02.023.
Zhang,H.,Wang,W.Z.,Li,Q.F.,Yu,M.X.,Li,P.C.,Ren,J.L.,2013a. Investigation into drought evaluation of Tangshan region based on multiple drought indices.Water Resour.Prot.29(6),18-23(in Chinese).
Zhang,J.X.,Li,Q.F.,Yu,M.X.,Li,P.C.,Cai,T.,Wan,S.C.,Li,M.,2013b. Investigation into drought evaluation of Tianjin region based on multiple drought indices.Water Resour.Power 31(11),1-4(in Chinese).
Zhang,J.Y.,Su,Y.S.,Song,D.S.,Zhang,Y.Y.,Song,H.Z.,Gu,Y.,2009.The Historical Droughts in China during 1949-2000.Hohai University Press, Nanjing(in Chinese).
Zhang,L.H.,Zhang,Y.C.,Gao,Q.H.,2008.Water resource supply and demand conficts and water environment disaster in Beijing,Tianjin and Tangshan areas.J.Catastrophol.23(1),69-72(in Chinese).
Zou,X.K.,Zhai,P.M.,Zhang,Q.,2005.Variations in droughts over China: 1951-2003.Geophys.Res.Lett.32(4),L04707.http://dx.doi.org/10.1029/ 2004GL021853.
Received 22 May 2014;accepted 25 September 2014
Available online 1 December 2015
This work was supported by the National Natural Science Foundation of China(Grant No.41171220),the Program for Changjiang Scholars and Innovative Research Team in University of the Ministry of Education of China (Grant No.IRT13062),the Programme of Introducing Talents of Discipline to Universities(the 111 Project,Grant No.B08048),the Jiangsu Provincial Collaborative Innovation Center for World Water Valley and Water Ecological Civilization,and the National Cooperative Innovation Center for Water Safety and Hydro-Science.
*Corresponding author.
E-mail address:qfi@hhu.edu.cn(Qiong-fang Li).
Peer review under responsibility of Hohai University.
http://dx.doi.org/10.1016/j.wse.2015.11.004
1674-2370/©2015 Hohai University.Production and hosting by Elsevier B.V.This is an open access article under the CC BY-NC-ND license(http:// creativecommons.org/licenses/by-nc-nd/4.0/).
 Water Science and Engineering2015年4期
- Water Science and Engineering的其它文章
- Temporal and spatial distribution characteristics of water resources in Guangdong Province based on a cloud model
- Analysis and prediction of reference evapotranspiration with climate change in Xiangjiang River Basin,China
- Effects of temporal variability on HBV model calibration
- Impacts of water quality variation and rainfall runoff on Jinpen Reservoir, in Northwest China
- Analysis of effect of nicotine on microbial community structure in sediment using PCR-DGGE fngerprinting
- Numerical simulation of fow past twin near-wall circular cylinders in tandem arrangement at low Reynolds number