
Multiple responses optimization in the development of a headspace gas chromatography method for the determination of residual solvents in pharmaceuticals☆
2015-01-12 08:02:38CarlaTegliaMilagrosMontemurroMarDeZanMarmara
Carla M.Teglia,Milagros Montemurro,María M.De Zan,María S.Cámara
Laboratorio de Control de Calidad de Medicamentos,Facultad de Bioquímica y Ciencias Biológicas,Universidad Nacional del Litoral, C.C.242,S3000ZAA Santa Fe,Argentina
Multiple responses optimization in the development of a headspace gas chromatography method for the determination of residual solvents in pharmaceuticals☆
Carla M.Teglia,Milagros Montemurro,María M.De Zan*,María S.Cámara
Laboratorio de Control de Calidad de Medicamentos,Facultad de Bioquímica y Ciencias Biológicas,Universidad Nacional del Litoral, C.C.242,S3000ZAA Santa Fe,Argentina
A R T I C L E I N F O
Article history:
Received 21 October 2014
Received in revised form
26 February 2015
Accepted 26 February 2015
Available online 9 March 2015Keywords:
Headspace gas chromatography Residual solvents
Pharmaceuticals
Surface response methodology Desirability function
An effcient generic static headspace gas chromatography(HSGC)method was developed,optimized and validated for the routine determination of several residual solvents(RS)in drug substance,using a strategy with two sets of calibration.Dimethylsulfoxide(DMSO)was selected as the sample diluent and internal standards were used to minimize signal variations due to the preparative step.A gas chromatograph from Agilent Model 6890 equipped with fame ionization detector(FID)and a DB-624 (30 m×0.53 mm i.d.,3.00 μm flm thickness)column was used.The inlet split ratio was 5∶1.The infuencing factors in the chromatographic separation of the analytes were determined through a fractional factorial experimental design.Signifcant variables∶the initial temperature(IT),the fnal temperature (FT)of the oven and the carrier gas fow rate(F)were optimized using a central composite design. Response transformation and desirability function were applied to fnd out the optimal combination of the chromatographic variables to achieve an adequate resolution of the analytes and short analysis time. These conditions were 30°C for IT,158°C for FT and 1.90 mL/min for F.The method was proven to be accurate,linear in a wide range and very sensitive for the analyzed solvents through a comprehensive validation according to the ICH guidelines.
©2015 Xi'an Jiaotong University.Production and hosting by Elsevier B.V.All rights reserved.This is an open access article under the CC BY-NC-ND license(http∶//creativecommons.org/licenses/by-nc-nd/4.0/).
1.Introduction
Residual solvents(RS)are volatile organic chemicals(VOCs) that are used or produced during the manufacturing process of active pharmaceutical ingredients(APIs)or excipients and cannot be completely removed.RS analysis of pharmaceutical products is necessary not only because they represent a potential risk for human health,due to their toxicity and their undesirable side effects,but also because they may affect the physicochemical properties of pharmaceutical products.Therefore,it is a mandatory requirement for health authorities in the world to accurately determine the levels of RS that are present in APIs or excipients [1–3].
The International Conference on Harmonization(ICH)in their guideline Q3C(R5)[4]classifes the regularly used solvents into three different classes based on their toxicity∶Class 1(solvents that should be avoided due to their known carcinogenic effect on human),Class 2(solvents that should be limited in order to protect patients from potential adverse effects),and Class 3(solvents regarded as less toxic and of a lower risk for human health).According to ICH guidelines,the levels of Class 1 and 2 solvents should be restricted to the concentration limits established by the guideline.As regard to Class 3 solvents,amounts of up to 0.5%(w/ w)are considered acceptable.Moreover,the European Pharmacopoeia(Ph.Eur.)and the United States Pharmacopoeia(USP)establish the maximum allowable limits of the RS in the APIs and excipients,in accordance with the ICH guidelines.
The most appropriate analytical technique to determine RS and organic volatile impurities is the capillary gas chromatography (GC).The reasons why GC is highly recommended to this purpose are its excellent separation ability,low detection limits and the possibility of analyzing liquid or solid samples of variable and complex nature.Most of the detectors used in GC are developed specifcally for this technique.There are probably more than 60 detectors that have been used in GC,and most of them are based on the formation of ions by one means or another.Among them, the fame ionization detector(FID)becomes the most popular[5]. Mass spectrometers can also be used as detectors,properly coupled to the chromatograph.The combination of GC with mass spectroscopy has become a very popular and powerful tool[6].
Sampling techniques such as static headspace gas chromatography(SHGC)have gained ground against direct injection,mainly because of the many disadvantages associated with the direct injection of sample solution into the GC system[7].In the SHGC procedure,the liquid or solid sample is placed in a sealed vial and thermostated until a thermodynamic equilibrium between the sample and the gas phase is reached.A known aliquot of the gas phase is then injected into the gas chromatograph and analyzed. Therefore,any potential interference,from non-volatile substances,is removed or minimized.
It is worth noting that sample diluent has an important in f uence on SHGC,affecting sensitivity,equilibration temperature and time.In addition,the diluent should be able to dissolve a large variety of samples,present a high boiling point and an acceptable stability[8].There are several commonly used sample diluents for HSGC analyses,such as water,dimethylsulfoxide(DMSO),N,N-dimethylformamide(DMF),N,N-dimethylacetamide(DMA),benzyl alcohol(BA),1,3-dimethyl-2-imidazolidinone(DMI)and mixtures of water/DMF or water/DMSO[9].Water is a good diluent for water soluble samples,because it is clean,stable and inexpensive. However,many organic synthetic drug substances and drug products have low water solubility.When mixtures of water/DMF or water/DMSO are used as sample diluent,the solubility of many drug substances or drug products increases and the partition coef f cient of the analytes decreases,resulting in a better transfer of analytes from the liquid to the gas phase.However,if the sample solution is equilibrated at or above the boiling point of the diluent,the inner pressure of the vial is dangerously increased[8]. This means that if water or water mixtures are chosen,the head space(HS)equilibration temperature must be below 100°C, leading to poor volatilization of a large number of solvents with higher boiling points.In contrast,the use of pure solvents such as DMSO,DMF,DMA or DMI generally provides an adequate solubilization of most of drug substances,and gives the possibility to incubate at temperatures above 100°C.
The sample pre-treatment involved in the SHGC procedure is a critical step that may lead to experimental errors that can invalidate the results of the analysis.A strategy used to overcome errors in the preparative step is the addition of an internal standard(IS)[5].The IS may be used for two different purposes.On the one hand,it can be a substance or substances added to the sample solution prior to injection in order to minimize the variability due to the volume injected into the column.On the other hand,this substance or substances is added to the sample at the earliest possible point in an analytical scheme to compensate any loss during the extraction step[10].The IS must meet several criteria∶it should elute near the peaks of interest,but it must also be well resolved from them;it should be chemically similar to the analytes of interest,but it must not react with any sample component;and it must be available in high purity.
The IS is added to the sample in a concentration similar to that of the analyte(s)of interest.When several components are analyzed,it may not be possible to ful f ll this condition and a concentration of IS between higher and lower concentrations of the analytes to be analyzed must be chosen.Moreover,if many analytes are to be determined simultaneously,several internal standards may be used to meet the preceding criteria[10].The development of such a complex analytical method requires an appropriate optimization procedure.
When attempting to f nd the factors(k)that have a signi f cant in f uence on the system under study and then optimize such a system,experimental design is a powerful tool that is increasingly being used[11].The advantages of experimental design are well known by chemometricians in particular and,increasingly,by the scienti f c community in general.Especially,its use in separation science has increased in the last few years[12–17].
Response surface methodology(RSM)is a collection of statistical and mathematical techniques used to develop,improve and optimize processes.One of the strengths of RSM is that it may work well in cases where there is incomplete knowledge about the state and behavior of the system under study as long as the system is stable and there is reasonable correspondence between set points and actual conditions[18].There are several experimental designs suitable for this purpose,which vary in the number of experiments required and in the complexity of the mathematical models that can be built to describe the relationship between the factors and the responses under study[11].Using a factorial design in the screening phase followed by a central composite design (CCD)in the optimization stage is an effective tool in the optimization of a process with several parameters[19].
In addition,when different objective functions(responses) have to be optimized simultaneously,the so-called“Derringer's desirability function”is a useful strategy.This function is based on the idea that the quality of a product or process that has many features is completely unacceptable if one of them is outside a“desirable”limit.Its aim is to f nd operating conditions that ensure compliance with the criteria of all the involved responses and,at the same time,to provide the best value of compromise in the desirable joint response.This is achieved by converting the multiple responses into a single one,combining the individual responses into a composite function followed by its optimization [20,21].In the f rst step of this methodology,a partial desirability function(di)must be created for each individual response using the f tted models and establishing the optimization criteria.The most desirable ranges for each design factor or response are selected by the user,based on the prior knowledge of the system including the researcher's priorities during the optimization procedure.This involves deciding if these factors or responses have to be maximized,minimized,maintained in the range or reach a target value.In addition,a weight(wi)or emphasis is given to each goal.After that,the global desirability function(D)is obtained using the following equation∶

wherenis the number of variables included in the optimization procedure,andrnis the importance of each factor or response relative to the others.
Thenvariables,transformed in desirability functions,are combined in a unique function(D)to f nd out the best joint responses.The optimization procedure implies maximizingD.
Derringer's desirability function allows the analyst to f nd the experimental conditions(factor levels)to reach simultaneously the optimal value for all the evaluated variables.WhenDreaches a value other than zero,all the variables which are being simultaneously optimized can be considered having a desirable value. Meanwhile,if one of the responses is completely undesirable,Dwill be zero.
In this work,an SHGC method was developed,optimized and validated for the simultaneous determination of methanol,ethanol,ethyl ether,acetone,2-propanol,acetonitrile,methylene chloride,hexane,isopropyl ether,ethyl acetate,2-butanone, chloroform,tetrahydrofuran,cyclohexane,benzene,heptane,isooctane,triethylamine,1-butanol,trichloroethylene,1,4-dioxane, propyl acetate,pyridine,toluene,ethylene glycol,carbon tetrachloride,DMF,m-xylene,p-xylene,o-xylene and DMSO as RS in raw material.
2.Experimental
2.1.Apparatus and software
All experiments were performed using a gas chromatograph Model 6890(Agilent,Wilmington,DE,USA)equipped with FID. The Chemstation version B 0103 was used for data acquisition and processing.The GC column was a DB-624(30 m×0.53 mm i.d., 3.00 μm flm thickness)from Agilent.The inlet split ratio was 5∶1.
Experimental design,surface response modeling and desirability function calculations were performed using the Design-Expert 8.0.0(Stat-Ease Inc.,Minneapolis).
2.2.Chemicals and reagents
DMSO was purchased from TEDIA(Fairfeld,Ohio,USA).Methanol,ethanol,ethyl ether,acetone,methylene chloride,hexane, isopropyl ether,ethyl acetate,2-butanone,isooctane,chloroform, tetrahydrofuran,cyclohexane,triethylamine,1-butanol,trichloroethylene,1,4-dioxane,propyl acetate,pyridine,toluene, ethylene glycol,DMF,and total xylenes were supplied by Anedra (San Fernando,Argentina),and 2-propanol,acetonitrile,benzene, heptane and carbon tetrachloride by Cicarelli(San Lorenzo,Argentina).Metronidazole benzoate raw material and betamethasone-17 valerate raw material used as validation samples were supplied by Lafedar S.A.(Parana,Argentina).
2.3.Calibration curves and internal standard selection
To perform the calibration curves,the concentrations of each analyte were defned.In order to obtain the same parity,the solvents were separated,according to their concentration limits,into two groups∶solvents with high limits and solvents with low limits. Another aspect that was considered was the overlapped peaks of some analytes for which no separation was achieved in the optimization procedure(ethyl acetate-2-butanone,chloroformtetrahydrofuran,heptanes-isooctane-triethylamine,dioxane-propyl acetate and toluene-ethylene glycol).A particular case resided in the determination of three coeluting analytes∶isooctane–heptane–triethylamine.In this case,a bibliographic study of the occurrence of these solvents in raw materials allowed us to decide to work with heptane–triethylamine.
In addition,two internal standards were selected in each calibration group,one in low concentration and the other in high concentration.To defne the solvent used as IS,we considered the resolutions between the peaks and co-eluting analytes and the characteristics of the solvents.According to these issues,we decided to use benzene,trichloroethylene,acetone and hexane.Its reproducibility during the runs was an important parameter to consider in the choice of the IS.
2.4.Internal standard solutions
Two internal standard solutions were prepared by diluting appropriate volumes of pure solvents in DMSO.For internal standard solution 1(IS1),12 μL of benzene and 410 μL of trichloroethylene were transferred into a 10 mL volumetric fask.For internal standard solution 2(IS2),115 μL of hexane and 250 μL of acetone were transferred into a 10 mL volumetric fask.
2.5.Standard solutions
Two standard stock solutions(SSSs)were prepared by diluting appropriate volumes of pure solvents of each analyte in DMSO. Calibration standards were prepared at the moment of the analysis by diluting suitable volumes of the SSSs in DMSO.By proper dilutions,the frst SSS calibration solutions were obtained yielding concentrationsofanalytesintherangesdescribedin Table 1.Then,25 μL of IS1 was added into each calibration solution reaching concentrations of 2.0 μg/mL for benzene and 60 μg/mL for trichloroethylene.With the similar method,the second SSS calibration solutions were obtained yielding concentrations of analytes in the ranges described in Table 2.Then,25 μL of IS2 was added into each solution obtaining concentrations of 0.4 μg/mL for hexane and 20 μg/mL for acetone.After incubation of the solutions (5.0 mL in a 20 mL headspace vial)at 105°C for 45 min,2.5 mL of the vapor phase was injected into the GC system.
2.6.Sample preparation
500 mg of metronidazole benzoate or betamethasone-17 valerate raw material was transferred into a 25 mL volumetric fask and an amount of DMSO(15 mL)was added to dissolve the sample.In the case of betamethasone-17 valerate,the analytes to be identifed and quantifed were chloroform,trichlorethylene,dioxane,DMF and ethyl acetate,and the IS2(25 μL)was used.In the case of metronidazole benzoate,the analytes to be identifed and quantifed were methanol,acetone,methylene chloride,ethylene glycol and toluene,and the IS1was used.After incubation of the sample(5.0 mL in a 20 mL headspace vial)at 105°C for 45 min, 2.5 mL of the vapor phase was injected into the GC system.
2.7.Fortifed samples for recovery and precision studies
Portions of 500 mg of metronidazole benzoate raw material or betamethasone-17 valerate raw material were transferred into25 mL volumetric f asks and spiked with appropriate amounts of solvents yielding concentrations of analytes in the ranges described in Table 3 and Table 4.After that,DMSO(15 mL)was added to dissolve the sample and 25 μL of IS(IS1 or IS2)was added.After incubation of the sample(5.0 mL in a 20 mL headspace vial)at 105°C for 45 min,2.5 mL of the vapor phase was injected into the GC system.

Table 1Concentration ranges for analytes in the frst calibration set.
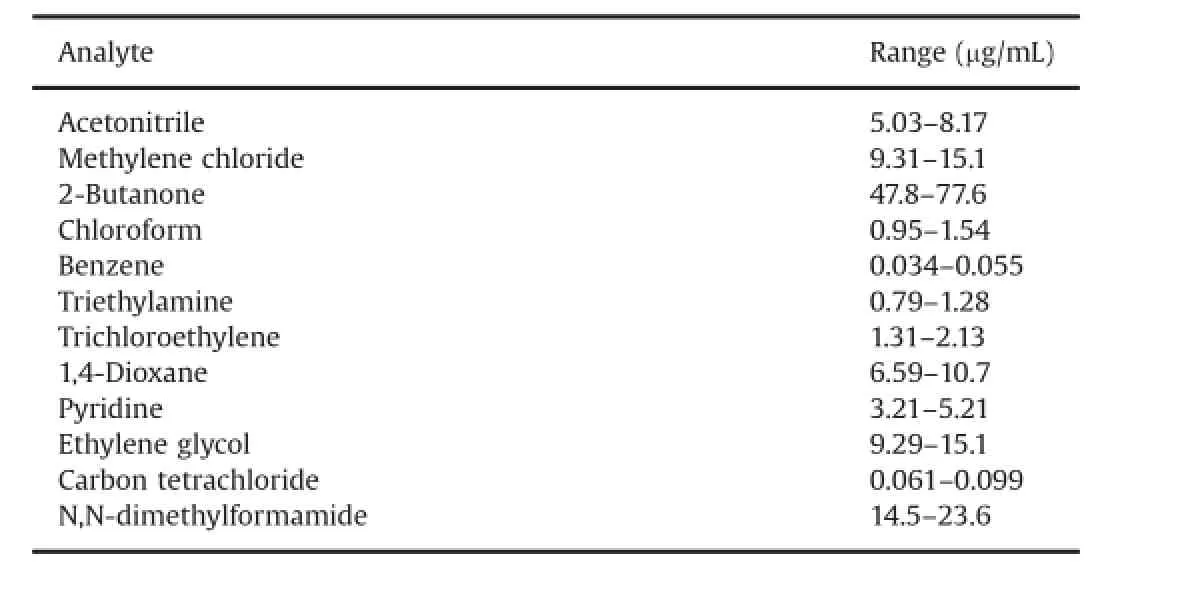
Table 2Concentration ranges of analytes in the second calibration set.
2.8.Experimental design and optimization
The goal of using experimental design was to f nd the optimal analytical conditions for the chromatographic separation of 31 solvents with satisfactory performance and in a reasonable analysis time.
In the f rst instance,runs were performed using the USP 34 method for residual solvents.The column was a DB-624 (30 m×0.53 mm i.d.,3.00 μm f lm thickness)from Agilent.The inlet split ratio was 5∶1,and the carrier gas was nitrogen at a velocity of 5.0 mL/min.The column temperature was maintained at 40°C for 20 min,then raised at a rate of 10°C per min to 240°C and maintained at 240°C for 20 min.Fig.1 shows a typical chromatogram obtained from these conditions.
These previous experiments showed low or none resolution between several of the analyzed solvents and in some cases large peaks widths.Thus,we built an experimental design to determine the factors that were in f uencing the separation and peaks performance.A factorial design with six factors was used∶(a)initial temperature of the GC oven in the range of 40–60°C;(b)f nal temperature of the GC oven in the range of 100–150°C;(c)time period of initial temperature in the range of 1–3 min;(d)timeperiod of fnal temperature in the range of 1–3 min;(e)variation of the ramp in the range of 5–10°C/min;and(f)carrier gas fow in the range of 2.5–10 mL/min.
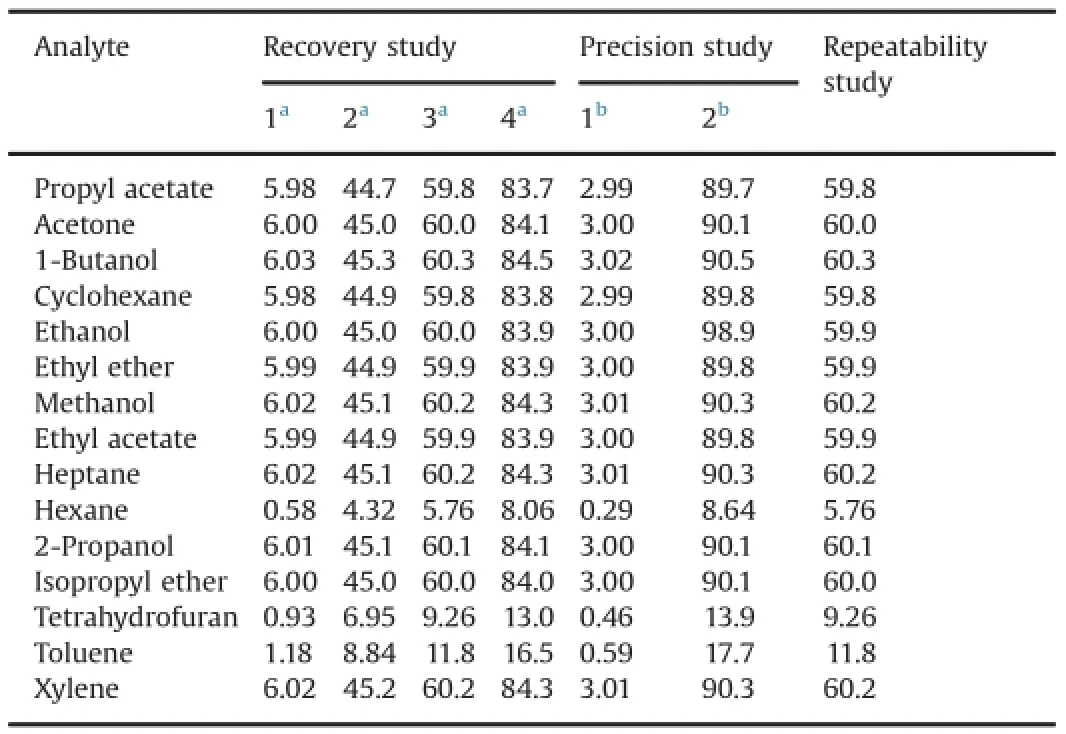
Table 3Concentration levels(μg/mL)for analytes of the f rst calibration set used for precision and recovery studies.

Fig.1.Chromatogram obtained following the conditions described in USP 34∶(A)full chromatogram and(B)expansion of the critical zone.
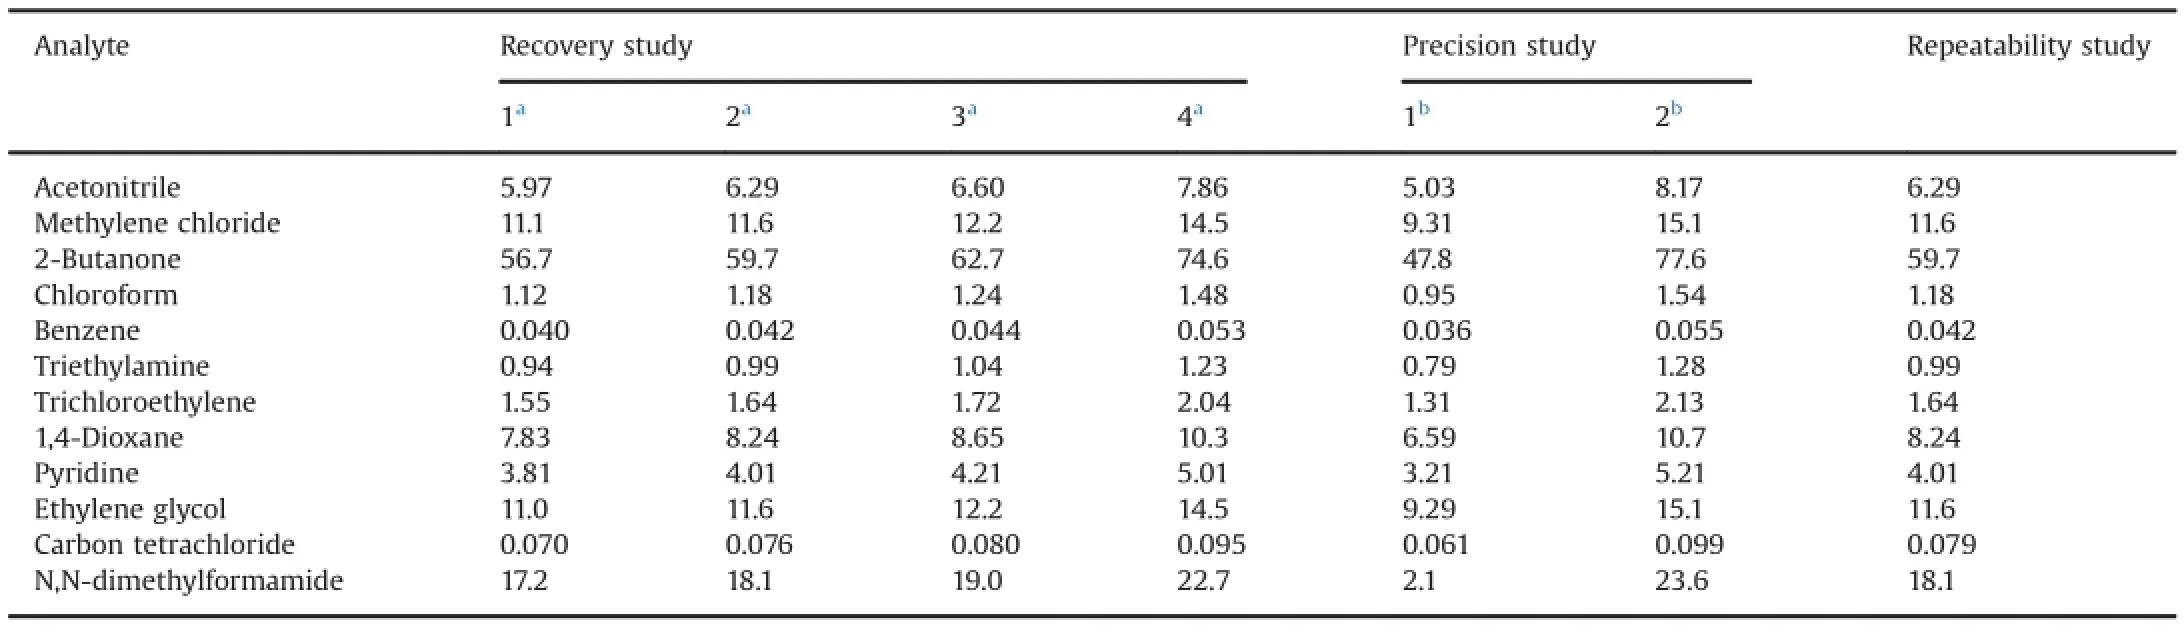
Table 4Concentration levels(μg/mL)for analytes of the second calibration set used for precision and recovery studies.
Several responses were selected for optimization purposes∶(R1)resolution between peaks of ethanol and ethyl ether,(R2) resolution between peaks of acetone and2-propanol,(R3)resolution between peaks of 2–propanol and acetonitrile,(R4)resolution between peaks of acetonitrile and methylene chloride, and(R5)resolution between peaks of pyridine and toluene.These resolutions were selected based on the fact that in none of the runs these analytes had resolutions higher than 1.5.
Table 5 shows the fractional factorial design(6–1)built with 32 runs and blocked in 4 days.The analysis of the effects of the variables over the responses was concluded that the factors with no signifcant infuence on the chromatography resolution of analyte were ramp rate(RR),time at fnal temperature(T FT)and time at initial temperature(T IT).While factors infuencing the resolution of the peaks were initial temperature(IT),fnal temperature(FT)and fow(F).
With this information,we proceeded to build a central composite design to fnd out the optimal values of the factors under study.Levels for each factor corresponding to–1 and+1 coded value were∶30.0 and 40.0°C for IT,150 and 160°C for FT and 1.0 and 2.0 mL/min for F.The other chromatographic factors were kept constant at the following values∶1.50 min for T IT,1.50 min for T FT and 5°C/min for RR.The α-value used in the design was compatible with rotatable distribution of prediction variance. Experiments were divided into two blocks,with 10 runs on day one and 14 runs on day two,which are shown in Table 6 in their actual values.
The experiments were performed in a randomized order toensure the independence of the results,minimizing the effects of uncontrolled factors.Then,the responses were evaluated and the models were built.

Table 5Experiments of the factorial design.

Table 6Experiments and responses of the central composite design.

Table 7Models ftting.

Table 8Criteria followed for the optimization of individual factors and responses.

Fig.2.Individual desirability obtained for each variable.
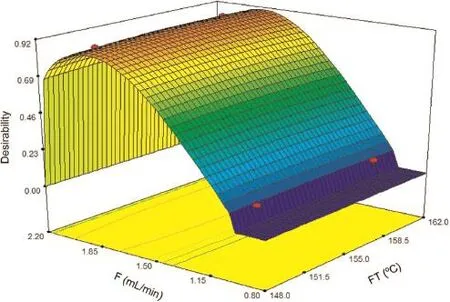
Fig.3.Desirability depending on f ow(F)and f nal temperature(FT).
2.9.Method validation
In order to study the linearity,calibration standards were prepared in triplicate in DMSO.The central point of the calibrations was chosen as the upper limit allowed by USP for each solvent in raw material.In all cases,we used two sets of IS to maintain constant their concentrations during the construction of the curve.The headspace vapor of these solutions was introduced into the instrument in a randomized way and calibration plots were built by plotting concentration vs.relative areas(RA).
Limit of detection(LOD)and limit of quanti f cation(LOQ)were calculated by the linear regression analysis and by using the signal/noise ratio criterion as described in the results.
To evaluate the trueness of the method,recovery experiments were made with the forti f ed sample solutions described in Section 2.7.
The instrumental repeatability was assessed by repetitive measurements(n=6)of standard solutions at the central point of the calibration,whereas the intermediate precision was evaluated by performing measurements(n=5)of forti f ed samples at two different concentrations(lower and upper levels of the curve) prepared by spiking metronidazole benzoate with a volume of an adequately standard solution through two days.Then,the relative standard deviation was calculated in all the cases.
The method was f nally applied to the determination of RS in raw material.
3.Results and discussion
3.1.Optimization of the chromatographic separation
3.1.1.Models
In each model,the terms were evaluated by analysis of variance (ANOVA)and a backward regression procedure was applied to eliminate the insigni f cant factors(α=0.10).This probability value, α is used to limit the selection so that the terms withp-values larger than 0.10 were excluded from the model.In this way,simpli f ed models,including only signi f cant terms and those necessary to maintain hierarchy,were obtained.ANOVA is a collection of statistical models used to analyze the differences between group means.It estimated three sample variances∶a total variance based on all the observation deviations from the grand mean,an error variance based on all the observation deviations from their appropriate treatment means and a treatment variance.Treatment considered in this case is the level of the factor.To determine thestatistical signi f cance of the term,theF-test was used to compare the variance between treatments with the variance within treatment.Resulting models are shown in Table 7.
3.1.2.Transformation of the responses
Generally,transformation of the responses is used for three different purposes∶to stabilize the response variance,to do the distribution of the response variable closer to the normal distribution,and to improve the f t of the model to the experimental data.The last objective includes model simpli f cation by eliminating interaction terms.Sometimes a transformation will be reasonably effective in simultaneously accomplishing more than one of these objectives.
Transformations apply a mathematical function to all the response data needed in order to meet the assumptions that make the ANOVA valid∶residuals must be normally distributed,independent and with a constant variance.
There was a broad range of possible response transformations, and the Box Cox graphical strategy was used in this work[22]. Table 7 shows the transformation of the responses made after analyzing experimental results.
3.1.3.Optimal conditions achieved through desirability function
Table 8 shows the criteria chosen for the optimization of each response.Due to the fact that they were the most critical parameters,an importance of 5 was assigned to R2 and R5 when constructing the global desirability.The importance of the other variables was kept in an intermediate value.
The global desirability function produced a maximum value (D=0.912)for IT of 30°C,FT of 158°C,and F of 1.90 mL/min in the separative method.
Fig.2 shows the partial desirability reached by each variable in the system under the optimized conditions.Fig.3 shows the global desirability three-dimensionally represented as a function of two of the in f uential variables in the system,depending on the f ow rate and the f nal temperature.
In setting the values that were assigned to the factors,the following con f dence interval values(95%CI)for the f ve responses were predicted by the f tted models∶R1=2.19–2.31,R2=1.40–1.43,R3=2.14–2.22,R4=2.96–3.05 and R6=2.00–2.02.The suggested optimal conditions were then experimentally corroborated, obtaining chromatographic signals like the one presented in Fig.4.
3.2.Sample diluent selection
First,we used mixtures of water–DMSO and water–DMF according to USP guide and then we used pure solvent(DMF and DMSO).In the case of solvent–water mixtures,the equilibrium temperature was maintained at 80°C.In these experiments,a remarkable decrease in the sensitivity of the analytes was observed.For this reason,the incubation time was increased above 60 min in order to achieve satisfactory recoveries for the analytes at concentrations of 1 μg/mL or less.
In addition,we considered the stability and solubility of the raw materials to be analyzed.In this sense,DMF showed low stability at high temperature and susceptibility to degradation when exposed to ultrasonic during sample preparation.As the degradation products may interfere with the determination,we discarded the use of this solvent.Since DMSO is more stable at high temperature and has a higher capacity of dissolving drug substances and drugs products,it was chosen as the HS diluent.
3.3.Method validation andfgures of merit
3.3.1.Specifcity
In order to identify each analyte and their retention times in our GC system with FID,we ran the pure solvents individually.As it was previously described(Section 2.3)that several solvents have the same retention time,we took the initiative to separate them into two groups.The problem arose when a raw material had as residual solvents a couple that overlap.In these cases,we either changed the column using the same method or we developed a new method for separating the analytes in question.
3.3.2.Linearity and range
According to Taverniers et al.[22],linearity is de f ned as the ability of the method to obtain test results proportional to the concentration of analyte(within a given range)and linear range, and,working range or linearity limits is de f ned as the range of concentrations(or amounts)of analyte over which the method gives test results proportional to the concentration of analyte,or alinear calibration model can be applied with a known con f dence level.
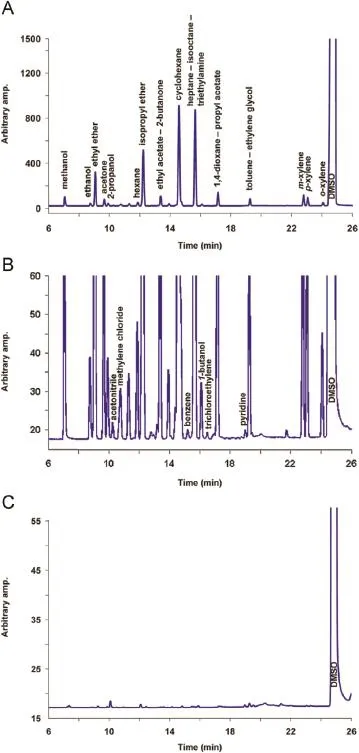
Fig.4.Chromatogram corresponding to a standard solution∶(A)full chromatogram;(B)expansion of the critical zone and(C)DMSO blank.
Calibration curves were obtained with six standards covering the selected range and each point in triplicate.Relative areas (analyte area/internal standard area)of each RS were calculated to get the curve,plotting concentration vs.relative area(RA).All of RS showed a good linear relationship(r2>0.99).The range and the calibration parameters are listed in Table 9.However,for assessment of the linearity of an analytical method,linear regression calculations are not enough.Therefore,the goodness of f t was tested by comparing the variance of the lack of f t against the pure error variance[23,24].The adequacy of the model was estimated by anF-test which uses the pure error variance(SSPE/νPE)and the variance of the lack of f t(SSLOF/νLOF)∶

Table 9Linearity range results and f gures of merit(in all case theFtab=5.112).

Table 10LOD and LOQ values computed according to different criteria.

where SSPEis the sum of squares corresponding to pure error,SSLOFis the sum of squares corresponding to the lack of f t,νLOF=νR–νPE, and νPEand νRare the degrees of freedom for estimating the sum of squares of pure error and residuals,respectively[25].
The calibration model is considered suitable ifFexpis less than the one–tailed tabulated valueFtab(νR–νPE,νPE,p)at apcon f dence level.In our case,the calibration model can be considered adequate as theFexp,in all cases,lower thanFtab(Table 9).
3.3.3.LOD and LOQ
The LOD is the lowest concentration of analyte that can be detected and reliably distinguished from zero(or the noise level of the system),but not necessarily quantitated[22].This parameter was calculated using standard solutions prepared in solvent,applying different criteria.
First,the LOD was computed from the linear regression analysis using the standard deviation of the regression(sy)using the expression LOD=3.3sy/b[26].
Additionally,the LOD was calculated as the concentration of analyte giving a signal three times of the noise level(S/N=3), using standard solutions prepared in solvent.The signal to noise ratio was calculated using the Chemstation software version B.
The LOD values obtained by these criteria are displayed inTable 10.
According to different international regulatory bodies,the LOQ is the lowest concentration of analyte that can be determined quantitatively with an acceptable level of precision[22].First,the LOQ was computed from the linear regression analysis using the standard deviation of the regression(sy)as was done for the LOD but using a factor equal to 10.Additionally,it was calculated as the concentration of analyte giving a signal ten times of the noise level (S/N=10)using standard solutions prepared in solvent.
The LOQ values obtained by these criteria are displayed in Table 10.
3.3.4.Trueness
To assess the trueness of the method,recovery tests were made by adding different concentrations of the solvents of interest to a known mass of raw materials under study.The recoveries were examined by spiking raw materials of metronidazole benzoate and betamethasone-17 valerate with known amounts of standard solutions at the beginning of the sample preparation procedure(see Section 2.6).After analysis,the concentrations of the solvents were obtained from the regression parameters of the calibration curves and the recoveries were calculated.Four levels were evaluated (three replicates),and the results are displayed in Table 11 and Table 12.It can be observed that excellent recoveries were achieved(between 85.7%and 113.1%).
3.3.5.Precision
Two parameters were studied∶repeatability or intra-assay variations and intermediate precision or inter-assay variations using fortifed metronidazole benzoate raw material.
The relative standard deviation(RSD)of the obtained results was evaluated and anF-test(α=0.05)for comparison between series was performed showing acceptable precision parameters for the method.These results are displayed in Table 13.

Table 11Results of recoveries(%)for solvents of the frst calibration set.
Table 12Results of recoveries(%)for solvents of the second calibration set.
3.4.Applications
The developed method was applied to residual solvents determination in several commercial samples of metronidazole benzoate and betamethasone-17 valerate raw material.In all cases, we analyzed not only the solvents stated by manufacturer to be used during the manufacturing process,but also the solvents that were calibrated.In the great majority,the analyzed samples met specifcations containing solvents below allowable limits.However,there were cases in which the analyzed substances did not meet specifcations.An example of each case is shown in Table 14 and Table 15.
As it can be seen,through the developed method,it was possible to determine the solvents required by the manufacturer and to identify and quantify other solvents that were not requested by the manufacturer,and exceeded the permitted limits,such as benzene in betamethasone-17 valerate and chloroform,dioxaneand pyridine in metronidazole benzoate[4].Several solvents are used in traditional betamethasone synthesis procedures,such as methanol,chloroform,tetrahydrofuran,dioxane and pyridine. Later,valerate is made from betamethasone and methyl ortovalerate as starting materials,using benzene as solvent[27].Regarding metronidazole,dioxane is commonly used as a dehydrogenating agent in order to produce the precursors nitroimidazole drugs,in an effcient and economical manner[28].Chloroform and ethyl acetate are used as extractant and recristalization solvents in the synthesis of metronidazole starting from nitroimidazole[27].Finally,in the combination of benzoyl chloride and metronidazole to obtain the benzoate form of metronidazole,pyridine is usually employed as a deacid reagent to promote the reaction[29].These solvents are typically removed by evaporation under vacuum,but it is clear that their removal from the raw material is sometimes inadequate.In Fig.5A and B the chromatograms obtained from the analysis of these raw materials are shown.

Table 13Results of precision study.
Table 14Concentration of analytes found in betamethasone-17 valerate raw material.

Table 15Concentration of analytes found in metronidazole benzoate raw material.
4.Conclusions
A systematic analytical approach for identifcation and quantifcation of VOCs∶methanol,ethanol,ethyl ether,acetone,2-propanol,acetonitrile,methylene chloride,hexane,isopropyl ether, ethyl acetate,2-butanone,chloroform,tetrahydrofuran,cyclohexane,benzene,heptane,isooctane,triethylamine,1-butanol,trichloroethylene,1,4-dioxane,propyl acetate,pyridine,toluene, ethylene glycol,carbon tetrachloride,DMF,m-xylene,p-xylene, o-xylene and DMSO in raw material is described in this article.A simple general method utilizing static headspace capillary gas chromatography coupled with FID was developed and provided an effective means for rapid screening of VOCs.The use of chemometric tools such as the experimental design and the multiple response optimizations showed to be of great help to achieve a fast and effcient optimization of the chromatographic conditions.
A systematic study of VOCs in raw materials from various sources is beyond the scope of this work.However,it is expected that the presence and amount of VOCs in commercial materials will vary frommanufacturer to manufacturer and a comprehensive study using the presented methodology should be guaranteed.

Fig.5.Chromatograms corresponding to samples∶(A)betamethasone-17 valerate raw material(IS∶acetone and hexane)and(B)metronidazole benzoate raw material(IS∶benzene and trichloroethylene).
Acknowledgments
The authors are grateful to Universidad Nacional del Litoral (Projects CAI+D 2011 No.PI-50120110100025 LI)and to ANPCyT (Agencia Nacional de Promoción Científ ca y Tecnológica,Project PICT 2011–0005)for f nancial support.
[1]J.Somuramasami,Y.C.Wei,E.F.Soliman,et al.,Static headspace gas chromatographic method for the determination of low and high boiling residual solvents in betamethasone valerate,J.Pharm.Biomed.Anal.54(2011) 242–247.
[2]Y.Sitaramaraju,A.Riadi,W.D’Autry,et al.,Evaluation of the European pharmacopoeia method for control of residual solvents in some antibiotics,J. Pharm.Biomed.Anal.48(2008)113–119.
[3]K.Fliszar,J.M.Wiggins,C.M.Pignoli,et al.,Analysis of organic volatile impurities in pharmaceutical excipients by static headspace capillary gas chromatography,J.Chromatogr.A 1027(2004)83–91.
[4]Proceedings of International Conference on Harmonisation of Technical Requirements for Registration of Pharmaceuticals for Human Use(ICH),Tripartite Harmonised Guideline Q3C(R5),Impurities∶Guideline for Residual Solvents,2011.
[5]H.M.Mcnair,J.M.Miller,Basic Gas Chromatography,Willey,Hoboken,New Jersey,USA,2009,pp.115–118.
[6]J.L.Pérez Pavón,M.N.Sánchez,M.E.Fernández Laespada,et al.,Analysis of class 1 residual solvents in pharmaceuticals using headspace-programmed temperature vaporization-fast gas chromatography–mass spectrometry,J. Chromatogr.A 1141(2007)123–130.
[7]C.B’Hymer,Residual solvent testing∶a review of gas–chromatographic and alternative techniques,Pharm.Res.20(2003)337–344.
[8]C.Cheng,S.Liu,B.J.Mueller,et al.,A generic static headspace gas chromatography method for determination of residual solvents in drug substance,J. Chromatogr.A 1217(2010)6413–6421.
[9]K.Urakami,A.Higashi,K.Umemoto,et al.,Matrix media selection for the determination of residual solvents in pharmaceuticals by static headspace gas chromatography,J.Chromatogr.A 1057(2004)203–210.
[10]C.F.Poole,The Essence of Chromatography,Elsevier,Amsterdam,The Netherlands,2003,pp.70–72.
[11]L.Vera Candioti,M.M.De Zan,M.S.Cámara,et al.,Experimental design and multiple response optimization.Using the desirability function in analytical methods development,Talanta 124(2014)123–138.
[12]S.C.Wang,H.J.Liao,W.C.Lee,et al.,Using orthogonal array to obtain gradient liquid chromatography conditions of enhanced peak intensity to determine geniposide and genipin with electrospray tandem mass spectrometry,J. Chromatogr.A 1212(2008)68–75.
[13]Y.Zhou,J.Z.Song,F.F.K.Choi,et al.,An experimental design approach using response surface techniques to obtain optimal liquid chromatography and mass spectrometry conditions to determine the alkaloids in Meconopsi species,J.Chromatogr.A 1216(2009)7013–7023.
[14]A.Andrade-Eiroa,P.Diévart,P.Dagaut,Improved optimization of polycyclic aromatic hydrocarbons(PAHs)mixtures resolution in reversed-phase highperformance liquid chromatography by using factorial design and response surface methodology,Talanta 81(2010)265–274.
[15]P.Iuliani,G.Carlucci,A.Marrone,Investigation of the HPLC response of NSAIDs by fractional experimental design and multivariate regression analysis.Response optimization and new retention parameters,J.Pharm.Biomed.Anal.51 (2010)46–55.
[16]M.Fourdinier,S.Bostyn,R.Delépée,et al.,Interest of a chemometric approach in understanding the retention behaviour of three columns in hydrophilic interaction liquid chromatography∶application to the separation of glycerol carbonate,glycerol and urea,Talanta 81(2010)1281–1287.
[17]M.D.Gil García,F.Cañada Cañada,M.J.Culzoni,et al.,Chemometric tools improving the determination of anti-in f ammatory and antiepileptic drugs in river and wastewater by solid-phase microextraction and liquid chromatography diode array detection,J.Chromatogr.A 1216(2009) 5489–5496.
[18]R.H.Myers,D.Montgomery,C.M.Anderson Cook,Response Surface Methodology∶Process and Product Optimization using Designed Experiments, Willey,New Jersey,USA,2009,pp.9–13,58–63.
[19]N.Moreira,S.Meireles,T.Brandão,et al.,Optimization of the HS–SPME–GC IT/ MS method using a central composite design for volatile carbonyl compounds determination in beers,Talanta 117(2013)523–531.
[20]M.Almeida Bezerra,R.Erthal Santelli,E.Padua Oliveira,et al.,Response surface methodology(RSM)as a tool for optimization in analytical chemistry, Talanta 76(2008)965.
[21]L.Vera Candioti,J.C.Robles,V.E.Mantovani,et al.,Multiple response optimization applied to the development of a capillary electrophoretic method for pharmaceutical analysis,Talanta 69(2006)140–147.
[22]I.Taverniers,M.De Loose,E.Van Bockstaele,Trends in quality in the analytical laboratory.II.Analytical method validation and quality assurance,Trends Anal. Chem.23(2004)535–552.
[23]M.Mcloun,J.Militky,M.Forina,Chemometrics for Analytical Chemistry,Ellis Horwood,Chichester,West Sussex,United Kingdom,1994,pp.64–69.
[24]A.G.González,M.A.Herrador,A practical guide to analytical method validation,including measurement uncertainty and accuracy pro f les,Trends Anal. Chem.26(2007)227–238.
[25]D.L.Massart,B.G.M.Vandeginste,L.M.C.Buydens,et al.,Handbook of Chemometrics and Qualimetrics∶Part A,Elsevier,Amsterdam,The Netherlands, 1997,pp.417–422.
[26]L.A.Currie,Nomenclature in evaluation of analytical methods including detection and quanti f cation capabilities∶IUPAC Recommendations 1995,Anal. Chim.Acta 391(1999)105–126.
[27]M.Sitting,Pharmaceutical Manufacturing Encyclopedia,Noyes Publications, Westwood,New Jersey,USA,1988,pp.164–169,1011.
[28]M.R.Grimmett,Imidazole and Benzimidazole Synthesis(Best Synthetic Methods),Academic Press,San Diego,California,USA,1997,p.169.
[29]Z.Wang,L.Wang,P.Huang,Improved convenient synthesis of benzoyl metronidazole∶a nitroimidazole antibiotics,J.Chem.2013(2013)1–2(Article ID 937454).
☆Peer review under responsibility of Xi'an Jiaotong University.
*Corresponding author.Tel./fax∶+54 342 4575205.
E-mail address:mmdezan@fbcb.unl.edu.ar(M.M.De Zan).
http∶//dx.doi.org/10.1016/j.jpha.2015.02.004
2095-1779/©2015 Xi'an Jiaotong University.Production and hosting by Elsevier B.V.All rights reserved.This is an open access article under the CC BY-NC-ND license (http∶//creativecommons.org/licenses/by-nc-nd/4.0/).
 Journal of Pharmaceutical Analysis2015年5期
- Journal of Pharmaceutical Analysis的其它文章
- Application of analytical instruments in pharmaceutical analysis
- JPA Prize in 2014
- High-sensitivity simultaneous liquid chromatography–tandem mass spectrometry assay of ethinyl estradiol and levonorgestrel in human plasma☆
- Rapid screening and distribution of bioactive compounds in different parts ofBerberis petiolarisusing direct analysis in real time mass spectrometry☆
- Determination of atractylon in rat plasma by a GC–MS method and its application to a pharmacokinetic study☆
- Application of RP–HPLC method in dissolution testing and statistical evaluation by NASSAM for simultaneous estimation of tertiary combined dosages forms☆