改进的QuEChER S方法用于鱼肉中孔雀石绿、隐色孔雀石绿、结晶紫和隐色结晶紫的快速检测
朱程云,魏 杰,董雪芳,郭志谋,刘名扬*,梁鑫淼*
(1.大连交通大学环境与化学工程学院,辽宁 大连 116028;2.中国科学院大连化学物理研究所分离分析化学重点实验室,辽宁 大连 116023)
Malachite green(MG)and crystal violet(CV),which are triphenylmethane dyes,have been widely used in aquaculture as antimicrobial,antiparasitic and antiseptic agents in the past decades[1,2].The major metabolites of MG and CV,leucomalachite green(LMG)and leucocrystal violet(LCV)possess similar biological characteristics[3].Owing to their potential carcinogenicity,the addition of MG and CV in aquaculture is nowadays absolutely forbidden[1,4].However,illegal utilization of dyes still exists because they are cheap and efficient[5].Thus,multi-residues determination of dyes in aquatic products is of great significance.
Considering the complexity of the matrix in aquatic products,sample pretreatment for decreasing or eliminating matrix interference and improving the detection sensitivity is of great concern.Numerous sample pretreatment methods have been established in previous reports[6-11].Traditional liquid-liquid extraction method can be easily realized although it consumes large volume of solvents[6].Enzyme-linked immune sorbent assay(ELISA)[12-14]exhibits good selectivity,but it suffers from false positive results.Solid phase extraction(SPE)is a time-consuming method although the matrix interference can be efficiently removed [15,16].Molecularly imprinted solid phase extraction(MISPE)for sample preparation reveals good specificity.However,the preparation of MISPE materials is difficult[17,18].
QuEChERS,representing the abbreviation of“quick,easy,cheap,effective,rugged and safe”,has been acknowledged as a rapid and efficient pretreatment method for the determination of hydrophobic pesticides[19-23]as well as veterinary drug residues[24,25].The QuEChERS procedure involves two steps:(i)extraction/partitioning based on the use of NaCl and MgSO4for salting out,and(ii)dispersive solid phase extraction(d-SPE)for clean-up.
In consideration of the hydrophobicity of MG,LMG,CV and LCV,the introduction of QuEChERS for sample preparation is advantageous via extracting dye into the organic layer and cleaning-up by d-SPE procedure.By optimizing the extraction volume,extraction time and d-SPE materials,a specific pretreatment method was developed which greatly simplified the sample preparation and increased the throughput.With the combination of the proposed QuEChERS procedure and HPLC method based on XCharge C18 column,thesimultaneous determination ofMG,LMG,CV and LCV in fish tissues was successfully realized.
1 Experimental
1.1 Chemicals and materials
Malachite green(MG),crystal violet(CV)and leucocrystal violet(LCV)were purchased from Sigma-Aldrich(St.Louis,MO,USA);leucomalachite green(LMG)was obtained from Dr Ehrenstorfer GmbH(Augsburg,Germany).Acetonitrile(ACN)of HPLC grade was purchased from Merck(Darmstadt,Germany).Ammonium formate(NH4FA)and formic acid(FA)were purchased from J&K Scientific(Beijing,China).Water for HPLC mobile phase was purified with a Milli-Q system(Millipore,Billerica,MA,USA).All other reagents were of analytical grade and used without further purification.Reversedphase/strong anion-exchange mixed-mode material(C18SAX)(40-75 μm,particle size)described in our previous report[26]was selected as d-SPE adsorption material.C18,primary secondary amine(PSA)materials and XCharge C18 column(3.0 mm×100 mm i.d.,5 μm particles)were from Acchrom Corp.(Beijing,China).
1.2 HPLC conditions
A Hitachi Chromaster HPLC system(Tokyo,Japan)consisting of 5110 quaternary pump,5210 auto sampler,5310 column oven and 5430 diode array detector(DAD)was employed for HPLC analysis.The separation was performed on an XCharge C18 column.The column temperature was set at 40℃and flow rate was1 mL/min.The injection volume was20 μL.The mobile phase composed of ACN(A),water(B)and 100 mmol/L ammonium formate(pH 3.0,C).The elution condition was 0-3 min,40%A-65%A;3-8 min,65%A-75%A,while mobile phase C was kept constant at 20%to obtain a buffer concentration of 20 mmol/L.Each dye was determined at the maximum absorption wavelength:620 nm for MG,590 nm for CV,263 nm for LCV and LMG.
1.3 Sample preparation
Cod fish was from local supermarket(Dalian,China).The skin and bone were removed.Then the fish was cut into strips and homogenized.The homogenized sample was stored at-20℃in the refrigerator until sample pretreatment.
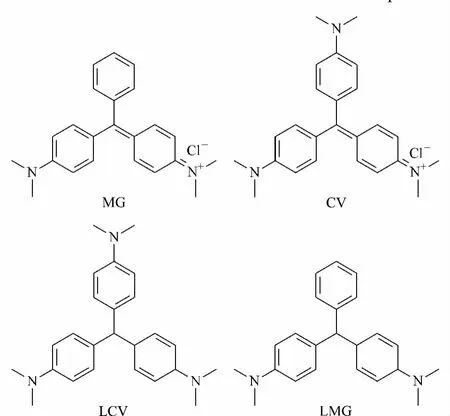
Fig.1 Structures of malachite green(MG),crystal violet(CV),leucomalachite green(LMG)and leucocrystal violet(LCV)
The homogenized cod sample(2 g)was weighed into a 15 mL polypropylene tube.Then,2 mL of ammonium formate(100 mmol/L,pH 3.0)and 3 mL of ACN were added.The sample was shook vigorously to extract the analytes from the matrix.Then 2 g of sodium chloride was added into the solution for partitioning.The sample was mixed for about 2 min and centrifuged at 6000 r/min for 5 min.After that,1 mL of supernatant and 50 mg of C18SAX material were transferred into a 2.5 mL polypropylene tube.The polypropylene tube was shook and kept in ultrasonic bath for 1 min.The mixture was filtered through 0.22 μm membrane.The resulting filtrate was mixed with ammonium formate(100 mmol/L,pH 3.0)in the ratio of 4∶1(sample solution∶ammonium formate,v/v).The prepared solution was injected into the HPLC system for analysis.
1.4 Standard and reagent solutions
The mixed stock solution with mass concentration of 100 mg/L was dissolved by ACN.It was stored at 4℃and protected against light for less than two weeks.The working solution was prepared through diluting the stock solution with the initial mobile phase(ACN∶water∶100 mmol/L ammonium formate=40∶40∶20,v/v/v).The concentrations of working solution were diluted at 0.5,1,5,10,25,50 μg/mL.
2 R esults and discussion
2.1 Establishment of chromatographic methods
The resolution of MG,CV,LCV and LMG dyes(structures shown in Fig.1)which are basic compounds with good selectivity and peak shape is difficult on traditional C18 columns,especially for LCV and LMG [6,27].According to the previous studies of our group[28,29],XCharge C18 column displayed great superiority in the separation of basic compounds.Therefore,XCharge C18 column was selected for the development of the analytical method and the mobile phase conditions was optimized.As shown in Fig.2a,the compounds could not be well resolved with 0.1%(v/v)FA/H2O in the mobile phase and LMG was not eluted within 10 min.Since the utilization of buffer solution is advantageous for improving peak shape and selectivity,100 mmol/L ammonium formate with pH 5.1 was employed as the mobile phase additive.The peak shapes were improved,but LCV and LMG were not well separated(Fig.2b).When the pH value of ammonium formate was changed to 3.0,the resolution of the four dyes was successfully achieved in 8 min with good peak shapes(Fig.2c).
2.2 Establishment of pretreatment method
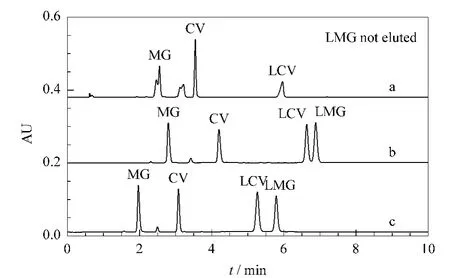
Fig.2 Dyes separated on XCharge C18 column with different mobile phases
The QuEChERS procedure is flexible as it provides a template for sample preparation.The solvent and sorbent can be optimized according to the property of the target analytes.Mostly,the organic solvent used for extraction and partitioning is acetonitrile,which can easily generate phase separation with the addition of sodium chloride.In this work,the volume of extraction solvent and the kind of adsorption sorbent were systematically optimized to obtain best recovery and sensitivity.
2.2.1 Optimization of extraction and partitioning
The volume of extraction solvent in QuEChERS procedure directly affects the sensitivity and recovery.The insufficient solvent would cause incomplete extraction,resulting in poor recovery,while excessive extraction solvent severely dilutes the analytes,leading to low detection sensitivity.
To balance the recovery and sensitivity,the volume of acetonitrile for extraction was optimized from 2 mL to 7 mL.As shown in Fig.3,the peak areas of four dyes increased from 2 mL to 3 mL,and then slightly decreased from 3 mL to 7 mL.The results indicated that 3 mL of acetonitrile was optimal for the extraction of dyes in 2 g of homogenized fish tissue.More acetonitrile could not improve the extraction efficiency but reduce the detection sensitivity due to the dilution of analytes.Thus the volume of extraction solvent was determined to be 3 mL.Then the extraction time was verified.The homogenized fish tissue(2 g)was first extracted by 2 mL of acetonitrile,and then 1 mL of acetonitrile for re-extraction.The supernatants were merged and detected.The results showed no obvious differences(results not shown).So the fish tissue was extracted once with 3 mL of acetonitrile.
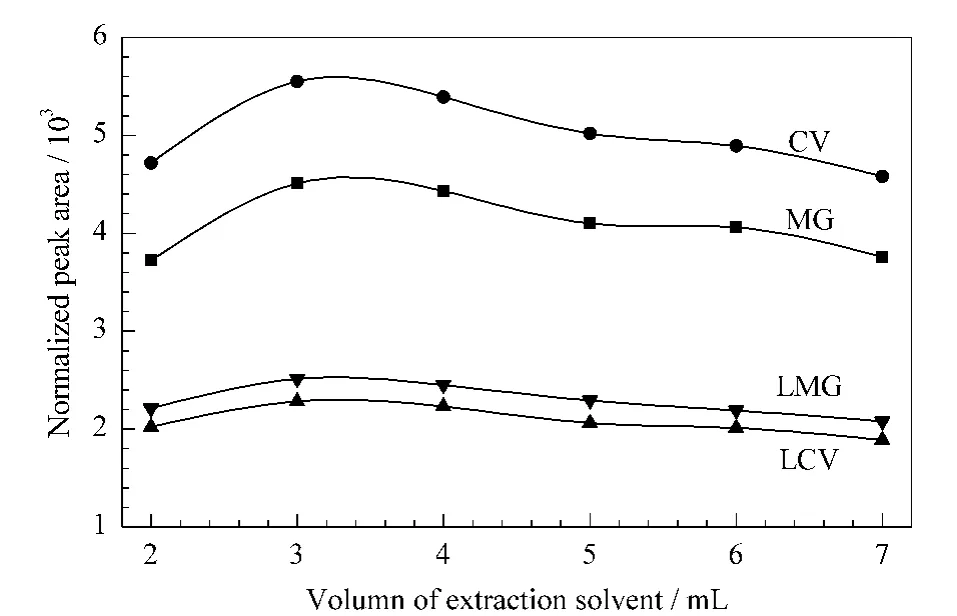
Fig.3 Influence of extraction volume on the peak areas of dyes
In QuEChERS procedure,partitioning was achieved by the use of sodium chloride and magnesium sulfate.In this case,the recovery of the dyes was obviously deteriorated when magnesium sulfate was used.Therefore only sodium chloride was used for partitioning.In order to drive water from acetonitrile layer,excess sodium chloride(2 g)was added.Hardly any dyes were detected in aqueous layer.And the acetonitrile layer was transferred into a polypropylene tube for d-SPE clean-up before HPLC analysis.
2.2.2 Selectivity of adsorption sorbent
After the extraction/partitioning,dyes and some nonpolar interferences were partitioned into the acetonitrile layer.In order to remove the interferences and clean-up the sample,d-SPE with a proper adsorptive material was performed.C18 and PSA(structures shown in Fig.4)are commonly used materials for adsorption [30,31].C18 mainly adsorbs fat,lipid and some other non-polar interferences,while PSA adsorbs fatty acids and organic acids,etc.In this experiment,C18 and PSA were first employed as adsorbents.As shown in Table 1,the recoveries of dyes were about 70%-90%with C18 as d-SPE material.If PSA was used together with C18,the recoveries reduced to about 40%-80%.The color of the sorbents after d-SPE was shown in Fig.5.In Fig.5a(C18 material)and Fig.5b(C18 and PSA materi-als),the sorbents were obviously changed to blue or violet,further demonstrating the adsorption of MG and CV.As the four dyes were all hydrophobic and basic compounds,the electrostatic attraction between dyes and silanol groups on C18 material together with the original hydrophobic interaction led to low recoveries.When PSA was added,the alkaline PSA enhanced the ionization of silanols both on C18 and PSA,resulting in poor recoveries.
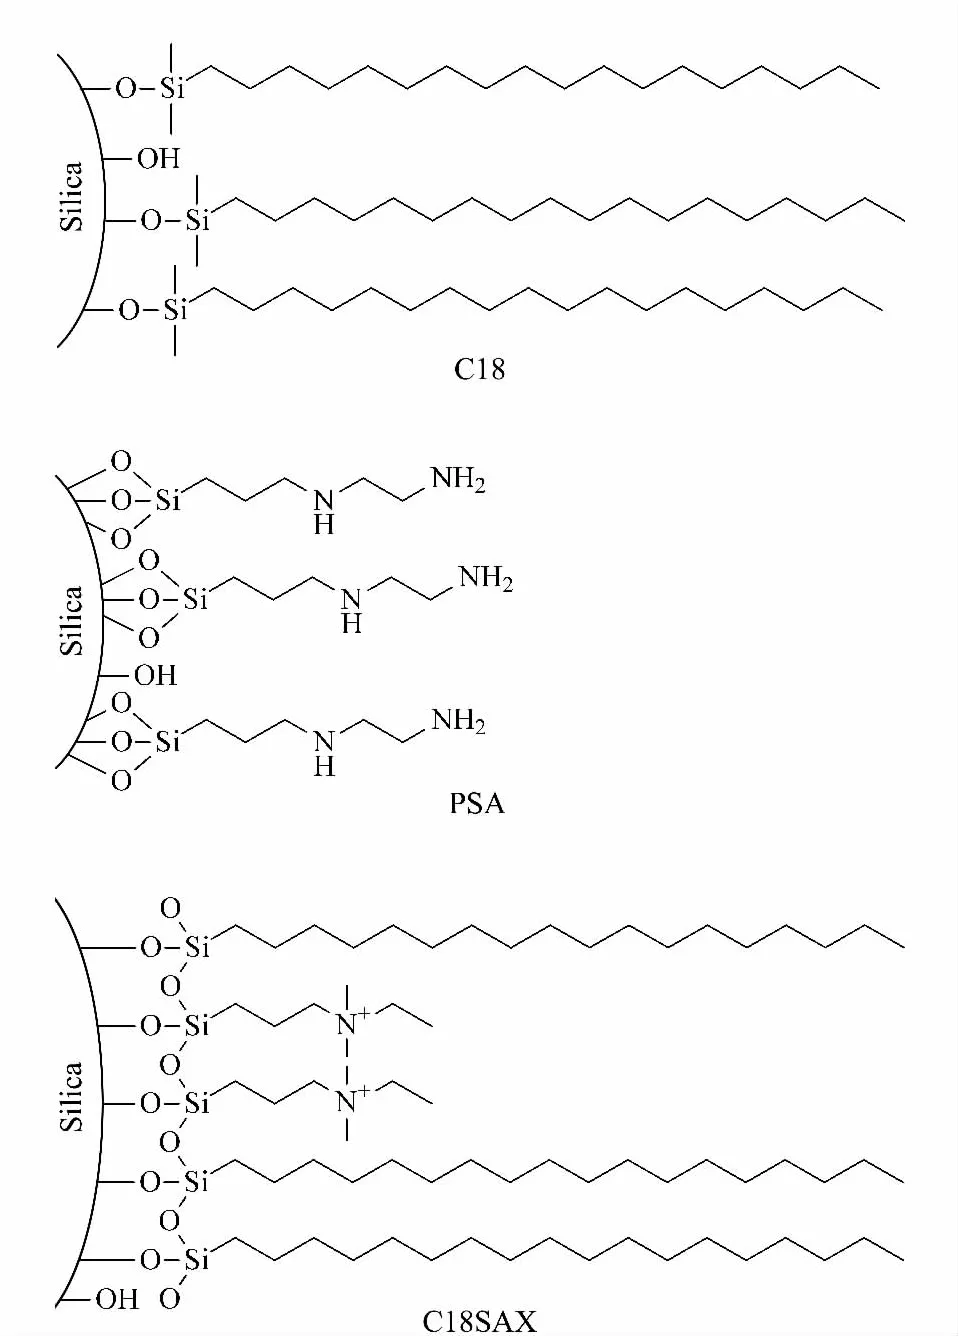
Fig.4 Structures of C18,PSA and C18SAX materials
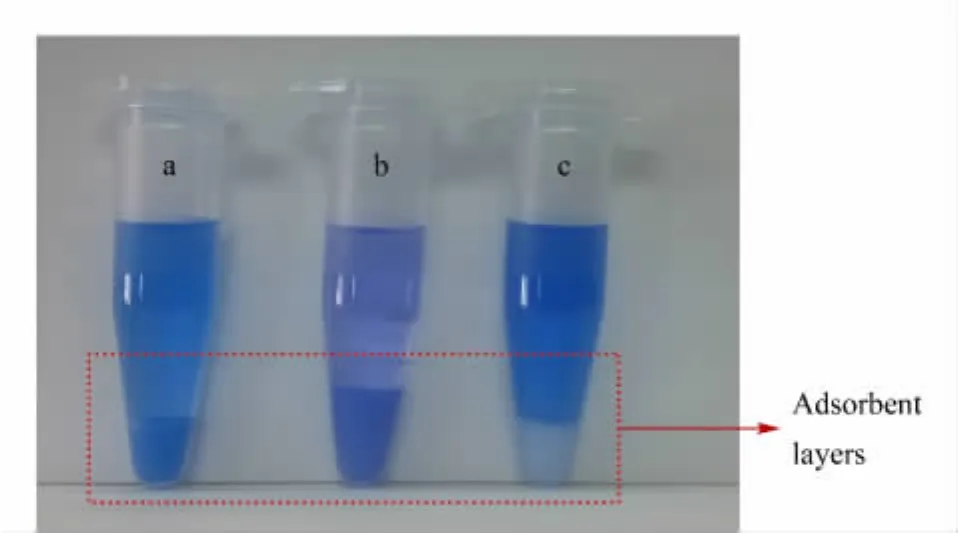
Fig.5 Color of adsorbents in lower layers after d-SPE procedure

Table 1 R ecoveries of the four dyes after d-SPE with different adsorbents
In a previous work[26],we developed a reversedphase/strong anion-exchange mixed-mode stationary phase(named C18SAX,Fig.4)based on polar-copolymerized approach.The C18SAX material possesses C18 and quaternary ammonium groups,which can provide hydrophobic and electrostatic interaction simultaneously.With C18SAX as d-SPE material,the nonpolar and acidic interferences in the acetonitrile layer were adsorbed by the sorbent.Meanwhile,the quaternary ammonium group provided electrostatic repulsion interaction against the basic dyes.As shown in Table 1 and Fig.5c,the recoveries were in the range of 83.51%-102.19% for the four dyes,and the C18SAX material was still white after the adsorption.Consequently,C18SAX mixed-mode material is superior to the mechanically mixed C18 and PSA materials in cleaning-up the sample and avoiding adsorption of dyes.
Based on the above discussions,this method was easily streamlined in the determination of dye residues in aquatic products.As shown in Fig.6,Part I concerns the extraction/partitioning,while PartⅡ involves the clean-up of the sample with d-SPE material,and PartⅢis for HPLC analysis.
2.3 Method validation
The performance of the optimized approach for the determination of MG,CV,LCV and LMG dyes was validated with respect to the linearity,recovery,intraday and inter-day precisions as well as limit of detection(LOD)and limit of quantitation(LOQ).
The calibration was performed with the use of matrix-matched standards.As shown in Table 2,the four dyes expressed good linearities in the range of 0.5-100 mg/L,with correlation coefficients all above 0.998.In the spiked range from 5 to 25 mg/L,the recoveries were between 88.63%and 110.62%,with intra-day and inter-day precisions of 0.7%-3.5%and 1.6%-5.4%,respectively.The LODs(calculated by signal to noise ratio of 3)were 3.2 μg/kg for MG,
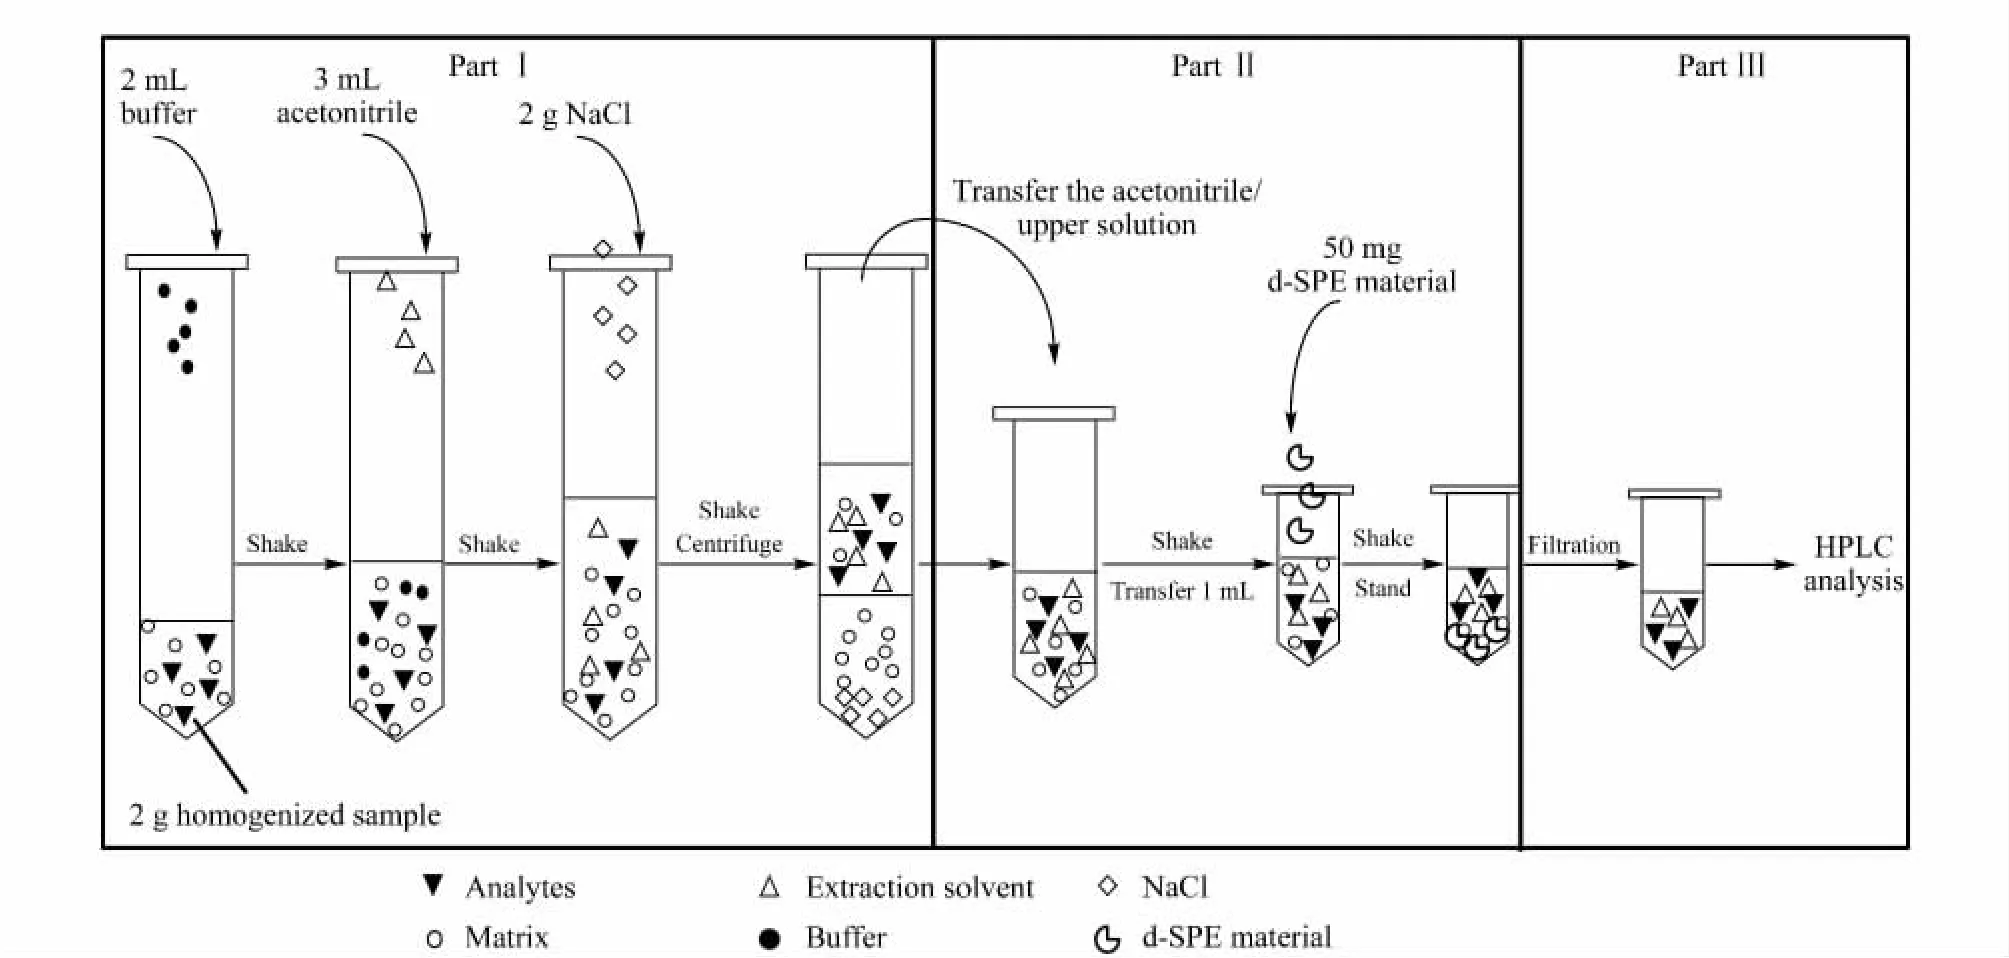
Fig.6 Flowchart of dye determination:extraction/partitioning(part I),clean-up by dispersive solid phase extraction material(part II)and HPLC analysis(part III)
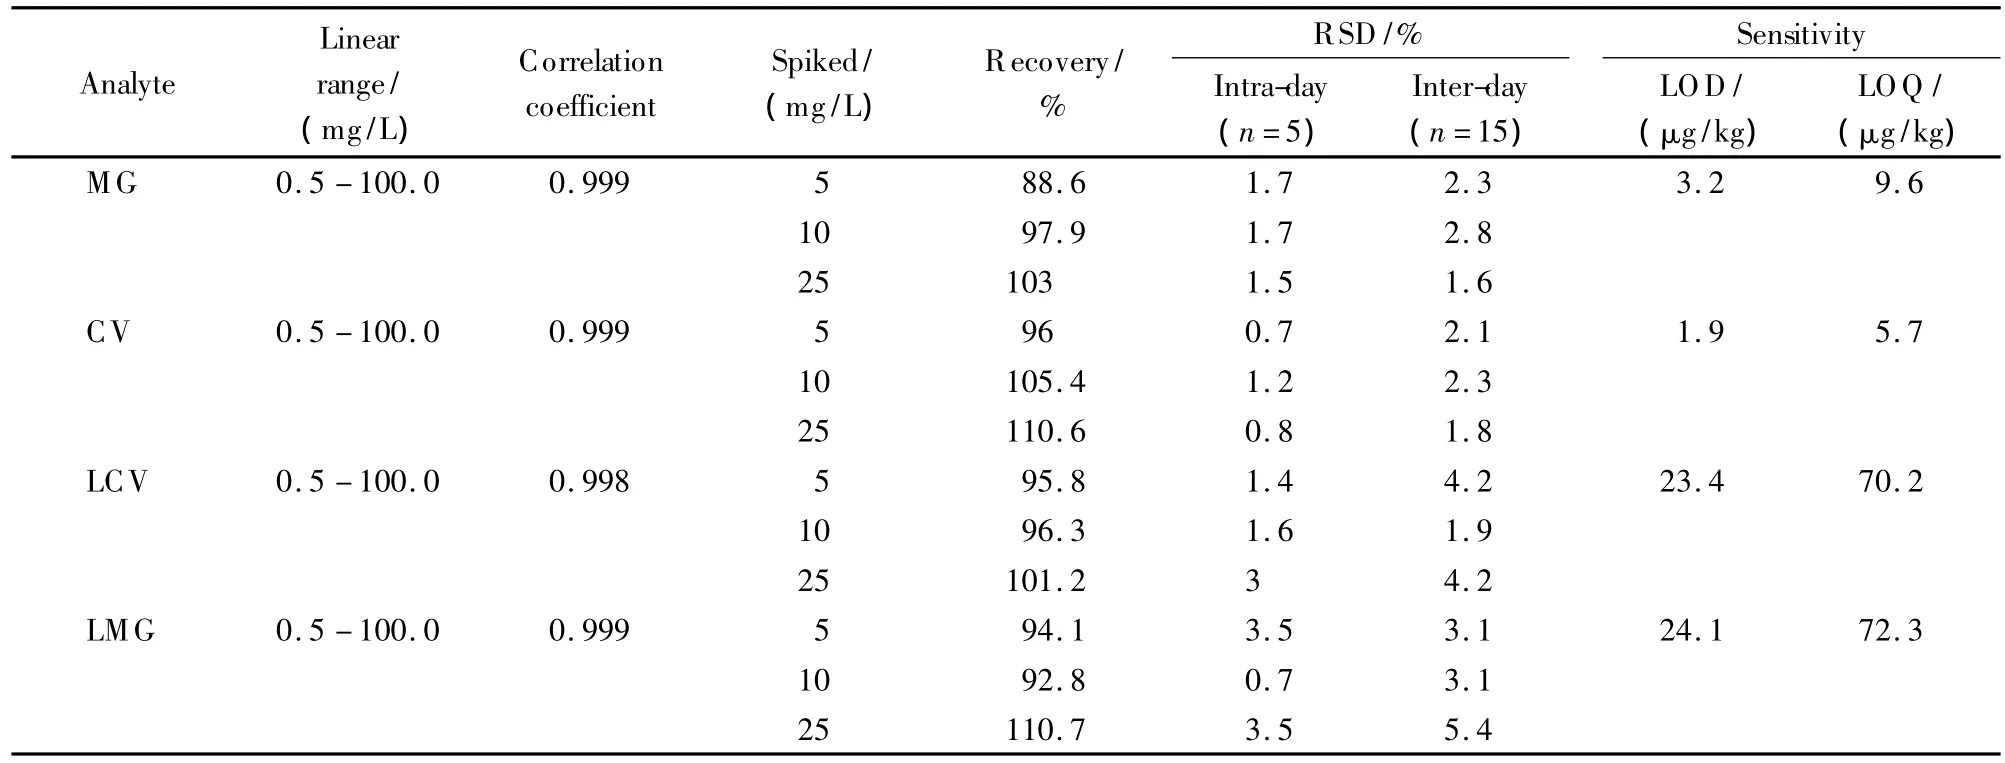
Table 2 Matrix matched calibrations and validation data for fish tissue
2.4 Sample analysis
The optimized method was applied to detect MG,CV,LCV and LMG in fish samples which were bought from local supermarket.The results of two batches of cod samples were negative.
3 Conclusions
The present study demonstrated the simplicity and high-efficiency of QuEChERS pretreatment method combined with HPLC for the fast analysis of triphenylmethane dyes in fish tissue.XCharge C18 was applied in the separation of MG,LMG,CV and LCV with good selectivity and peak shape.The extraction/partitioning and d-SPE procedure in QuEChERS were systematically investigated.A C18SAX mixed-mode adsorbent was employed in the d-SPE procedure,exhibiting better recovery than conventional adsorbents.Method validation data showed satisfactory recoveries and precisions.On the other hand,the limitation of the present method also exists.The detection sensitivity cannot meet the demand of the minimum required performance limit(MRPL)for the dyes.In future work,MS detector will be applied for the improvement of the sensitivity.
[1]Arroyo D,Ortiz M C,Sarabia L A,et al.J Chromatogr A,2009,1216(29):5472
[2]Zhang Z,Zhou K,Bu Y Q,et al.Anal Methods,2012,4(2):429
[3]Ascari J,Dracz S,Santos F A,et al.Food Addit Contam,2012,29(4):602
[4]Andersen W C,Turnipseed S B,Karbiwnyk C M,et al.Anal Chim Acta,2009,637(1/2):279
[5]Lee J B,Kim H Y,Jang Y M,et al.Food Addit Contam,2010,27(7):953
[6]Chen G Y,Miao S.J Agric Food Chem,2010,58(12):7109
[7]Tarbin J A,Chan D,Stubbings G,et al.Anal Chim Acta,2008,625(2):188
[8]An L,Deng J,Zhou L,et al.J Hazard Mater,2010,175(1):883
[9]Tsai C H,Lin J D,Lin C H.Talanta,2007,72(2):368
[10]Hurtaud-Pessel D,Couedor P,Verdon E.J Chromatogr A,2011,1218(12):1632
[11]Fux E,Rode D,Bire R,et al.Food Addit Contam,2008,25(8):1024
[12]Shen Y D,Deng X F,Xu Z L,et al.Anal Chim Acta,2011,707(1/2):148
[13]Xing W W,He L,Yang H,et al.J Sci Food Agric,2009,89(13):2165
[14]Durnez L,Bortel W V,Denis L,et al.Malar J,2011,10:195
[15]Deng J C,Li L H,Yang X Q,et al.Food Science,2012,33(14):150
[16]Stubbings G,Tarbin J,Cooper A,et al.Anal Chim Acta,2005,547(2):262
[17]Lian Z R,Wang J T.Mar Pollut Bull,2012,64(12):2656
[18]Li Y H,Yang T,Qi X L,et al.Anal Chim Acta,2008,624(2):317
[19]Chen W,Ren Y D,Liu H,et al.Journal of Henan Agricultural Sciences,2011,40(2):111
[20]Paya P,Anastassiades M,Mack D,et al.Anal Bioanal Chem,2007,389(6):1697
[21]Zhang Z Y,Gong Y,Shan W L,et al.Chinese Journal of Chromatography,2012,30(1):91
[22]Huang Y C,Ding W W,Zhang Z M,et al.Chinese Journal of Chromatography,2013,31(7):613
[23]Chen X S,Bian Z Y,Yang F,et al.Chinese Journal of Chromatography,2013,31(11):1116
[24]Aguilera-Luiz M M,Vidal J L M,Romero-Gonzalez R,et al.J Chromatogr A,2008,1205(1/2):10
[25]Stubbings G,Bigwood T.Anal Chim Acta,2009,637(1/2):68
[26]Wei J,Guo Z M,Zhang P J,et al.J Chromatogr A,2012,1246:129
[27]Stella C,Rudaz S,Veuthey J L,et al.Chromatographia,2001,53:S-113
[28]Wang C R,Guo Z M,Long Z,et al.J Chromatogr A,2013,1281:60
[29]Zhang J C,Wei J,Zhong H M,et al.Chinese Journal of Chromatography,2013,31(1):79
[30]Lehotay S J,Son K A,Kwon H,et al.J Chromatogr A,2010,1217(16):2548
[31]Walorczyk S.J Chromatogr A,2008,1208(1/2):202

