
New Hexagonal-rhombic Trilayer Ice Structure Conf i ned between Hydrophobic Plates
2014-07-19 11:17:08MinJiaWenhuiZhaoLanfengYuan
Min Jia,Wen-hui Zhao,Lan-feng Yuan
Hefei National Laboratory for Physical Sciences at the Microscale,University of Science and Technology of China,Hefei 230026,China
New Hexagonal-rhombic Trilayer Ice Structure Conf i ned between Hydrophobic Plates
Min Jia,Wen-hui Zhao,Lan-feng Yuan∗
Hefei National Laboratory for Physical Sciences at the Microscale,University of Science and Technology of China,Hefei 230026,China
We perform molecular dynamics simulations for water conf i ned between two smooth hydrophobic walls and observe two crystalline structures with one being f i rst reported.Both of these structures obey the ice rule.The novel ice phase is a f l at hexagonal-rhombic trilayer ice,obtained under 1 GPa load at wall separation of 1.0 nm.In this structure,the water molecules in the two layers next to one of the walls(outer layers)and in the middle layer form hexagonal rings and rhombic rings,respectively.For a molecule in the outer layers,three of its four hydrogen bonds are in the same layer,and the other one hydrogen bond connects to the middle layer.For a molecule in the middle layer,only two of its four hydrogen-bonds are located in the same layer,and the other two connect to two different outer layers.Despite their different motifs,the area densities of the three layers are almost equal.The other structure is a f l at hexagonal bilayer ice produced at wall separation of 0.8 nm under lateral pressure of 100 MPa,analogous to a system demonstrated by Koga et al.[Phys.Rev.Lett.79,5262(1997)].Both f i rst-order and continuous phase transitions take place in these simulations.
Conf i ned water,Molecular dynamics,Hexagonal-rhombic trilayer ice, Hexagonal-rhombic trilayer ice
I.INTRODUCTION
Conf i nement disrupts the hydrogen bonding network in bulk water,leading to novel and intriguing structures and properties of conf i ned water different from their bulk counterparts.Because of the important role of conf i ned water in biology,geophysics and advanced technology,in recent years this area has attracted a great deal of interests[1-10].
On one-dimensional structures,Zangi and collaborators studied the freezing of water in carbon nanotubes or under conf i nement by atomically detailed walls with dispersive,nondirectional interactions,showing the importance of substrate geometry on freezing[11,12].On two-dimensional structures,Han et al.demonstrated that in a hydrophobic nanoslit,the freezing of bilayer water may occur continuously as well as discontinuously through a f i rst-order phase transition[13].A f i rst-order water-to-ice freezing transition and a bilayer hexagonal ice phase were observed by Koga et al.via cooling along with compression of bilayer water in a nanopore with smooth walls[14,15].For water between walls with separation of 1.1 nm,Kumar et al.observed that a trilayer liquid transforms into a bilayer liquid with decrease of its density[16].
There are also some trilayer ices possessing longrange order in the configuration of oxygen atoms.With increases of the conf i ned water density,Giovambattista et al.found a f i rst-order transition from bilayer liquid to trilayer heterogeneous fluid(THF)which was characterized by a liquid(central)layer and two crystal-like layers next to the walls[17].As Zangi et al.observed in their simulations,conf i ned water at temperature of T=280 K can be induced to crystallize under the influence of external lateral electric f i eld with magnitude of 5 V/nm[18].They found two crystals:a low-density ice built from hexagonal rings parallel to the conf i ning walls and a high-density ice built from rhombic rings.
In the present work,we investigate the freezing transitions and structures of water conf i ned between two hydrophobic parallel walls via molecular dynamics simulations.Two crystalline structures are observed, and one of them has not been reported in literature. This new ice phase is a f l at hexagonal-rhombic trilayer ice(fHRTI),obtained under 1 GPa load at wall separation d=1.0 nm.The other crystalline phase is a f l at hexagonal bilayer ice(fHBI)produced from the simulation at d=0.8 nm and lateral pressure PL=100 MPa,and it is analogous to a system reported by Koga et al.[14].
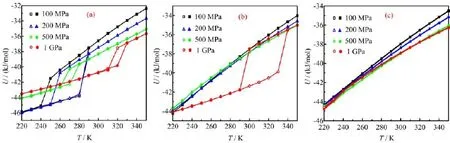
FIG.1 Potential energy U as a function of T for various lateral pressure at different wall separations.(a)d=0.8 nm,(b)d=1.0 nm,(c)d=1.2 nm.The cooling process and heating process are indicated by the solid and open symbols, respectively.
II.METHODS
We use the GROMACS simulation package[19]to simulate a system of 400 water molecules conf i ned between two inf i nite smooth hydrophobic parallel walls. The f i ve-site tetrahedrally coordinated model of TIP5P [20]is used to describe the water molecules.The wallwall separation d is set to be in the range from 0.8 nm to 1.2 nm,with an increment of 0.2 nm.The direction perpendicular to the walls is chosen as z,and the middle slab with equal distances to the two walls is def i ned as z=0.Periodic boundary conditions are imposed in the x and y directions,parallel to the walls.The waterwall interactions are modeled by a 9-3 Lennard-Jones potential which is commonly used to represent the effective interactions of water molecules with the conf i ning surfaces.This potential function is shown as follows [21-25]:
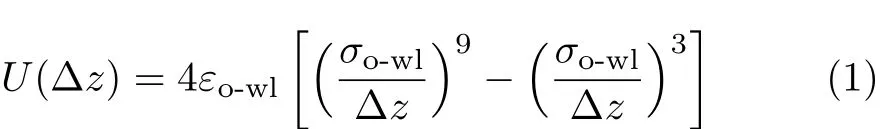
here∆z is the distance from the oxygen atom of a water molecule to the wall,whereas σo-wl=0.25 nm and εo-wl=1.25 kJ/mol are potential parameters,this set of parameter values were commonly used in simulations for conf i ned water[26-28].The ensemble is with constant number of molecules,PLand T.The Nos´e-Hoover thermostat[29,30]and Parrinello-Rahman barostat[31]are employed to control the temperature and pressure.Due to the non-periodicity in z direction, the long-range electrostatic interactions are treated with the slab-adapted Ewald sum method[32],and a cutof fof 1 nm is used for van der Waals and Coulomb interactions in real space.The simulation for each set of T and d is carried out for 50 ns with a step of 2 fs.
III.RESULTS
The MD simulations for various d and PLare performed.For each PL,the T is f i rst lowered from 350 K to 160 K with a step of 10 K and then raised in the same way.As Fig.1(a)shows,in the MD simulations for d=0.8 nm,the potential energy U f i rst gradually decreases with cooling of the system,and then suddenly drops by about 3-5 kJ/mol to a lower value.Analogously,upon heating the potential energy jumps to a higher value,but at a temperature higher than the transition temperature in the cooling process.In addition to the MD simulation for d=0.8 nm,the potential energies of system under 1 GPa load at d=1.0 nm also exhibit these abrupt changes.These phase transitions are identif i ed as f i rst-order.Moreover,these f i rst-order transitions between liquid and solid are accompanied by discontinuities of 3-4 orders of magnitude in the lateral diffusion coefficient DL,as shown in Fig.2.For example, in the cooling process at d=0.8 nm and PL=100 MPa and T=250 K,DL≈2.0×10⁻⁶cm2/s;for the same system at 240 K,DL≈1.2×10⁻¹¹cm2/s.In the other simulations,those are no sharp changes in the U and DL,while the DLgradually decrease under 10-8cm2/s, so we attribute them to continuous phase transitions. The lines of potential energy in the cooling and heating processes for continuous phase transitions are almost in registry.
With cooling of the system,conf i ned liquid water transforms into ice phases,including ten amorphous structures and two crystal-like structures in which one has not be reported in literature.We now turn attention to these structures.Based on the snapshots,their inherent configurations are obtained as the potential-energy local minimum structure by applying steepest-descent method.The inherent structures of the two crystalline phases and a representative amorphous structure are shown in Figs.3,4,and 5,respecvtively.
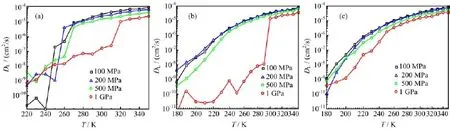
FIG.2 The lateral diffusion coefficient DLas a function of temperature T for various lateral pressure in the cooling process at different wall separations.(a)d=0.8 nm,(b)d=1.0 nm,(c)d=1.2 nm.
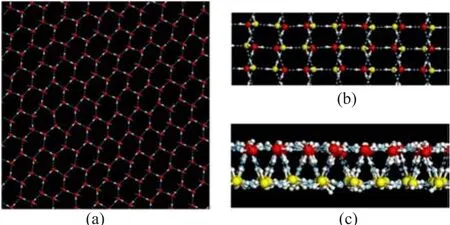
FIG.3 Inherent configuration of fHBI obtained from MD simulation at PL=100 MPa,T=240 K and d=0.8 nm.(a) Top view of the upper layer of this hexagonal bilayer lattice structure.(b)Zoomed top view of fHBI.(c)Side view of fHBI.Oxygen atoms in upper and lower layer are depicted in red and yellow,respectively;and hydrogen bonds in blue dotted lines.
Figure 3 shows the top and side views of a f l at hexagonal bilayer ice(fHBI)obtained at d=0.8 nm and PL=100 MPa and T=240 K.The water molecules in both layers form hexagonal rings,and all the oxygen atoms in each layer are located in the same plane.As a measure of the planarity of a layer,the width of the transverse density profile(TDP)of oxygen atoms is less than 0.05 nm(as shown in Fig.6(a)).This structure obeys the ice rule,i.e.,every molecule participates in four hydrogen bonds.Among these four hydrogen bonds,three are in the same layer,and the fourth one connects to a molecule in the opposite layer.As shown in Fig.7,the hydrogen bond O-H···O angle distribution exhibits a peak around 167◦and a shoulder ranging from 140◦to 160◦.The small angles of the shoulder are originated from the hydrogen bonds in the same planes.An analogous structure was reported by Koga et al.[13],which was also a f l at hexagonal bilayer ice. Nevertheless,there are still some differences between these two structures.In their simulations,the upper and lower distorted hexagonal lattices were completely in registry.While in this work,the oxygen atoms in the two layers are regularly staggered,as displayed in Fig.3(b).

FIG.4 Inherent structure of fHRTI obtained from MD simulation at d=1.0 nm and PL=1 GPa.(a,b)Top view of the ice layer next to one of the walls and at the middle slab. (c,d)Side view of fHRTI at direction of x and y.Oxygen atoms are depicted in red,hydrogen atoms in white,and hydrogen bonds in blue dotted lines.
We obtain another polymorph of ice under 1 GPa load at wall separation d=1.0 nm,which is previously unknown.Its TDP exhibits three peaks,as Fig.6(b) shows.At high temperature,the peak height of the central peak is lower than those of the other two peaks. When the temperature decreases from 300 K to 290 K, the heights of all the three peaks jump to higher values that are nearly equal.Meanwhile,the lateral diffusion coefficient DLdrops from 1.45×10⁻⁵cm2/s to 1.13×10⁻⁸cm2/s(Fig.2(b))and the potential energy shows a sharp change of about 4 kJ/mol(Fig.1(b)), indicating a f i rst-order transition between liquid and solid.In this ice phase(Fig.4(a)-(d)),the oxygen atoms form three f l at planes;the water molecules in the two layers next to one of the walls(outer layers)and in the middle layer form hexagonal and rhombic rings,respectively.So we name this structure as fHRTI.In the middle layer,a minimum repeating unit consists of two rhmobuses with different directions.Despite the different motifs in the outer layers and in the middle layer, the area densities of the three layers are nearly equal:the numbers of oxygen atoms in the three layers(up to down)are 132,136,and 132,respectively.This is also ref l ected in the three TDP peaks with similar heights and widths(Fig.6(b)).

FIG.5 Inherent structure obtained from MD simulation at d=1.2 nm and PL=1 GPa.(a)The top view of the upper layer of this amorphous structure.(b)The zoomed top view of the amorphous.(c)The side view of the amorphous. Oxygen atoms are depicted in red,hydrogen atoms in white, and hydrogen bonds in blue dotted lines.
As the case of fHBI,each water molecule in fHRTI also possesses four hydrogen bonds.For a molecule in the outer layers,three of its hydrogen bonds are in the same layer,and the other one connects to a molecule in the middle layer.On the other hand,for a molecule in the middle layer,two hydrogen bonds are in the same layer,and the other two connect to the two different outer layers.The distribution of O-H···O angles of hydrogen bonds(Fig.7)exhibits a peak around 162◦and a shoulder around 118◦,i.e.,some hydrogen bonds are heavily bent.These bent hydrogen bonds are between neighboring molecules of the outer layers in the chains in y direction(Fig.4(a)).
Among the ten amorphous structures,we pick the one at PL=1 GPa and d=1.2 nm as an example,and show its inherent structure in Fig.5.Its TDP exhibits four peaks(or two peaks and two shoulders),and shows no sharp change with change of temperature(Fig.6(c)). The densities of layers near the wall are signif i cantly higher than the middle two layers.Therefore,the composition of this structure may be called either four layers or two puckered layers.This amorphous structure lacks long-range order in the configuration of oxygen atoms, resulting in diverse and complicated hydrogen bonding patterns.
IV.CONCLUSION
In this work we have employed extensive MD simulations of water conf i ned between two hydrophobic parallel walls for three separations:d=0.8,1.0,1.2 nm. Both f i rst-order and continuous phase transitions are observed.
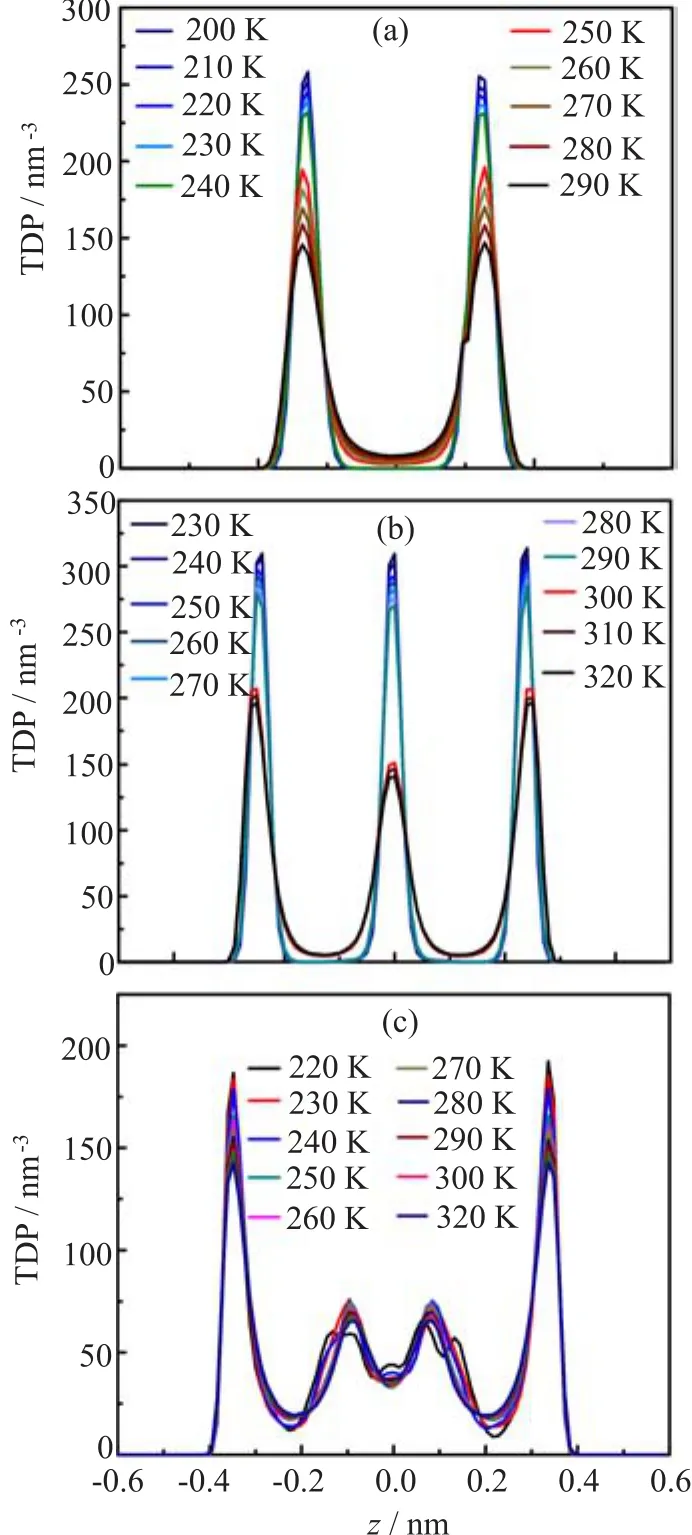
FIG.6 The TDP of oxygen atoms at different d,PL,and T. The TDP depending on T at(a)d=0.8 nm,(b)d=1.0 nm, and(c)d=1.2 nm.
Two kinds of crystalline ice phase fHBI and fHRTI are formed spontaneously,and fHRTI is f i rst ever reported. In both structures,each water molecule has four hydrogen bonds.The fHRTI is composed of two outer layers of hexagonal rings and a middle layer of rhombic rings. Among the four hydrogen bonds of a molecule in the outer layers,three are in the same layer,and the other one connects to the middle layer.For a molecule in the middle layer,only two hydrogen bonds are in the same layer,and the other two connect to the two different outer layers.These novel and interesting f i ndings on bilayer and trilayer ices deepen our understanding for conf i ned water.
V.ACKNOWLEDGMENTS
This work was supported by the National Natural Science Foundation of China(No.20603032,No.20733004, No.21121003,No.91021004,and No.20933006),by the Ministry of Science and Technology of China (No.2011CB921400),theNationalExcellentDoc-toralDissertationofChina(No.200736),theFundamental Research Funds for the Central Universities(No.WK2340000006,No.WK2060140005,and No.WK2060030012),and the USTC-HP HPC Project.
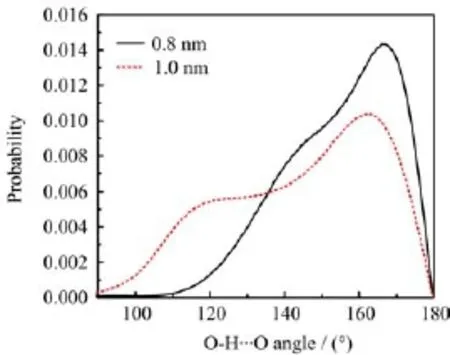
FIG.7 Distribution of hydrogen bond angles for fHBI(solid line)and fHRTI(dotted line).
[1]K.Koga,H.Tanaka,and X.C.Zeng,Nature 408,564 (2000).
[2]K.Koga,G.T.Gao,H.Tanaka,and X.C.Zeng,Nature 412,802(2001).
[3]R.J.Mashl,S.Joseph,N.R.Aluru,and E.Jakobsson, Nano Lett.3,589(2003).
[4]J.Bai,C.R.Su,R.D.Parra,X.C.Zeng,H.Tanaka,K. Koga,and J.M.Li,J.Chem.Phys.118,3913(2003).
[5]Y.Liu,Q.Wang,T.Wu,and L.Zhang,J.Chem.Phys. 123,234701-1(2005).
[6]D.Takaiwa,I.Hatano,K.Koga,and H.Tanaka,Proc. Natl.Acad.Sci.USA 105,39(2008).
[7]N.Kastelowitz,J.C.Johnston,and V.Molinero,J. Chem.Phys.132,124511(2010).
[8]K.Xu,P.Cao,and J.R.Heath,Science 329,1188 (2010).
[9]R.M.Kumar,M.Elango,R.Parthasarathi,and V. Subramanian,J.Phys.Chem.A 115,12841(2011).
[10]C.Guse and R.Hentschke,J.Phys.Chem.B 116,751 (2012).
[11]J.Bai,J.Wang,and X.C.Zeng,Proc.Natl.Acad.Sci. USA 103,19664(2006).
[12]R.Zangi and A.Mark,Phys.Rev.Lett.91,025502 (2003).
[13]S.Han,M.Y.Choi,P.Kumar,and H.E.Stanley,Nat. Phys.10,1038(2010).
[14]K.Koga,X.C.Zeng,and H.Tanaka,Phys.Rev.Lett. 79,5262(1997).
[15]J.C.Johnston,N.Kastelowitz,and V.Molinero,J. Chem.Phys.132,124511(2010).
[16]P.Kumar,S.V.Buldyrev,F.W.Starr,N.Giovambattista,and H.E.Stanley,Phys.Rev.E 72,051503 (2005).
[17]N.Giovambattista,P.J.Rossky,and P.G.Debenedetti, Phys.Rev.Lett.102,050603-1(2009).
[18]R.Zangi and A.E.Mark,J.Chem.Phys.120,7123 (2004).
[19]B.Hess,C.Kutzner,D.van der Spoel,and E.Lindahl, J.Chem.Theory Comput.4,435(2008).
[20]M.W.Mahoney and W.L.Jorgensen,J.Chem.Phys. 112,8910(2000).
[21]S.Han,P.Kumar,and H.E.Stanley,Phys.Rev.E 79, 041202(2009).
[22]P.Kumar,S.V.Buldyrev,F.W.Starr,N.Giovambattista,and H.E.Stanley,Phys.Rev.E 72,051503-1 (2005).
[23]K.Koga and H.Tanaka,J.Chem.Phys.122,104711-1 (2005).
[24]J.Bai,C.A.Angell,and X.C.Zeng,Proc.Natl.Acad. Sci.USA 107,5718(2010).
[25]D.Bratko,C.D.Daub,and A.Luzar,Phys.Chem. Chem.Phys.10,6807(2008).
[26]S.H.Han,M.Y.Choi,P.Kumar,and H.E.Stanley, Nat.Phys.6,685(2010).
[27]C.Y.Lee,J.A.McCammon,and P.J.Rossky,J.Chem. Phys.80,4448(1984).
[28]S.H.Lee and P.J.Rossky,J.Chem.Phys.100,3334 (1994).
[29]S.Nos´e and M.L.Klein,Mol.Phys.50,1055(1983).
[30]W.G.Hoover,Phys.Rev.A31,1695(1985).
[31]M.Parrinello and A.Rahman,J.Appl.Phys.52,7182 (1981).
[32]I.C.Yeh and M.L.Berkowitz,J.Chem.Phys.111, 3155(1999).
ceived on May 22,2013;Accepted on May 29,2013)
∗Author to whom correspondence should be addressed.E-mail:yuanlf@ustc.edu.cn
 CHINESE JOURNAL OF CHEMICAL PHYSICS2014年1期
- CHINESE JOURNAL OF CHEMICAL PHYSICS的其它文章
- Experimental and Theoretical Investigation on Excited State Intramolecular Proton Transfer Coupled Charge Transfer Reaction of Baicalein
- Theoretical Study of Reagent Rotational Excitation effect on the Stereodynamics of H+LiF→HF+Li Reaction
- Infrared Spectroscopy of COIsolated in Solid Nitrogen Matrix
- effects of Rotational Isomerism and Bond Length Alternation on Optical Spectra of FTC Chromophore in Solution
- High Pressure Structural Instability and Thermal Properties of Rutile TiO2from First-principles
- Kinetic Implication from Temperature effect on Hydrogen Evolution Reaction at Ag Electrode