过生长法制备准凹面体状Pt-Ni纳米合金及其甲醇氧化电催化性能
王 纯 康建新 王利利 陈庭文 李 杰 张东凤 郭 林
(仿生智能界面科学与技术教育部重点实验室,仿生能源材料与器件北京市重点实验室,北京航空航天大学化学与环境学院,北京100191)
1 Introduction
Up to now,platinum is still the most efficient electrocatalyst in fuel cells mainly including polymer electrolyte membrane fuel cell(PEMFC)and direct methanol fuel cell(DMFC).1-3Improving the catalytic performance(activity,selectivity,and durability)and minimizing the usage of costly platinum remain as the major tasks for its commercialization.Alloying Pt with less expensive transition metals such as Fe,Co,and Ni has been proved as a promising approach.4-8It was believed that the down-shiftedd-band position is responsible for the improved catalytic properties by modulating the adsorption energies of the reactants on the catalyst as well as their activation energies.9-13Thed-band centre position is not only closely related with the alloying element,but also depends on the shape and size of the catalyst.Thus,the controlled synthesis of Pt-based nanoalloys attracted great research interest.
Among various reported Pt-based bimetallic nanostructures,Pt-Ni nanoalloy represents an exciting electrocatalyst candidate.A pioneer work is the report by Stamenkovic and his collaborates in 2007.14They found that Pt3Ni(111)surface is 10-fold more active for the oxygen reduction reaction(ORR)relative to pure Pt{111}and 90-fold higher than the commercial Pt/C catalysts.The efficiently downshiftedd-band centre(-0.34 eV for(111)relative to pure Pt)by the alloying of Ni with Pt and the unique arrangement of surface atoms are believed as the major contributor for the greatly enhanced activity.It is expected that the loweredd-band would weaken the adsorption of atomic and molecular adsorbates such as H,O,OH,O2,and CO on the surface and thus increase the catalytic activity of the related reaction such as ORR,water-gas shift(WGS),and methanol oxidation reaction(MOR).15Therefore,the grand triumph of the development on the catalytic performance stimulated many efforts in the controlled synthesis of PtNi nanocrystals and the catalytic performance investigation.For example,Yanget al.16reported that the{111}-facet-terminated Pt3Ni truncated-octahedral(t,o-Pt3Ni)catalysts showed 4 times as much as the mass activity of the commercial Pt catalyst;Fanget al.17prepared the{111}-bounded Pt3Ni nannoctahedra and the{100}-bounded nanocubes,and demonstrated that the ORR activity on the Pt3Ni nanoctahedra is 5-fold higher than that of nanocubes.Carpenteret al.18obtained well-faceted Pt/Ni nanoparticles including cubic and cuboctahedral nanocrystals of Pt3Ni,octahedral and truncated octahedral nanocrystals of PtNi,and they showed ORR specific activities 3 to 5 times greater than that of a Pt standard catalyst.Sun and his collaborators19reported the enhanced MOR activity of bimetallic PtNi electrocatalysts relative to pure Pt.Besides very few reports involved the fabrication of dendritic nanostructures,20however,{111}or{100}bounded polyhedrons including cube and octahedron are still the most-likely achieved geometry.Concave structures are expected to exhibit enhanced catalytic ability owing to the presence of low-coordinate atomic steps and kinks at high densities.21-23Although progress has been made in the fabrication of concave nanocrystals of novel metals,including Ag,24,25Au,26,27Pd,28,29Pt,30,31and Rh,32,33the reports on the bimetallic nanoconcaves are still very limited due to its thermodynamicunfavored character.
In this paper,we report the construction of concave Pt-Ni nanostructuresviaa kinetically controlled overgrowth process.The concave structures were found formed by the epitaxial addition of atoms on the corners of the preformed cubooctahedrons.The electrocatalytic activity of the concave structures was investigated with methanol oxidation reaction as the model reaction.
2 Experimental
2.1 Preparation of Pt-Ninanoconcaves
All the reagents used in this work were of analytical grade and used as received.In a typical synthesis,H2PtCl6·6H2O(0.06 mmol),Ni(acac)2·4H2O(0.18 mmol),and 1,2-dodecanediol(5.0 mmol)were dissolved in a solution containing 8.0 mL oleylamine and 2.0 mL oleic acid.After stirring in water bath at 40°C for 1 h,the mixture was purged with Ar gas for 15 min.It was first heated to 120°C and evacuated for 10-15 min to remove the water vapour.Then,the temperature was raised to 240°C and kept at that temperature for 60 min.After cooling to room temperature,the products were collected by centrifugation,and washed with ethanol and hexane alternately for several times.
2.2 Characterizations
Transmission electron microscopy(TEM)and high resolution transmission electron microscopy(HRTEM)were employed to characterize the morphologies and structures of the products carried out at JEOL JEM-2100F with an accelerating voltage of 200 kV.Elemental distribution profiles were collected by energy dispersive X-ray spectrometer(EDS)equipped within the JEOL JEM-2100F TEM.The structure of the products was characterized by the powder X-ray diffraction(XRD)using a Rigaku Rotaflex Dmax2200 diffractometer with CuKαradiation(λ=0.15406 nm).X-ray photoelectron spectroscopy(XPS)measurement was carried out on an Axis Ultra spectrometer at a pressure lower than 10-6Pa with a standard AlKαexcitation source(1486.6 eV).The charging effect was corrected by adjusting the binding energy of the main C 1speak to 284.6 eV.
2.3 Electrocatalytic activity measurement
To prepare the working electrode,glassy carbon electrodes(Φ3 mm)were polished to a mirror-finish prior to each experiment and served as substrates for the catalysts.An aliquot of 5.0 μL of 2 mg·mL-1as-synthesized nanocatalyst suspension in deionized water was dropped onto the glassy carbon electrode and dried in an incubator.Then,7 μL of Nafion alcohol solution(0.25%,mass fraction)was coated on the top of the dried catalyst layer and the electrode was dried in an incubator.Electrochemical measurements were performed using a CHI 660C electrochemical workstation(Chenhua,Shanghai)atroom temperature(about 25°C).A Pt wire served as the counter electrode,and a Ag/AgCl electrode saturated with KCl solution was used as the reference electrode.The cyclic voltammetry(CV)measurements were carried out in the aqueous solution of 0.5 mol·L-1H2SO4with or without 1.0 mol·L-1CH3OH for different purposes.Chronoamperometry measurements were performed under a potential of 0.7 V for 600 s in 0.5 mol·L-1H2SO4solution containing 1.0 mol·L-1CH3OH.All solutions were fully purged with Ar gas before the measurements.The electrode potential in this study is reported with respect to theAg/AgCl electrode.
3 Results and discussion
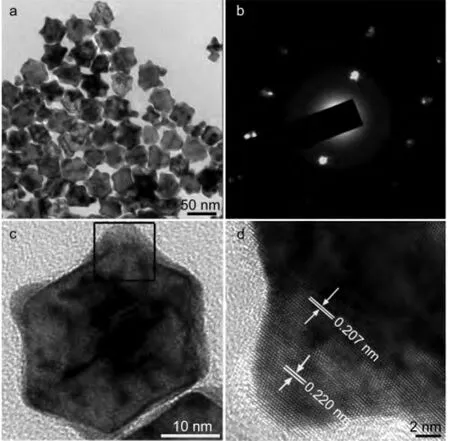
As shown in the TEM image(Fig.1),the products exhibited as concave structure with sizes in the range of 35-45 nm.The SAED pattern recorded on an individual concave is shown in Fig.1b.It can be identified as two sets of diffraction patterns of cubic structures.Thed-spaces of{100}facet were measured as 0.220 and 0.206 nm,respectively.It indicated that the concaves were composed by two phases.The HRTEM characterization revealed the underlying answer.Fig.1d is the corresponding HRTEM image recorded near the corner of an individual concave as shown in the framed area in Fig.1c.It was found that the lattice fringe distance at the corner part is different from that on the core part.The lattice space was measured as 0.220 nm at the corner while that was 0.207 nm on the core,both lying between the{111}facets of fcc-Pt and fcc-Ni.The magnified TEM image as depicted in Fig.1c shows that there was clear boundary between the core and the epitaxial corner.According to the Vegard’s law,it suggested that the Pt/Ni ratio in the core is 1/4 while that at the epitaxial corner is of 3/1.That is to say,it was Pt-rich at the corner while Ni-rich on the core.The average molar ratio between Pt and Ni(27.35:72.65)was approaching 1:3 as determined by TEM and EDS data.

Fig.1 (a)TEM survey image of the product,(b)SAED,and(c)high-magnified TEM image of an individual quasi-concave structure,(d)HRTEM image recorded on the framed area in(c)
The phase-mixed features were further confirmed by the powder XRD characterization.As shown in Fig.2,the XRD diffractions can also be indexed to two sets.The asymmetric feature of the peak centred at around 42°implied that it was a superimposition rather than a single peak,which can be deconvoluted into two peaks centred at 41.71°and 43.61°,respectively.Besides the strong peaks,two weak diffractions can also be identified locating at 47.36°and 50.88°,respectively.In conjunction with the diffraction data of pure Pt(JCPDS No.04-08020)and pure Ni(JCPDS No.04-0850),the peaks at 41.71°and 47.36°can be indexed as Pt-rich phase and those at 43.61°and 50.88°coincident with Ni-rich phase.
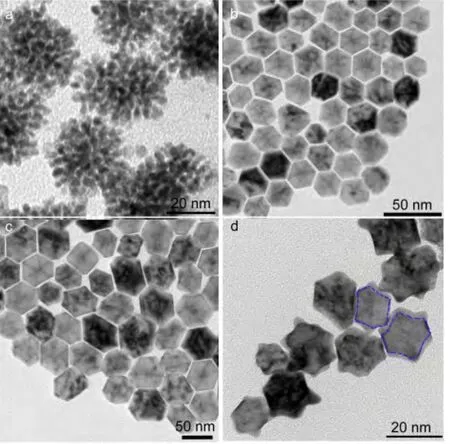
To learn more details on the growth mechanism of the concave structures,we performed the time-dependent experiments by keeping other conditions identical.TEM observation revealed that when the reaction was quenched at 2 min,the products were composed by nanoparticles with sizes of~4 nm,which tended to aggregate to lower the surface energy(Fig.3a).With the reaction proceeding,the shape of the nanoparticle became more regular and the sizes increased quickly.As shown in Fig.3b and 3c,the size of the products was of~23 nm after 5 min of reaction while it increased to~45 nm after 15 min.By detailedly analyzing the projection of the product in different orientation(Fig.S1,in Supporting Information),it can be concluded that the exact shape of the polyhedron was cuboctahedron.After that,the size increase was not obvious and the epitaxial corner began to evolve after 20 min of reaction.With the evolution towards the concave structure,the sizes of the products indeed had a slightly shrinkage.As shown in Fig.1a and Fig.3d,the concave products collected at 1 h were of 35-45 nm in diameter.The exact geometry configurations of the concave products were verified by further TEM characterization in combination with the three-dimensional(3D)modeling.Fig.4aand Fig.4b are the TEM images of one typical structure oriented in different directions(titled from 10°to-20°),respectively.Obviously,the TEM images agreed well with the 3D model of the structure formed by epitaxial growth on the 12 vertexes of an octahedron.Thus,it is reasonable to conclude that the concaves were formed by atomic addition on the corners of the preformed octahedrons.

Fig.2 XRD patterns of(a)the quasi-concave structures,(b)fcc-Ni with JCPDS No.04-0850,and(c)fcc-Pt with JCPDS No.04-0802

Fig.3 TEM images of the products collected at different durations

Fig.4 TEM images of a typical individual quasi-concave structure with different orientations
EDS analysis of the collected products sampled at different reaction stages revealed that the composition was also evolved with the duration.At very initial stage,the products were of Ptrich.For example,the Pt/Ni ratio was determined as~89:11 when the duration was as short as 2 min.is expected to be easier reduced since the standard reduction potential for the Ni2+/Ni(Eθ=-0.25 eV,vsstandard hydrogen electrode(SHE))is lower than that of PtCl62-/Pt(Eθ=0.375 eV,vsSHE).Thus,it is not out of expectation that the products were of Pt-rich at initial stage.After 5 min of reaction,however,the Pt/Ni ratio was sharply decreased to 25:75.It indicated that the burst nucleation of Ni atoms occurred at this period.We believe that the nucleation was catalyzed by the pre-formed Pt nuclei as known as the underpotential deposition phenomenon(UPD).Since the alloying ability between Ni and Pt is extremely strong,the generated Ni atoms would rapidly diffuse into the lattice of Pt,which resulted in the sharp increase of the Ni percentage in the products and excluded the phase-separated growth.17,34When the reaction was quenched at 15 min,the Pt/Ni ratio slightly decreased to 20:80,which is also consistent with the expected composition of the core deduced from the lattice space as discussed above.In conjunction with the greatly enlarged size during this stage(from 23 nm at 5 min to 45 nm at 15 min as discussed above),it is reasonable to conclude that the generation of Pt and Ni atoms was continuing at this stage.For fcc structured metal nanocrystals,a truncated octahedron is believed as its thermodynamic equilibrium form,35which could elaborate the cuboctahedral morphology.
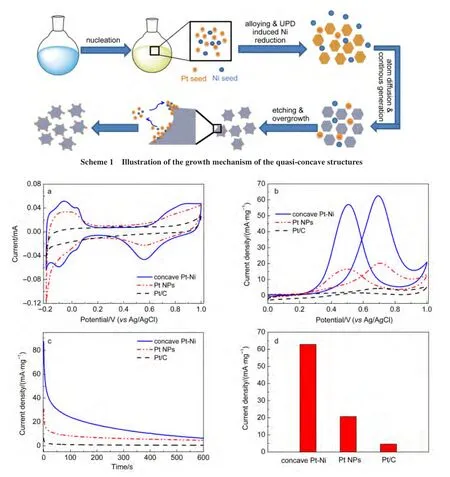
It raised a question to us that why the morphology would evolve from the thermodynamic cuboctahedron to the thermodynamic-unfavorable concave.It is generally accepted that sitespecific dissolution and directionally controlled overgrowth are two complementary strategies for the formation of concave structures.36However,a dissolution-based process is beneficial for the formation of structures with round profile while faceted structures are preferredviaan overgrowth process.The welldefined facets on the core and the clear boundary between the core and the corner as shown in Fig.1c and Fig.3d suggested the overgrowth process in our case.After detailed analysis,it can be found that the sides of some octahedron cores were indeed etched to some extent in our case.As shown in Fig.3d and Fig.4b,the cross section toward the center of the{100}facets was slightly reduced as indicated by the dash line.The slightly reduced size might provide another proof for the etching.It was reported previously that etching can occur on the surface of Ni and the{100}planes of Pt in the presence of acetylacetonate,which was believed to be caused by the coordination chelation between an enol form of acetylacetone and the Pt/Ni atom.30,37,38The newly formed Pt and Ni atoms would prefer to deposit on the corner sites of the cuboctahedrons owing to their relative high energy,which led to the formation of the concave structures.The Pt-rich in the epitaxial parts implies that the chelating ability of enol with Pt might be much stronger than that with Ni.On the other hand,since the feed ratio between PtCl4-and Ni(acac)22+is 1:3 while the Pt/Ni ratio in the cuboctahedron is 1:4,the remaining concentration of Pt2+in the solution is larger than that of Ni2+.Therefore,it is expected that more Pt atoms were generated at the later stage,which might also contribute to the Pt-rich corner.The illustration of thegrowth process is depicted as in Scheme 1.
We benchmarked the electrocatalytic activity of the as-prepared concave structures against the pure Pt nanoparticles synthesized under similar conditions but without the introduction of H2PtCl6and the commercial Pt/C.Fig.5a compares the cyclic voltammograms(CV)curves on the concave catalysts,Pt nanoparticles and commercial Pt/C recorded in 0.5 mol·L-1Arpurged H2SO4solution between-0.2 and 1.0 V at the sweep rate of 50 mV·s-1.Before CV measurements,the catalysts were subjected to potential cycling between-0.2 and 1.0 V(versusa reversible Ag/AgCl)for 20 cycles to further clean the particle surface at the sweep rate of 200 mV·s-1.The electrocatalytic currents were normalized to the mass of Pt.The curves of the nanohybrids resemble that of the pure Pt nanoparticles,showing well-defined hydrogen adsorption/desorption peaks in the potential region of-0.2 to 0.2 V,the double-layer region from 0.20 to 0.40 V,and the metal oxidation/reduction peaks in the range of 0.4 to 0.8 V.
Then,the electrocatalytic activities of toward the oxidation of methanol were investigated.Fig.5b shows the CV curves on the concave catalysts and commercial Pt/C recorded in 0.5 mol·L-1Ar-saturated H2SO4aqueous solution containing 1.0 mol·L-1CH3OH between 0 and 1.0 V at the sweep rate of 50 mV·s-1.During the positive scan,the current increases until a peak is seen at around 0.74 V,which is attributed to the electro-oxidation of methanol.When the potential scan is reversed,a peakcentred at 0.56 V occurs,which is due to the reactivation of Ptoxides.It is well-known that the forward anodic peak potential is an important parameter to evaluate the catalytic performance.As shown in Fig.5b,the Pt-mass-normalized current density of the anodic peak on concave Pt-Ni nanocatalysts(62.8 mA·mg-1)is much higher than that on Pt NPs(20.7 mA·mg-1)and as high as about 13.6 times of commercial Pt/C(4.6 mA·mg-1).Fig.5d demonstrated the activity difference more clearly.The results indicate that the addition of Ni enhanced the electrochemical activity of Pt.

Fig.5 Cyclic voltammograms of concave Pt-Ni,pure Pt nanoparticles(NPs),and commercial Pt/C in(a)0.5 mol·L-1H2SO4,(b)0.5 mol·L-1H2SO4+1 mol·L-1CH3OH;(c)chronoamperometry curves in 0.5 mol·L-1H2SO4+1 mol·L-1CH3OH at 0.7 V;(d)comparison of mass specific activities of the three catalysts for methanol oxidation
Furthermore,the long-term stability and tolerant ability to CO intermediates were evaluated by the chronoamperometry measurements performed in 0.5 mol·L-1H2SO4+1 mol·L-1CH3OH at 0.70 V.As shown in Fig.5c,the current densities of all catalysts decay rapidly at the initial stage,which may be due to hydrogen adsorption and the double-layer discharge.The subsequent decay was believed to be caused by the adsorption of a small amount of CO on the catalyst surfaces during methanol electrooxidation.19Although the current continues to decay gradually,the concave Pt-Ni nanostructure maintains a higher current density(normalized to the mass of Pt)than the pure Pt over the entire time range,demonstrating the prominent stability and tolerance to CO.
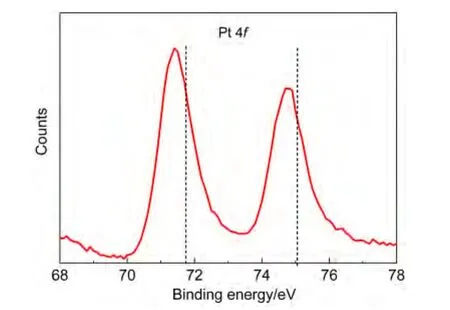
It is known that the MOR on the Pt surface involves the dehydrogenation of methanol to intermediates such as CO.Thus,an improved CO oxidation removal process as well as the decreased CO adsorption strength may result in an accelerated methanol oxidation reaction rate.It was reported that the loweredd-band centre is an important factor for the weakened CO adsorption.19,39,40To identify the electronic structure of the concave structures,XPS characterization was employed.As shown in Fig.6,the binding energy located at 71.45 and 74.86 eV can be assigned to the Pt 4f7/2and 4f5/2,respectively.In comparison with the data of pure Pt as indicated by the vertical dotted lines in Fig.5,41,42it shifted ca 0.32 eV towards low energy side.Obviously,thed-band of Pt was downshifted by the introduction of Ni,which might be attributed to the electron donation of Ni to Pt due to the electronegativity difference between Ni(1.91)and Pt(2.28).We believe that it is the major contributor to the high catalytic performance of the products.

Fig.6 XPS spectrum of Pt 4f in the quasi-concave structures
4 Conclusions
In summary,Pt-Ni concave nanostructures were synthesizedviaa solvothermal method.The concave structure was believed to grow by atomic addition on the 12 vertexes of a cubooctahedron through a simultaneous etching and overgrowth process.The epitaxial layer was of different composition from the core parts,which was confirmed by HRTEM,SAED,and XRD characterizations.The concave structures exhibit higher catalytic activity towards MOR and better tolerant ability to CO intermediates.The mass-normalized catalytic activity of the products is about 3.0 times of pure Pt nanoparticles and 13.6 times of that of the commercial Pt/C.In conjunction with the XPS data,the modified electron structure by the introduction of Ni was believed to play an important role in the improved catalytic performance.
Supporting Information:available free of chargeviathe internet at http://www.whxb.pku.edu.cn.
(1) Zhang,H.;Jin,M.S.;Xia,Y.N.Chem.Soc.Rev.2012,41,8035.doi:10.1039/c2cs35173k
(2) Peng,Z.M.;Yang,H.Nano Today2009,4,143.doi:10.1016/j.nantod.2008.10.010
(3) Sun,S.H.;Zhang,G.X.;Geng,D.S.;Chen,Y.G.;Li,R.Y.;Cai,M.;Sun,X.L.Angew.Chem.Int.Edit.2011,50,422.doi:10.1002/anie.201004631
(4) Debe1,M.K.Nature2012,486,43.doi:10.1038/nature11115
(5) Gu,J.;Zhang,Y.W.;Tao,F.Chem.Soc.Rev.2012,41,8050.doi:10.1039/c2cs35184f
(6) Cailuo,N.;Oduro,W.;Kong,A.T.S.;Clifton,L.;Yu,K.M.K.;Thiebaut,B.;Cookson,J.;Bishop,P.;Tsang,S.C.ACS Nano2008,2,2547.doi:10.1021/nn800400u
(7) Zhou,X.W.;Gan,Y.L.;Sun,S.G.Acta Phys.-Chim.Sin.2012,28,2071.[周新文,甘亚利,孙世刚.物理化学学报,2012,28,2071.]doi:10.3866/PKU.WHXB201205031
(8) Peng,C.;Cheng,X.;Zhang,Y.;Chen,L.;Fan,Q.B.Acta Phys.-Chim.Sin.2004,20,436.[彭 程,程 璇,张 颖,陈 羚,范钦柏.物理化学学报,2004,20,436.]doi:10.3866/PKU.WHXB20040423
(9) Nøskov,J.;Abild-Pedersen,F.;Studt,F.;Bligaard,T.Proc.Natl.Acad.Sci.U.S.A.2011,108,937.doi:10.1073/pnas.1006652108
(10) Kelly,T.G.;Chen,J.G.Chem.Soc.Rev.2012,41,8021.doi:10.1039/c2cs35165j
(11)Alayoglu,S.;Nilekar,A.U.;Mavrikakis,M.;Eichhorn,B.Nat.Mater.2008,7,333.doi:10.1038/nmat2156
(12) Nilekar,A.U.;Alayoglu,S.;Eichhorn,B.;Mavrikakis,M.J.Am.Chem.Soc.2010,132,7418.doi:10.1021/ja101108w
(13)Zhang,L.J.;Xia,D.G.;Wang,Z.Y.;Yuan,R.;Wu,Z.Y.Acta Phys.-Chim.Sin.2005,21,287.[张丽娟,夏定国,王振尧,袁 嵘,吴自玉.物理化学学报,2005,21,287.]doi:10.3866/PKU.WHXB20050312
(14)Stamenkovic,V.R.;Fowler,B.;Mun,B.S.;Wang,G.F.;Ross,P.N.;Lucas,C.A.;Markovic,N.M.Science2007,315,493.doi:10.1126/science.1135941
(15)Mu,R.T.;Fu,Q.;Xu,H.;Zhang,H.;Huang,Y.Y.;Jiang,Z.;Zhang,S.;Tan,D.L.;Bao,X.H.J.Am.Chem.Soc.2011,133,1978.doi:10.1021/ja109483a
(16)Wu,J.B.;Gross,A.;Yang,H.Nano Lett.2011,11,798.doi:10.1021/nl104094p
(17) Zhang,J.;Yang,H.Z.;Fang,J.Y.;Zou,S.Z.Nano Lett.2010,10,638.doi:10.1021/nl903717z
(18)Carpenter,M.K.;Moylan,T.E.;Kukreja,R.S.;Atwan,M.H.;Tessema,M.M.J.Am.Chem.Soc.2012,134,8535.doi:10.1021/ja300756y
(19) Jiang,Q.;Jiang,L.H.;Hou,H.Y.;Qi,J.;Wang,S.L.;Sun,G.Q.J.Phys.Chem.C2010,114,19714.doi:10.1021/jp1039755
(20)Huang,X.Q.;Zhu,E.B.;Chen,Y.;Li,Y.J.;Chiu,C.Y.;Xu,Y.X.;Lin,Z.Y.;Duan,X.F.;Huang,Y.Adv.Mater.2013,25,2974.doi:10.1002/adma.v25.21
(21)Li,J.H.;Zhou,W.;Yao,M.;Guo,L.;Li,Y.M.;Yang,S.H.J.Am.Chem.Soc.2009,131,2959.doi:10.1021/ja808784s
(22) Berkovitch,N.;Ginzburg,P.;Orenstein,M.Nano Lett.2010,10,1405.doi:10.1021/nl100222k
(23) Tian,N.;Zhou,Z.Y.;Sun,S.G.J.Phys.Chem.C2008,112,19801.doi:10.1021/jp804051e
(24) Mulvihill,M.J.;Ling,X.Y.;Henzie,J.;Yang,P.D.J.Am.Chem.Soc.2010,132,268.doi:10.1021/ja906954f
(25) Xia,X.;Zeng,J.;Mcdearmon,B.;Zheng,Y.;Li,Q.;Xia,Y.Angew.Chem.Int.Edit.2011,50,12542.doi:10.1002/anie.201105200
(26) Jiang,Q.;Jiang,Z.;Zhang,L.;Lin,H.;Yang,N.;Li,H.;Liu,D.;Xie,Z.;Tian,Z.Nano Res.2011,4,612.doi:10.1007/s12274-011-0117-x
(27)Wu,H.L.;Chen,C.H.;Huang,M.H.Chem.Mater.2009,21,110.doi:10.1021/cm802257e
(28)Huang,X.Q.;Tang,S.H.;Zhang,H.H.;Zhou,Z.Y.;Zheng,N.F.J.Am.Chem.Soc.2009,131,13916.doi:10.1021/ja9059409
(29) Jin,M.S.;Zhang,H.;Xie,Z.X.;Xia,Y.Angew.Chem.Int.Edit.2011,50,7850.doi:10.1002/anie.v50.34
(30) Cheong,S.;Watt,J.;Ingham,B.;Toney,M.F.;Tilley,R.D.J.Am.Chem.Soc.2009,131,14590.doi:10.1021/ja9065688
(31)Yu,T.;Kim,D.Y.;Zhang,H.;Xia,Y.Angew.Chem.Int.Edit.2011,50,2773.doi:10.1002/anie.201007859
(32) Zhang,H.;Li,W.Y.;Jin,M.S.;Zeng,J.E.;Yu,T.K.;Yang,D.R.;Xia,Y.Nano Lett.2011,11,898.doi:10.1021/nl104347j
(33) Zhang,H.;Xia,X.;Li,W.;Zeng,J.;Dai,Y.;Yang,D.;Xia,Y.Angew.Chem.Int.Edit.2010,49,5296.doi:10.1002/anie.v49:31
(34)Deivaraj,T.C.;Chen,W.X.;Lee,J.Y.J.Mater.Chem.2003,13,2555.doi:10.1039/b307040a
(35) Xia,Y.N.;Xiong,Y.J.;Lim,B.;Skrabalak,S.E.Angew.Chem.Int.Edit.2009,48,60.doi:10.1002/anie.200802248
(36)Zhang,H.;Jin,M.S.;Xia,Y.N.Angew.Chem.Int.Edit.2012,51,7656.doi:10.1002/anie.201201557
(37) Nigg,H.L.;Ford,L.P.;Masel,R.I.J.Vac.Sci.Technol.1998,A16,3064.
(38) Nigg,H.L.;Masel,R.I.J.Vac.Sci.Technol.1998,A16,2581.
(39) Jiang,Q.;Jiang,L.H.;Hou,H.Y.;Qi,J.;Wang,S.L.;Sun,G.Q.J.Phys.Chem.C2010,114,19714.doi:10.1021/jp1039755
(40)Park,K.W.;Choi,J.H.;Sung,Y.E.J.Phys.Chem.B2003,107,5851.doi:10.1021/jp0340966
(41)Sun,Q.;Ren,Z.;Wang,R.M.;Wang,N.;Cao,X.J.Mater.Chem.2011,21,1925.doi:10.1039/c0jm02563a
(42)Xu,J.F.;Liu,X.Y.;Chen,Y.;Zhou,Y.M.;Lu,T.H.;Tang,Y.W.J.Mater.Chem.2012,22,23659.doi:10.1039/c2jm35649j

