Variable Viscosity and Density Biofilm Simulations using an Immersed Boundary Method,Part I:Numerical Scheme and Convergence Results
Jason F.Hammond,Elizabeth J.Stewart,John G.Younger,Michael J.Solomon,David M.Bortz
1 Introduction
This is the first of two articles which detail our investigation of the response and fragmentation of a biofilm in shear flow.Specifically,we study the mechanisms of biofilm fluid response and detachment in terms of spatially varying biofilm density,elasticity,and viscosity.In the simulations,we model the surface adherent biofilms using an extension of the immersed boundary method(IBM)(originally developed in Peskin(1977)).Our approach differs from the traditional IBM in several ways.We use experimentally measured biofilm bacterial cell locations as the positions for our Lagrangian nodes,whereas traditional IBM refines the Lagrangian mesh along with the Eulerian mesh.An important part of the IBM is in the choice of approximation of the Dirac delta function which transfers information between the two grids.We have accordingly adapted the approximation to scale with the radius of the bacteria rather than with the mesh width.Lastly we note that this work comprises the bulk of the lead author’s graduate school dissertation work.For further details of this and related work,we direct the interested reader to his dissertation(Hammond(2012))as well as a previous version of this paper posted on arXiv in(Hammond,Stewart,Younger,Solomon,and Bortz(2013)).The second article will address validation of the scheme presented here(Stotsky et.al(2014)).
In this introduction,we first provide a brief background on the biology and biomechanics of bacterial biofilms in §1.1.In §1.2,we discuss some alternative mathematical models that have been used to model biofilms(along with advantages and disadvantages).In §1.3,we introduce the immersed boundary method,and in§1.4,we discuss the significance of including variable viscosity.
1.1 Biomechanics of Bacterial Biofilms
Biofilms are a phenotype of bacteria that are found in health,industrial and natural settings.In the medical field,biofilms occur on devices such as contact lenses,catheters,and mechanical heart valves.In industrial settings,they occur in and on water pipes,storage tanks,ship hulls, filters,food preparation facilities,etc.In natural settings,they can be found as slime on rocks in bodies of water or as dental plaque on teeth.
Physically,biofilms are immobile and consist of a community of bacterial cells embedded in a dense surface-adherent extracellular matrix(ECM)of polysaccharides.Biofilms are mechanically strong structures that tend to deform and fragment rather than completely dislodge when subjected to flows.Figure 1 contains an elec-tron micrograph of a biofilm ofKlebsiella pneumoniae,clearly showing the ECM interconnecting the bacterial cells.
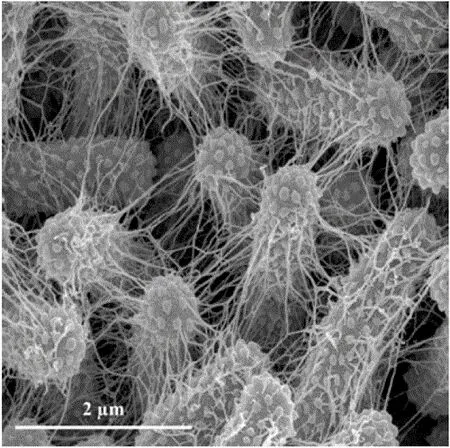
Figure 1:Scanning electron microscopy of sessile K.pneumoniae LM21 performed in mature biofilm formed on Thermanox slides in microfermentor system after 48 hours of development at 20000 times magnification.This image is from Balestrino,Ghigo,Charbonnel,Haagensen,and Forestier(2008)(used with permission).
An important feature of biofilms is that they are known to behave likeviscoelastic fluids(Klapper,Rupp,Cargo,Purvedorj,and Stoodley(2002)).In other words,they exhibit both viscous and elastic responses upon deformation.Describing the exact viscoelastic behavior has been the subject of much experimental,theoretical,and computational research(Aravas and Laspidou(2008);Ehret and Böl(2013);Klapper,Rupp,Cargo,Purvedorj,and Stoodley(2002);Kreft,Picioreanu,Wimpenny,and van Loosdrecht(2001);Lau,Dutcher,Beveridge,and Lam(2009);Pavlovsky,Younger,and Solomon(2013);Picioreanu,Kreft,and van Loosdrecht(2004);Picioreanu,van Loosdrecht,and Heijnen(2001,1999,2000);Rupp,Fux,and Stoodley(2005)).For example,Klapper et al.and Pavlosky et al.use a linear Jeffrey’s constitutive law(Klapper,Rupp,Cargo,Purvedorj,and Stoodley(2002);Pavlovsky,Younger,and Solomon(2013))while Lau et al.use a Voigt standard linear solid model for viscoelastic materials(Lau,Dutcher,Beveridge,and Lam(2009)).Recently,Ehret and Böl use an approach from network theory and model the ECM as a superposition of worm-like chain networks,and include viscosity by considering the network junctions to be transient(Ehret and Böl(2013)).Our model includes elasticity of the biofilm by using simple linear springs(as done in Alpkvist and Klapper(2007))to connect the bacterial cells,and includes the viscosity of the biofilm with a modification of the constitutive equations for stress.
1.2 Mathematical Models of Biofilms
Much research into the mathematical modeling of biofilm growth and fluid/structure interactions has been conducted in the last three decades(Kreft,Booth,and Wimpenny(1998);Kreft,Picioreanu,Wimpenny,and van Loosdrecht(2001);Picioreanu,van Loosdrecht,and Heijnen(2001,1999,2000);Zhang,Cogan,and Wang(2008a,b)).Below,we summarize several modeling and simulation strategies.This is not intended to be exhaustive and we direct the interested reader to Klapper and Dockery(2010);Wang and Zhang(2010)for more in-depth reviews.
The first attempts at mathematical modeling of biofilms were conducted in the early 1980s(Kissel,McCarty,and Street(1984);Rittmann and McCarty(1980);Rittmann(1982)).Picioreanu and others(Kreft,Booth,and Wimpenny(1998);Kreft,Picioreanu,Wimpenny,and van Loosdrecht(2001);Picioreanu,Kreft,and van Loosdrecht(2004))advocated for an individual based(IB)approach,which models the behavior of each bacteria,encompassing ideas such as cell division,cell motility,metabolism,and death to simulate the growth and formation of colonies.Hybrid discrete-continuum models were the first methods to couple the flow with the the biofilm computationally in 2D and 3D simulations.Picioreanu,van Loodsdrecht,and Heijnen developed and used these hybrid discrete-continuum models to incorporate the flow over the irregular biofilm’s surfaces,convective and diffusive mass transfer of substrate,bacterial growth,and biomass spreading(Picioreanu,van Loosdrecht,and Heijnen(2001,1999,2000)).
The most sophisticated(purely)continuum models developed are the phase- field models,which use a one- fluid/two-component formulation in which the ECM and the bacteria are modeled as one fluid component,while the collective ensemble of nutrient substrates and the surrounding fluid are the other(Zhang,Cogan,and Wang(2008a,b)).Two-dimensional simulations of both biofilm growth and biofilm- flow interaction are presented in Zhang,Cogan,and Wang(2008b),in which shear induced deformation and detachment are illustrated.
We note that our model differs from both these approaches in the way that we model the biofilm.We treat the bacteria in the biofilm as discrete points,where the nodal locations in our simulations correspond to the locations of the bacterial cells within the biofilm.This contrasts from the continuum phase- field models that only include averaged biomechanical properties of the biofilm.With our mathematical formulation,just as in the individual based models,we can obtain the cumulative local stresses as well as attribute different local properties to the biofilm.Our model can be thought of as an extension of the individual based models,where we accurately account for the interactions with the fluid as well as include the possibility of fragmentation.We also assume that on the time scale of our simulations there is no biofilm growth;so we ignore such factors as nutrient concentrations and growth rates.
1.3 Immersed Boundary Method
The immersed boundary method(IBM)was originally developed by Peskin to study blood flow in the heart(Peskin(1977)).The IBM has been used previously to model and simulate biofilm/ fluid interactions by Dillon,Fauci,Fogelson,and Gaver III(1996)and Alpkvist and Klapper(2007).The authors successfully coupled the fluid to the biofilm;however,they make the assumption that the biofilm has the same density and viscosity as the surrounding fluid.This choice substantially simplifies the task of solving the N-S equations but does not account for the fact that biofilms typically have 500×larger viscosity and 12%larger density than water(Klapper,Rupp,Cargo,Purvedorj,and Stoodley(2002);Ro and Neethling(1991)).They also use a random distribution of points within a biofilm-shaped shell to represent the biofilm,which does not account for the true spatial distribution of bacterial cells within a biofilm.
The IBM has been used more recently in the modeling of immersed elastic structures in viscous flows in Huang and Sung(2009);Luo,Mittal,Zheng,Bielamowicz,Walsh,and Hahn(2008);Strychalski and Guy(2012);Zhuo and Dillon(2011),in which the authors use constitutive viscoelastic models including Maxwell,Voigt,and Jeffrey’s models to incorporate forces in the immersed structures into the IBM.Similarly,our ultimate goal is to establish an appropriate constitutive model for the forces in the biofilm with the help of experimental collaborators and to include this in our IBM formulation.
1.4 Variable Viscosity
It is generally agreed that biofilms behave like a viscoelastic fluid and there has been a several efforts to match the behavior of biofilms with conventional mechanical viscoelastic models(Aravas and Laspidou(2008);Klapper,Rupp,Cargo,Purvedorj,and Stoodley(2002);Lau,Dutcher,Beveridge,and Lam(2009);Pavlovsky,Younger,and Solomon(2013)).1We also note that adding viscosity through the use of local damping forces(a typical mechanical model for a viscoelastic material)leads to problematic stability restrictions.However,these efforts have not produced a consensus on the best mathematical model.This is,in part,due to the fact that the viscoelastic properties in biofilms are highly variable with different growth conditions(Chen,Zhang,and Bott(2005))and even in the same growth conditions(Aggarwal,Poppele,and Hozalski(2010)).
In this work,we chose to treat the fluid in the entire domain as a Newtonian viscous fluid with a spatially varying viscous coefficient.We couple the biofilm to the fluid within the entire biofilm region via the viscous term in the N-S equations.We note that a similar approach has recently been attempted in a single fluid IBM(Fai,Griffith,Mori,and Peskin(2013,2014)).Their approach,however,is not directly applicable to a system with continuously varying viscosity.2They consider the simulation of a tumbling red blood cell with an interior viscosity higher than the surrounding fluid.Mathematically this means there is a discontinuity in the viscosity across the cell membrane.Others have used two materials( fluid- fluid or fluid-solid),but couple them only at the interface(Luo,Mittal,Zheng,Bielamowicz,Walsh,and Hahn(2008);Zhang,Cogan,and Wang(2008b)).
We now describe the organization of this paper.In§2 we provide our mathematical formulation,which is a variation of the immersed boundary method literature.In§3,we describe our numerical method,based on a multigrid approach.In §4,we provide numerical convergence results for our method.In§5,we provide simulation results in both two and three dimensions,running our simulations for a variety of experimentally obtained biofilms with varying parameters such as spring constants,densities,viscosities.Finally,we provide conclusions in§7 and a discussion of possibilities for future work in§8.
2 Mathematical Formulation
In this section,we provide the mathematical formulation for our simulations.We use an Eulerian mesh to describe the system as a whole and solve the dimensionless N-S equations at each time step on the mesh.The Lagrangian nodes are used only to compute information about the bacteria/biofilm(location,velocity,local density,force)and then transfer the information back onto the Eulerian mesh using the Dirac delta function.3The Dirac Delta function is approximated in the actual implementation(see Equation(16)).For convenience,we provide a list in Appendix A of the variables and parameters used in this work.
We now introduce the mathematical equations used in our model.The dependent Eulerian variables are velocity u(x,t),pressurep(x,t),densityρ(x,t),and Eulerian force density f(x,t),where x is the independent Eulerian variable andtis time.The dependent Lagrangian variables are position of the nodes X(q,t),velocity of the nodes U(q,t),and the Lagrangian force density F(q,t),where q=(q,r,s)is the independent Lagrangian variable.The equations of motion for the biofilm- fluid interaction are
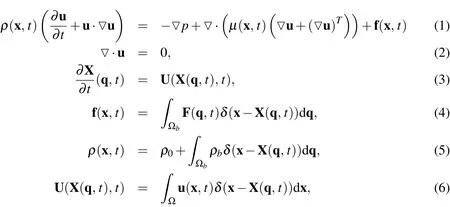
whereµis the dynamic viscosity,ρ0is the mass density of the fluid,ρbis the additional mass density of the biofilm from that of the surrounding fluid,Ω is the flow domain,is the space occupied by only the biofilm,andδ(x)is the Dirac delta function.Equations(1)and(2)form the incompressible Navier-Stokes(N-S)equations with spatially varying viscosity and a forcing term that represents the forces applied by the biofilm on the fluid.We omit the force of gravity from(1)since the biofilms we wish to model are at most 20%greater density than water(Masuda,Watanabe,and Ishiguro(1991);Ro and Neethling(1991));thus,the gravitational force is negligible compared to the other forces involved.Equation(3)is the equation of motion of the biofilm,where U(q,t)is the velocity of the biofilm.The systems of PDE’s given by(1)-(2)is coupled to(3)by the integrals given in(4)-(6).
To avoid numerical inaccuracies due to roundoff errors,we non-dimensionalize these equations using the non-dimensional variables defined as

wherep0is the pressure at the upstream end of the tube,pLtubeis the pressure at the downstream end of the tube,Tis the characteristic time scale,f0is the characteristic force density,andLis the characteristic length.We use the scaling parameters defined in Table 10. Dropping the stars from the dimensionless variables,Equations(2)and(4)-(6)remain the same as in the case with dimensions,while Equations(1)and(3)become

whereis the Strouhal number,the Euler number,andRe=is the Reynolds number of the fluid.
The initial velocity profile is the exact solution to the incompressible Navier-Stokes equations in a square or circular tube with rigid walls and no-slip conditions at the walls.The velocity profile for a circular cylinder can be found in many textbooks in fluid dynamics(such as Zamir(2000)),and a series solution for the laminar flow velocity profile for a square tube was derived by Spiga and Morino(1994).
3 Numerical Method
In this section,we describe the numerical formulation for our simulations,which is based on the Immersed Boundary Method.Our numerical task is to solve the system defined by Equations(1)-(6),and we now provide the details of our numerical approach.
The incompressible flow Navier-Stokes equations, (1)-(2), are discretized on a fixed uniform Eulerian lattice,while the biofilm equations are discretized on a moving Lagrangian array of points that do not necessarily coincide with the fixed Eulerian mesh points of the fluid computation.We represent the interaction equations(4)-(6)with a smoothed approximationto the Dirac delta function(see Equation(16)).Our numerical approach was inspired by the solving technique used by Zhu and Peskin(2002)to simulate a flapping filament in a soap film.
The discretized equations corresponding to Equations(4)-(6)are given by

where the superscriptndenotes numerical approximations at a particular time stepn,ηis the total number of Lagrangian discretization points,the sum in Equation(12)is over all the discrete points of the form x=(ih,jh,kh)withi,j,andkare integers,his the Eulerian mesh width,andis the average volume element of the Lagrangian nodes(computed by dividing the total volume of the biofilm by the total number of Lagrangian nodes distributed within it).Following convention,we replace(q,r,s)from the mathematical formulation with onlys,which we use as an indexed label with a unique number assigned to each Lagrangian point(Zhu and Peskin(2002)).In Equation(10),F(s)is now the total elastic force on the Lagrangian node associated with markers,as opposed to an elastic force density.This is because we calculate the force explicitly depending on which other nodes it is connected to.
3.1 Dirac Delta Approximation
In Peskin(2002),he definesδh(x)as
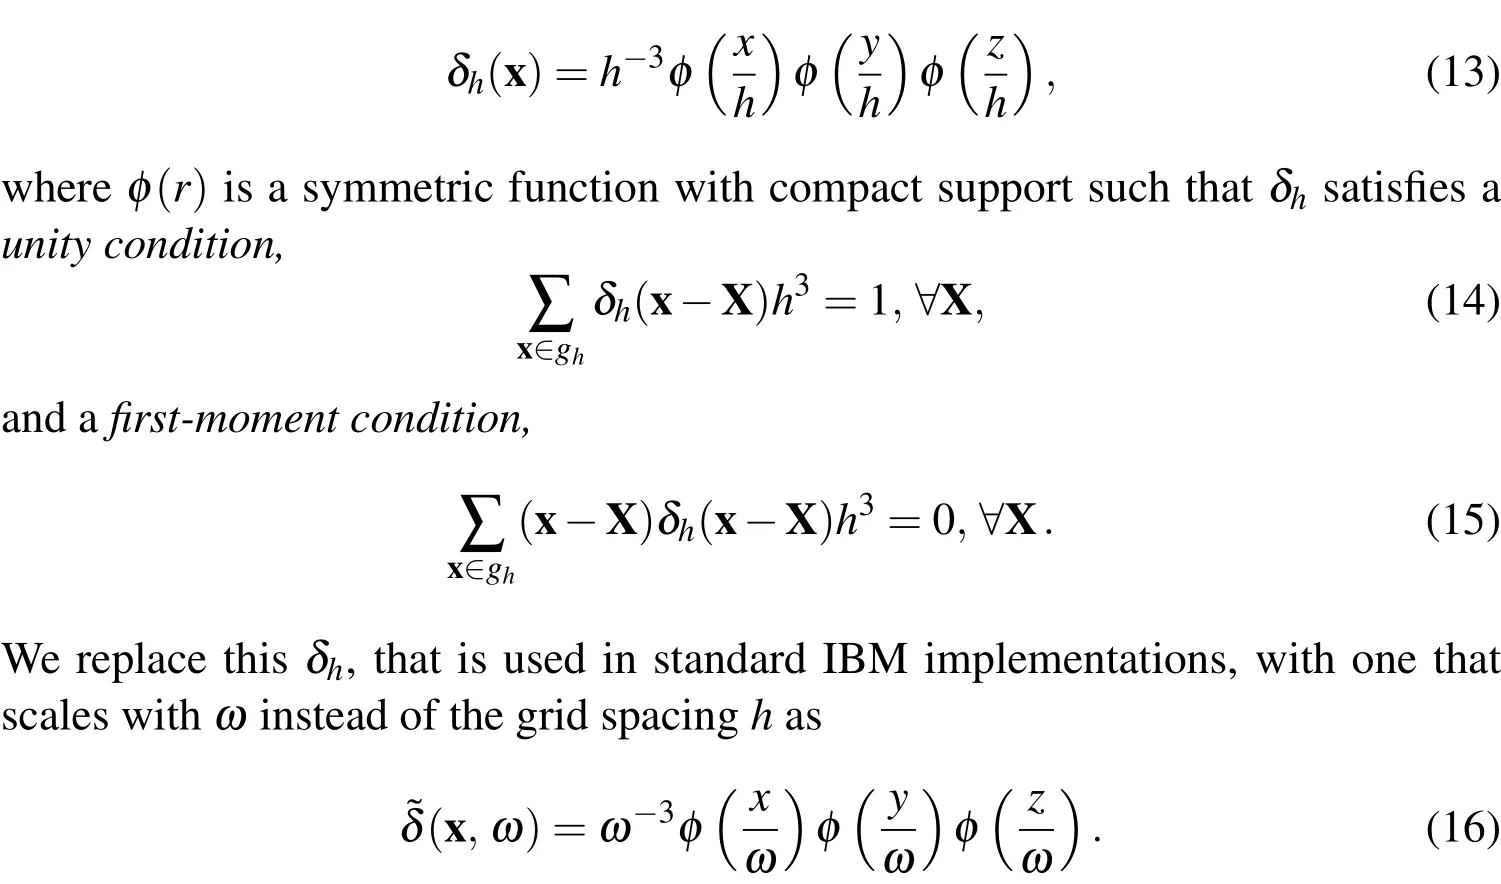
We deviate from the standard scaling of the Dirac Delta approximation for two reasons.The first is that we wish to give a presence to the bacterial cells that is representative of the true volume of the cells.Thus,in the simulations,we makeωin(10)-(12)equal to the radius of a bacterial cell that we are modelling.Equation(10)then spreads the force over a volume that is slightly larger than the cell,ensuring that the entire space occupied by the cell in the fluid is influenced by the force.The second reason we use this scaling is because,during the mesh refinement analysis described in§4.3.3,we discovered that the implementation with the scaling byhrestricts us to less than first-order convergence of the velocity,u.Using a scaling that is independent of the mesh-width fixes this issue and leads to greater than first order convergence.We also note that this class of modification is not a new practice and was used by Lim and Peskin to improve accuracy and to introduce material length scales in IBM in Lim and Peskin(2012).However,usingin place ofδh,these conditions are simultaneously satisfied only whenω=nhfor somen∈N+.In practice,this is not a major concern as many IBM formulations use a Dirac delta approximation that satisfies the unity condition,but does not satisfy the first-moment condition.Accordingly,we choose the function

as is done in Zhu and Peskin(2002)because it is a better match with the choices made forωandh.4For a thorough analysis of the errors induced by usingwe direct the interested reader to Hammond(2012);Hammond,Stewart,Younger,Solomon,and Bortz(2013)
3.2 Elastic Forces and Breaking Criteria
For a model of the elastic forces,we follow Alpkvist and Klapper(2007)who used Hooke’s Law to describe the elastic force between the connected Lagrangian nodes.Thus,the elastic force on each Lagrangian point using Hooke’s Law is

whereTis the tension between nodessandk,Iis the connectivity matrix defined as

and ds,kis the vector pointing from Lagrangian nodestokwith magnitudeds,k.The tension from the spring connecting nodesandkis formulated as

wherers,kis the rest length of the spring connecting nodessandk,andKs,kis its Hookean spring coefficient.We choose to define each spring coefficient as

whereFmaxis the force required to break the spring.We define the spring coefficients in this way to ensure that all of the springs,regardless of initial length,break with a force ofFmaxwhen they are stretched to a length of 2rs,k.In our simulations,we varyFmaxto attain specific results(such as detachment;see§5.1 more details).As is done in Alpkvist and Klapper(2007),we model the failure of the ECM by breaking the connections between the Lagrangian nodes as the springs used to connect them exceed twice their resting length.We note that this condition,however,is not based on experimental evidence,and in future work we will adapt this breaking criteria according to experimental results.In section§8,we discuss future adaptations to the breaking criteria in terms of the yield stress of polymers.
3.3 Variable Viscosity
It is known that ECM density decreases with distance from an individual cell.To account for this,the exact form ofµ(x)used in our simulations is

whereµmaxis the viscosity at a bacterial node,µoutis the viscosity of the surrounding fluid,Dis the spatial dimension,andωis a parameter we can use to stretch the influence of the additional viscosity.We made this choice forµ(x)because we wanted a viscosity that would decrease at the same rate as the elastic force with the distance from the bacterial cell.To illustrate how the viscosity will decay,in Figure 2 we depict a 1D example of the effect ofωandhon the viscosity distribution,µ(x),fromtwointeracting cells.In the subsequent work,we will change this function to suit the specific viscous properties of the particular biofilm.
3.4 Solution Strategy
We employ aprojection method(Brown,Cortez,and Minion(2001))to solve the incompressible Navier-Stokes equations numerically,building on the method used by Zhu and Peskin(2002).This method introduces a velocity field(at an intermediate time),which is the solution to the difference equation

wherekdenotes thekthcomponent of that vector.In this discretization,is defined for scalar functionsusing the midpoint values ofaas

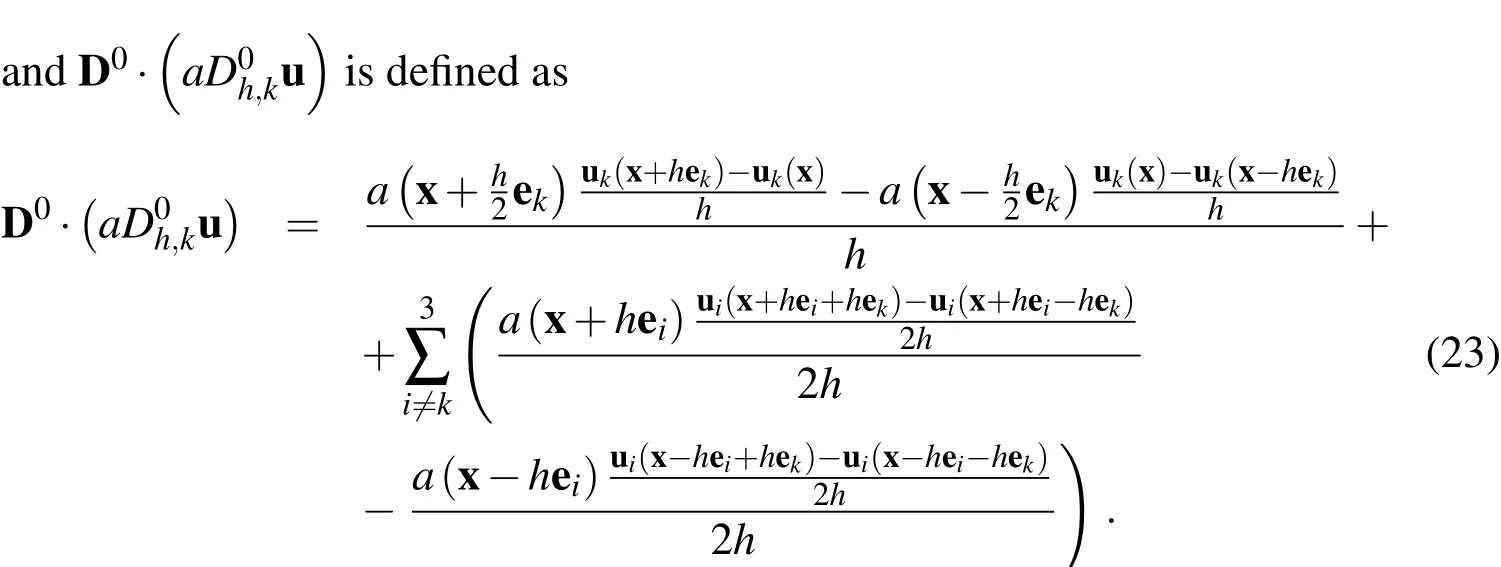
To complete the discretized incompressible Navier-Stokes system,we have the following two equations:

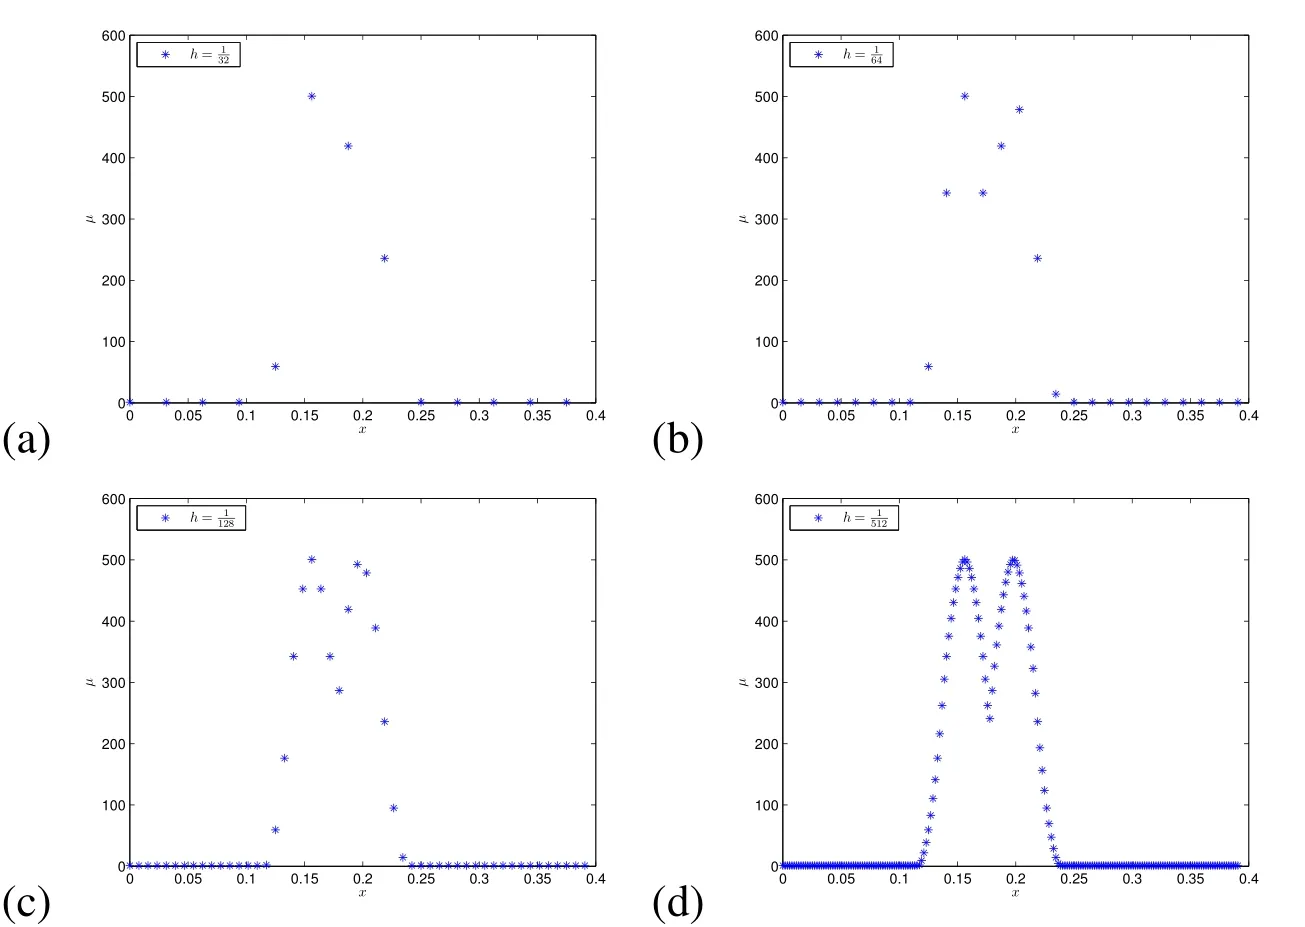
Figure 2:Examples of 1Dµ(x)with two Lagrangian nodes,one at x=5/32on an Eulerian node and the other at These Lagrangian nodes(cells)are close enough that there is a region of interaction.These plots illustrate the effect of using different spatial steps:
We point out here that summing Equations(21)and(24)leads to the discretized version of Equations(7)-(8),with the exception that the evaluation of the viscous term is at the intermediate value of the velocityWe solve for pressure by applying D0to both sides of Equation(24)and using Equation(25)to obtain

To solve equations(21)and(26),we use Gauss-Seidel as a smoother in a multigrid solver.At each time step,we solve Equations(7)-(8)for,substitute it into(26),solve forpn+1,and finally solve forun+1using(24).Then the velocity is transferred from the Eulerian points to the Lagrangian points using(12).With Un+1computed,the new Lagrangian node locations are computed using Euler’s method as

The forces between the Lagrangian points are then recalculated and transferred to the Eulerian points using Equation(10).Finally,the values ofρnandµnare evaluated using the new Lagrangian locations.
3.5 Multigrid
In this section,we discuss the elements of multigrid that we use in our solution strategy.For more details on multigrid,see Briggs,Henson,and McCormick(2000).In our solver,we use the conventional Gauss-Seidel iterative method with red-black ordering.In the multigrid scheme,we use full-weighting restriction to go from fine to coarse grids,and we use linear interpolation to go from coarse back to fine grids.The finest grid is the grid with step sizehand the grids become coarser by increasing the step size by a factor of 2.This halves the number of nodes in each dimension,allowing for significantly faster computations on the coarser grids.The number of levels in the multigrid solver depends on both the dimensions of the computational domain as well ash.In our simulations,we iterate using multigrid V-cycles until we reach a sufficiently low value for the norm of the residual,

at each time step.Here,Ahvh=fhis the linear discretization of a PDE,and the residual isrh=fh−Ah˜vh,where˜vis an approximation tov.The residual provides a bound on the true error in the solution of the linear system since we have this relationship between the error and the relative residual error:

whereandcond(Ah)is the condition number ofAh.In§4,we give approximations for the condition numbers for our matrices.
3.6 Boundary Conditions
The computational domain used in our example simulations is a section of a tube with the biofilm centered in the direction along the axis of the tube(see sigure in§5).In the 2D case, flow is along thex-axis and,in 3D,it is along thez-axis.The boundary conditions we used in these simulations were derived from exact solutions for the velocity and pressure in the case of laminar flow.We now provide the boundary conditions in both the 2D and 3D cases.
3.6.12D Boundaries
The no-slip boundary condition exists at the walls of tube and requires that the velocity be zero there,so we use that as the boundary condition at the walls.The velocity at the upstream boundary(x=0)is held at the conventional laminar flow velocity given by

whereais the radius of the tube,yis the displacement from the bottom edge of the tube,κis the linear rate at which the pressure decreases through the tube,andu1is the x-component of the velocity(i.e.,u=(u1,u2)).At the downstream boundary,a Neumann condition is applied to the velocity by enforcing that

wherexdownrepresents thexvalue at the downstream boundary.
The boundary conditions for pressure come from the laminar flow equation for pressure given by

In our simulations,we hold the pressure at the upstream boundary atp(0)and atp(xdown)at the downstream.At the top boundary,we hold the pressure at the values given by Equation(29)and,at the bottom boundary(the boundary on which the biofilm is attached),we use a Neumann boundary

3.6.23D Boundaries
In the 3D simulations,we orient the square tube along thez-axis.The no-slip boundary condition exists at the walls of tube and requires that the velocity be zero there so we use that as the boundary condition at the walls.Derived by Spiga and Morino(1994),the velocity at the upstream boundary is held at the laminar flow velocity given by

whereais the width of the tube andu3is the z-component of the velocity(i.e.,u=(u1,u2,u3)).At the downstream boundary,a Neumann condition is applied to the velocity by enforcing that

The boundary conditions for pressure come from the laminar flow equation for pressure given by

wherez=0 is the upstream boundary.In our simulations,we hold the pressure at the upstream boundary atp(0)and atp(zdown)at the downstream.At the top and side boundaries,we hold the pressure at the values given by Equation 31 and,at the bottom boundary(side with attached biofilm),we use the Neumann condition given by

4 Convergence
In this section,we provide numerical evidence for the convergence of our simulation strategy.For the purposes of the 2D and 3D convergence analysis conducted in later sections,we require the following notation.We present the following notation in 3D(the 2D versions are analogous but without thezelements).Define theEulerian grid function p-normfor an arbitrary 3D vector field,w(x)=(w1(x),w2(x),w3(x)),by

whereDis the spatial dimension,1≤p<∞,and

Additionally,on the Lagrangian grid define theLagrangian grid function p-normfor a vector field,X=(X1(s),X2(s),X3(s)),as

where 1≤p<∞andis the average volume element of the Lagrangian nodes.Then

Note that both of these grid function norms are derived from using discretizations of the integrals used in a typical function p-norm(see Appendix A of LeVeque(2007)for more details).
There are three parts to our simulation validation process:1)we illustrate that in the absence of the biofilm our numerical simulation converges to the analytical solution;2)we verify that our multigrid technique is correctly accelerating the convergence of our chosen relaxation scheme;and 3)we determine the convergence rate of the simulations with a biofilm using a mesh refinement convergence analysis.Before discussing the results of our validation process,we provide a brief description of the two primary sources of error present in our simulations,§4.1.We also setup our simulations with a detailed description of initial Lagrangian node positions in§4.2.Then we provide 2D simulation validation in§4.3 and 3D validation in§4.4.
4.1 Discussion of Errors
In our numerical scheme,we have two sources of error:1)discretization erroris introduced by discretizing the Navier-Stokes equations in space and time;and 2)algebraic erroris introduced when we attempt to solve the resultant systems of linearized equations.
As it is impossible to compute the true algebraic error,we use the norm of the residual to deduce an upper bound on the algebraic error using Equation 27.Recall that Equation 27 indicates that the relative algebraic error at each timestep is no larger than the condition number of the matrix times the relative residual norm(recall thatis the relative residual norm).We do not construct these matrices during the actual simulations because we do not need them to solve the systems.However,we did construct them to find their condition numbers and found that the condition numbers for the matrices used in the computations forare(this is true for both 2D and 3D simulations).The simulations that resulted in the plots given in §5.2 and §5.3 were run usingand thus the matrix condition numbers were approximately 104.
Our goal in the simulations is to ensure that the algebraic error falls well below the discretization error at each time step,so the total error will be dominated by the discretization error.In theory,the discretization error is at bestO(h2)≈C(1/128)2≈C×6×10−5,forC>0,with our discretization.Using a stopping criteria of 10−9for the relative residual at each timestep should suffice(i.e.,from Equation(27)).
We continue to the next time step only when the computed relative residual,10−9,because this implies
Another factor influencing the capability of our simulations is that after,extensive simulation,we discover that our linear solver is limited to converging to a relative residual norm of about 10−11(possibly from machine precision issues).Withh=the condition number isO(105)and the discretization error isO(10−6),so the algebraic error is at best bounded by about(see Equation(27)),and we can no longer be certain that the algebraic error falls below the discretization error at each timestep.For this reason,we restricthto be larger thanin all of the simulations and convergence analysis.
4.2 Simulation Setup
In these convergence simulations, we constructed an experimentally motivated mushroom shaped biofilm(shown in Figure 3(a)).We carved this shape from a 1.6µm slice cut from data points generated in the Younger and Solomon labs at the University of Michigan.These data points are 3D bacterial cell locations from 3D Leica SP2 confocal laser scanning microscopy images taken ofStaphylococcus epidermidisRP62A(ATCC 35984)grown in a Stovall 3 channel flow cell for 24 hours at 37◦C in tryptic soy broth with 1%glucose added under a wall shear stress of 0.01Pa.For further details of how the coordinates were computed,see Stewart,Satorius,Younger,and Solomon(2013).
From this data,the average Lagrangian volume elementis calculated to be approximately 4.036µm3,and thus we used0=1.59µm in both the 2D and 3D simulations.We connect the initial distribution of cells with a distance based connection criteria.Our inspiration for the connection distance criteria came from the closeup images of biofilms such as the one shown in Figure 1.We observed that each bacterial cell is connected to neighboring cells that are within about 2d0.Thus,we varied the connection criteria in our algorithm between 1.5-2.5×d0in an effort to find one that resulted in a biofilm that was sufficiently connected but not overcrowded.This resulted in the choice of a connection criteria ofdc=2.8µm.In other words,we placed spring connections between Lagrangian nodes at the beginning of the simulation with every node connected to every other node less than 2.8µm away.Admittedly,this value ofdcis arbitrary,and future work will include deriving a method to determine this connection criteria through image analysis of closeup images of biofilms similar to figure 1.The mushroom shaped biofilm has a height of about 8.5µm and width of about 8µm(see figure 3).In the convergence simulations,the maximum spring force,Fmax,is set to 5×10⁻⁶N.The fluid parameters for these convergence simulations are provided later in Table 9.
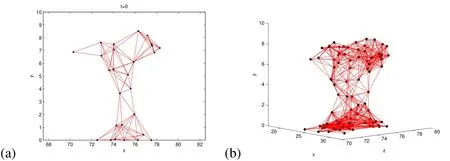
Figure 3:Mushroom-shaped biofilm at t=0 in the middle of the computational domain attached to the bottom(y=0)of the tube.(a)This is the shape used in the 2D simulations,and(b)3D mushroom shaped biofilm at t=0.
4.3 Two-Dimensional Validation
In the absence of a biofilm,we expect that using a centered finite difference approximation for the second derivatives allowsexactconvergence to the second-order polynomial solution(Equation(28)).That is to say,we expect the numerical solution to converge to the analytical within machine precision.Reassuringly,we find that the biofilm-free simulations converge exactly to the steady state laminar flow.5In the 3D simulations,we do not see exact convergence since the laminar solution is not a secondorder polynomial.See§5.3 for details on the convergence properties of the 3D laminar flow case.To illustrate,we started with an initial velocity profile that is one-half of that of the laminar flow velocity profile.The error in the simulation converged(within machine precision)in less than 300 time iterations for all spatial resolutions(see Figure 4 for example withh=1/128anddt=0.0001).
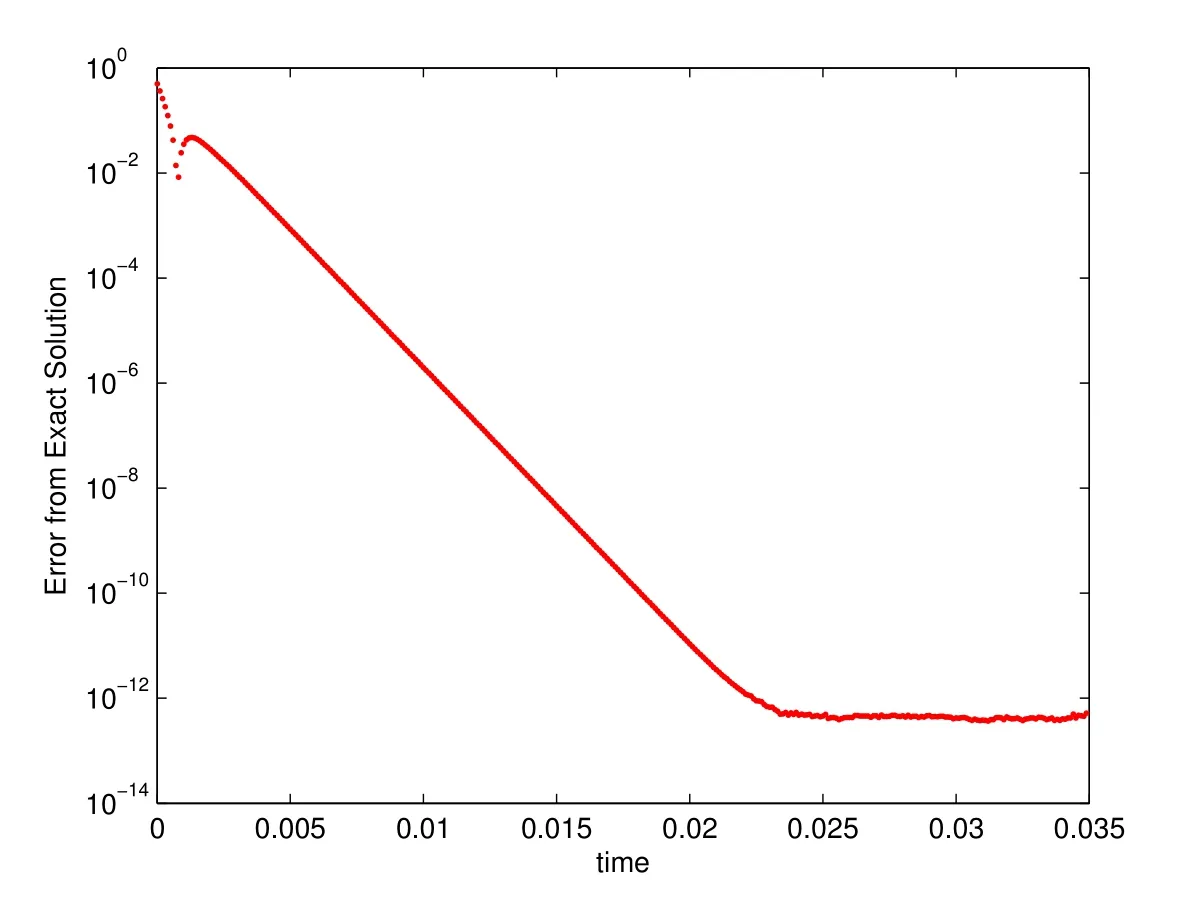
Figure 4:Exact error in biofilm-free 2D simulation withThe solution is compared to the exact solution,equation(28),using a maximum norm.
4.3.1Multigrid performance
Next,we provide numerical evidence that the multigrid technique convergences optimally to the solutions of Equations(21)and(26).We define awork unitas the cost of performing one relaxation on the finest grid(see Briggs,Henson,and McCormick(2000)).In Figure 5(a),we depict(for the pressure computation)the work units required to reach the minimum residual error as a function of allowed levels in the multigrid.This result shows that the number of work units required decreases significantly with each added multigrid level.This means that the multigrid method correctly accelerates the convergence of our iterative method by doing computations on the coarser grids.For example,with just one allowed level of multigrid,the relaxation uses only the finest resolution grid and requires about 105work units,whereas with 6 multigrid levels we only require about 102work units to achieve the same error.Note that there is no reduction in the number of required work units with the addition of a 7thlevel in the multigrid,so we use at most 6 levels in our 2D solvers.The data in this plot was obtained using our 2D simulation with a mushroom shaped biofilm similar to those shown in§5.2.
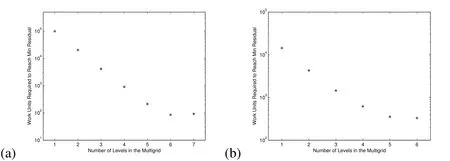
Figure 5:Decrease in work units required to reach the minimum residual error as the number of multigrid levels is increased in the(a)2D simulations,(b)and 3D simulations.
4.3.2Empirical Estimate of Convergence Rate in Time
Similar to the development in Mori and Peskin(2008),we define a measure of error by

which is the error difference at timet=Tin a computed quantity,q,using a temporal refinement of a half timestep.Then,anempirical estimatefor the convergence rate is calculated using

We compute the approximate convergence rate in time using theE2andE∞errors in the Eulerian variable,u,and in the Lagrangian variable,X.We simulate untilt=T=0.01s using temporal step sizes that ranged from∆t=1/5000to∆t=1/80000,decreasing by a factor of 2 at each level.The Eulerian grid is discretized with a step size ofh=1/256.
The empirical convergence rates from our temporal refinement are provided in Table 1.The immersed boundary method,as we have implemented it,is formally second-order in space and first order in time,but,for problems with sharp interfaces that do not have smooth solutions,it is limited to first-order accuracy in space and time.Thus for our problem we expect only first order accuracy.The convergence rates in time given in Table 1 show first-order convergence in time as is expected.In Figure 6(a),we depict the exact values ofEp(q(T);∆t)forq=X andq=u.We show log2in thexandyaxes so that the empirical convergence rates from Table 1 appear as the slope of the line segments.
4.3.3Empirical Estimate of Convergence Rate in Space
For this refinement study,we define a measure of error by

which is the error difference at timet=Tin a computed quantity,q,using a spatial refinement of a half.In this definition,is the restriction operator from a fine to a coarse grid.Then,an empirical estimate for the convergence rate is calculated using
We note that the estimates for convergence rates given by Equations(34)and(36)have a fairly simple derivation using a Taylor series expansion(see Ferziger and Peric(2002)or LeVeque(2007)).
In the spatial refinement analysis,we did not refine the Lagrangian grid with the Eulerian grid,so the same number of Lagrangian points were present in all of the simulations.In addition,full weighting restriction is used in the definition of the error,Equation(35),for the error in u.We also used a fixed timestep of∆t=10−4untilt=T=0.01s for all of these simulations.The computed convergence rates from this refinement are provided in Table 2.The∞-norm convergence rates given in Table 2 show greater than first-order convergence in space for the error in the Lagrangian variable X and in the Eulerian variable u.The seemingly large convergence rates for the lower resolution gridscan be explained by the fact that usingin the Dirac delta approximations does not allow the Lagrangian forces to be adequately represented in the Eulerian grid.This leads to larger errors in the coarse-grid simulations.Therefore,the best estimates for the convergence rates are the ones using the three resolutions all obeyingω>hgiven in the 4thand 7thcolumns of Table 2.In Figure 6(b),we depict the exact values ofWe show log2in thexandyaxes so that the empirical convergence rates from Table 2 appear as the slope of the line segments.We discuss possibilities for improvement in the convergence rates later in the conclusion sections.
We also used a grid refinement analysis to find the empirical convergence rate with spatial refinement when the density of the biofilm is two times that of the surrounding fluid.This analysis was done to show that the first order convergence rate is maintained with the increased density in the biofilms.The results of this convergence analysis are shown in Table 3 and Figure 6(c).
Finally,we compute the empirical convergence rates for our 2D simulation with variable viscosity.In this convergence study,(table 4 and figure 6(d))we use a non-dimensionalized value of biofilm viscosity ofµmax=500,which means that the viscosity at the location of a Lagrangian node is 500 times that of the surrounding fluid.First-order convergence in space is maintained,even with this very large biofilm viscosity.
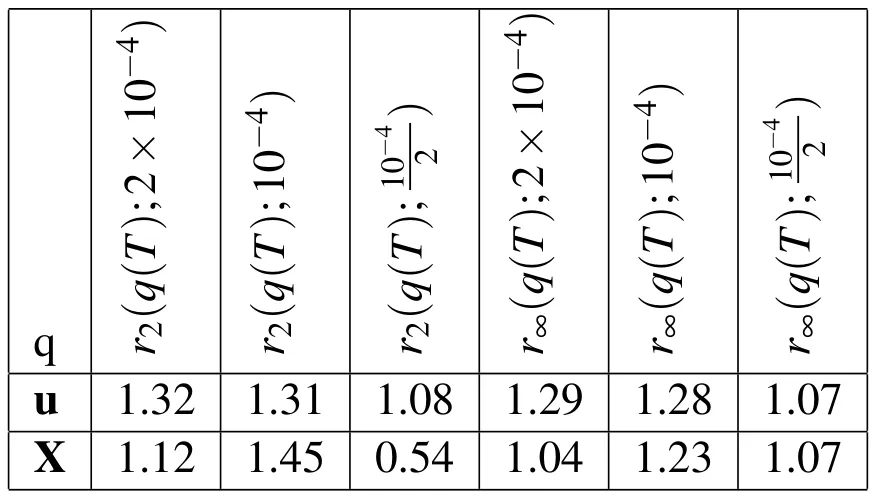
Table 1:Empirical convergence rates with temporal refinement.rp(q(T);dt)is the convergence rate in the variable,q,at t=T using the p-norm and the three time steps dt,dt/2,dt/4.
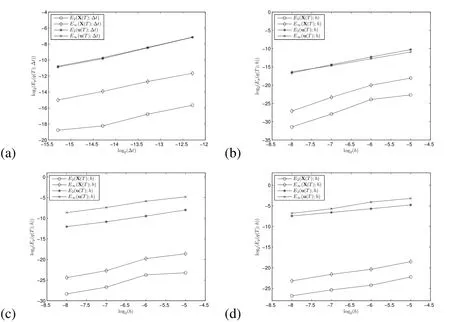
Figure 6:Empirical error estimates with(a)temporal refinement:Ep(q(T);∆t)is the p-norm of the error as defined by equation(33),(b)spatial refinement with constant density and viscosity:Ep(q(T);h)is the p-norm of the error as defined by equation(35),(c)spatial refinement and increased biofilm density,(d)spatial refinement and increased biofilm viscosity.In all plots,we show log2in the x and y axes so that the empirical convergence rate appears as the slope of the line segments.
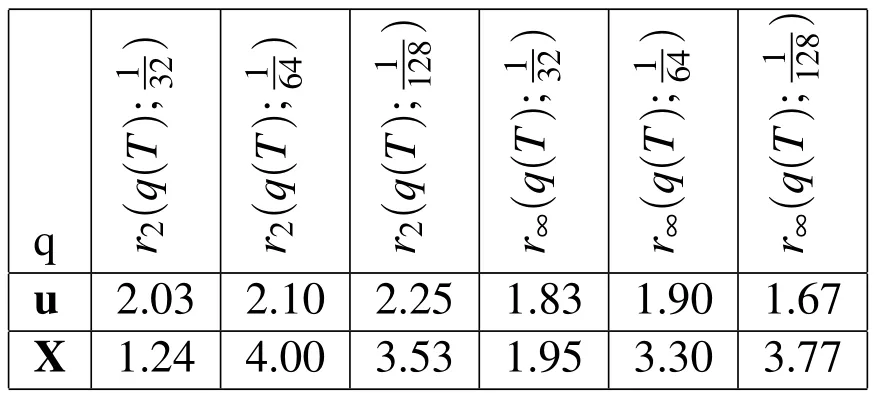
Table 2:Empirical convergence rates with spatial refinement.rp(q(T);h)is the convergence rate in the variable,q,att=T using the p-norm and the three Eulerian step sizes h,h/2,h/4.
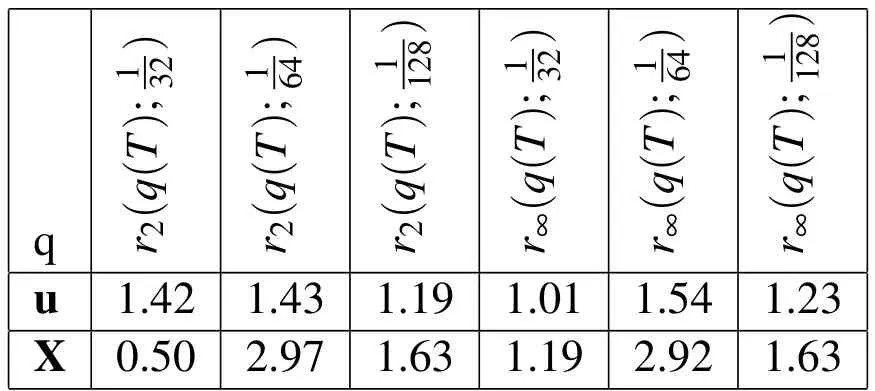
Table 3:Empirical convergence rates with spatial refinement and increased biofilm density.rp(q(T);h)is the convergence rate in the variable,q,at t=T using the p-norm and the three Eulerian step sizes h,h/2,h/4.In this experiment,the density of the biofilm is double that of the surrounding fluid.
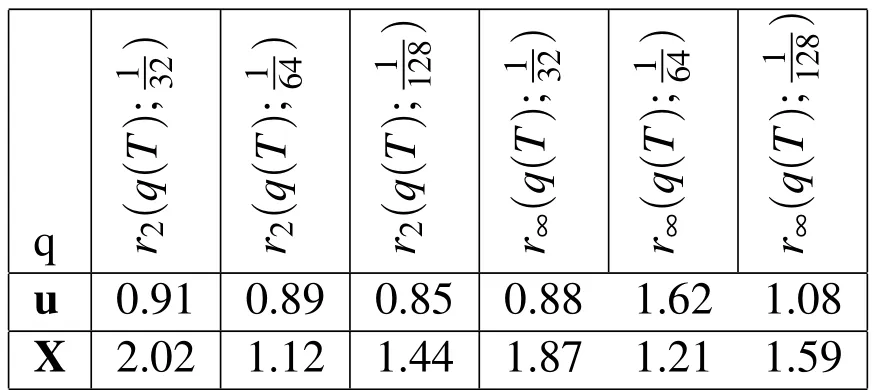
Table 4:Empirical convergence rates with spatial refinement and increased biofilm viscosity.rp(q(T);h)is the convergence rate in the variable,q,at t=T using the p-norm and the three Eulerian step sizes h,h/2,h/4.In this experiment the viscosity of the biofilm is 500 times that of the surrounding fluid.
4.3.4Time-Step Stability Restrictions
Finally,we investigated the stability of the method computationally as it depends on the spatial and temporal refinement and the stiffness of the springs.Analytically,stability applies to a numerical scheme and not to a computational run,but here we follow Mori and Peskin(2008)and give a simple definition of the stability for each computational run.Using the square of the 2-norm defined by equation(32)on u(i.e.kuk2p)gives a value which is proportional to the kinetic energy in the system.We call the simulationstableif magnitude of the total velocity(as measured by the total kinetic energy)does not have a time of extreme growth during the simulation.Moreover,this kinetic energy should remain relatively close to the value of the total kinetic energy in the case of no biofilm.Using this definition of stability,we found,through experimentation with many combinations ofh,∆t,andFmax,that we have timestep restrictions that scale with the mesh-width,h,and with the maximum Lagrangian force,Fmax.The restrictions are approximately given by

whereC1andC2are positive proportionality constants.Specific values ofC1andC2change depending on the parameters of the simulation.In future simulations,we hope to avoid these timestep restrictions by using an implicit or semi-implicit method as is done in Mori and Peskin(2008)and Newren,Fogelson,Guy,and Kirby(2007).All of the simulations shown in this work and used in the convergence testing used time-steps satisfying these two restrictions.
4.4 Three-Dimensional Validation
In this subsection,we provide some numerical evidence validating the 3D simulations.We first validate in the absence of a biofilm using the exact laminar flow solution.Then,we validate the multigrid method in the presence of a biofilm and,finally,we provide the empirical convergence rates for the simulation in the presence of a biofilm.
We first tested the rate of convergence of our method on the laminar flow case without the interference of a biofilm.To illustrate the convergence rate in the absence of a biofilm,we started with an initial velocity profile that is one-half of that of the laminar flow velocity profile,given by Equation(30).We ran the simulation enough timesteps until the approximate solution converged,with only discretization error remaining,to the exact solution for six spatial step sizes,h=We computed the discretization error(using the exact laminar solution,Equation(30),for computations)for each of the step sizes and found that the error isO(h2).This can be seen in Figure 7,where on the vertical axis we have the log2of the error so that the convergence rate appears as the slope in the plot.
Next,in Figure 5(b),we depict(for the pressure computation)the work units required to reach the minimum residual error as a function of allowed levels in the multigrid approach.This again implies that the multigrid method correctly accelerates the convergence of our iterative method for the 3D simulations with a biofilm.Note that there is only a slight reduction in the number of required work units with the addition of a 6thlevel in the multigrid,and we saw no reduction with 7 levels,so we use at most 6 levels in our 3D solvers.
Finally,as was done for the 2D case in§4.3.3,we compute the empirical convergence rates for our 3D simulation in the presence of the biofilm shown in Figure 3(b)with all of the same fluid parameters used in the 2D analysis.Using thepnorms defined above,we can compute the convergence rates using Equations(34)and(36)(see Figure 8(a)and Table 5).For the temporal convergence analysis,we usedThis analysis resulted in first-order convergence in all measures exceptrp(q(T);∆t)in which it has an average convergence rate of about 0.6.Next,we found empirical convergence rates for spatial refinement(see Table 6 and Figure 8(b)).As expected,we observe a greater than first-order convergence rate in both the Eulerian velocity,u,and the Lagrangian position,X.Next,we conducted a spatial refinement analysis with a biofilm that has double the density of the surrounding fluid(see Table 7 and Figure 8(c)).Finally,we did the spatial refinement study for our simulations withµmax=500,and again achieved first-order spatial convergence(see Table 8 and Figure 8(d)).
This concludes our validation section,and we now present the results of our numerical simulations.

Table 5:Empirical convergence rates in the 3D simulations with temporal refinement are shown for u and X.rp(q(T);∆t)is the convergence rate in the variable,q,at t=T using the p-norm and the three Eulerian step sizes∆t,∆t/2,∆t/4.
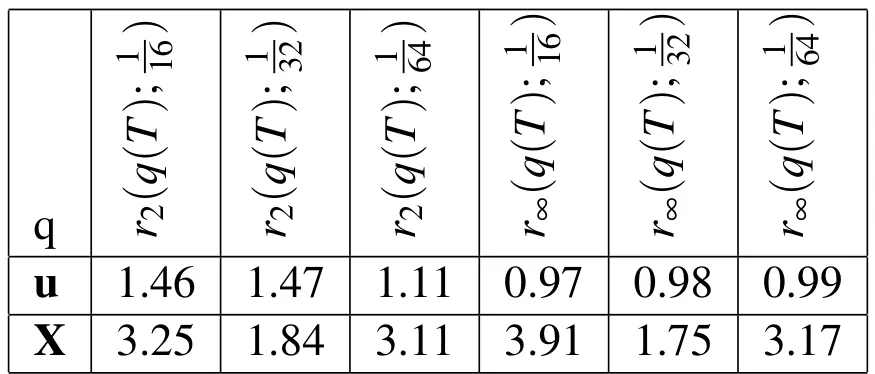
Table 6:Empirical convergence rates in the 3D simulations with spatial refinement are shown for u and X.rp(q(T);h)is the convergence rate in the variable,q,at t=T using the p-norm and the three Eulerian step sizes h,h/2,h/4.
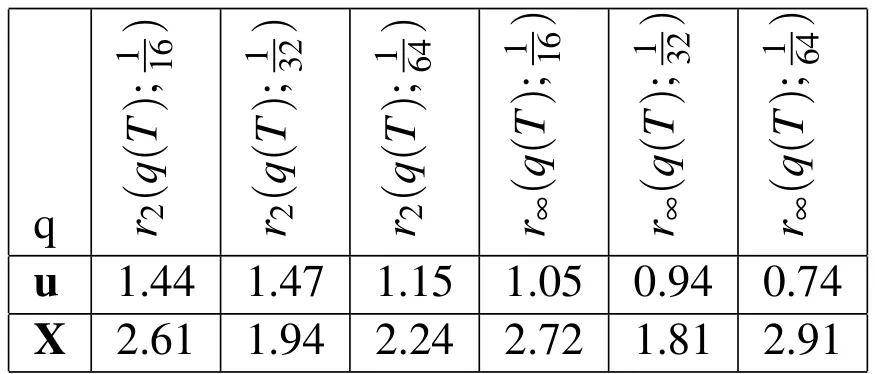
Table 7:Empirical convergence rates with 3D spatial refinement and increased biofilm density.rp(q(T);h)is the convergence rate in the variable,q,at t=T using the p-norm and the three Eulerian step sizes h,h/2,h/4.In this experiment,the density of the biofilm is double that of the surrounding fluid.
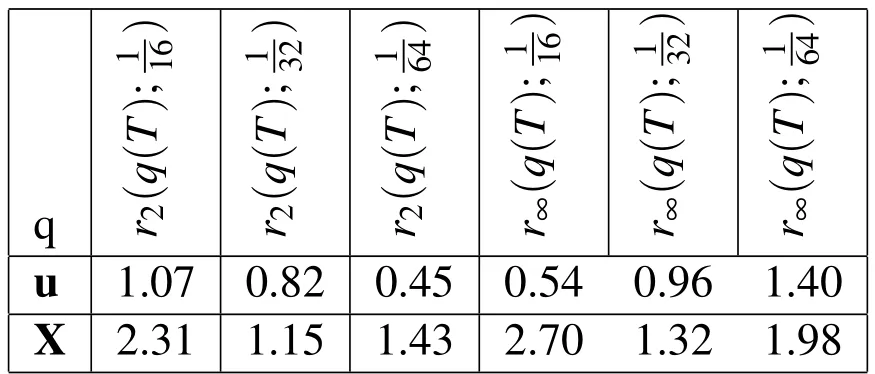
Table 8:Empirical convergence rates with 3D spatial refinement and increased biofilm viscosity.rp(q(T);h)is the convergence rate in the variable,q,at t=T using the p-norm and the three Eulerian step sizes h,h/2,h/4.In this experiment,the viscosity of the biofilm is 500 times that of the surrounding fluid.
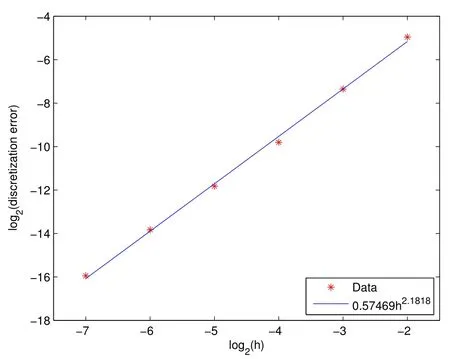
Figure 7:We show the convergence rate in the laminar flow case.These points are discretization errors for each of the spatial step sizes

Figure 8:Empirical errors in the 3D simulations with(a)temporal refinement:Ep(q(T);∆t)is the p-norm of the error as defined by Equation(33),(b)spatial refinement with constant density and viscosity:Ep(q(T);h)is the p-norm of the error as defined by Equation(35),(c)spatial refinement and increased biofilm density,(d)spatial refinement and increased biofilm viscosity.We show log2in the x and y axes so that the empirical convergence rate appears as the slope of the line segments.
5 Simulations Results
In this section,we present the results of our numerical simulations.First,we briefly discuss the reality of elastic forces in biofilms.Then we provide 2D results in§5.2 and 3D results in§5.3.
5.1 Discussion of Elastic Maximum Force,Fmax
We now provide a brief discussion of the physical reality of the values ofFmaxused in our simulations.Thecohesive strength6The cohesive strength is a measure of the forces that interconnect the biofilm’s cells.in biofilms has been found experimentally to be highly heterogeneous,with repeated experimental measurements on the same biofilm yielding vastly different strength measurements.For example,49 cohesive strength measurements taken on only two samples ofStaphylococcus epidermidisyielded measurements between 61-5182 Pa(Aggarwal,Poppele,and Hozalski(2010)).These biofilms were grown on a 22mm diameter disc rotating at 75rot/minso the fastest speed,∼86mm/s,was at the perimeter of the disc(i.e.very slow flow growth conditions).Theadhesive7The adhesive strength is a measure of the forces that connect a biofilm to the surface.and cohesive strengths have also been shown to vary significantly with changes in growth conditions such as flow rate and nutrient concentration.Changes in these growth conditions influence the amount of ECM production in the biofilm as well as the compactness of the biofilm,which has a direct effect on its strengths(Chen,Zhang,and Bott(2005);Ohashi and Harada(1996);Chen,Zhang,and Bott(1998)).We note here that the required values we find forFmaxfor the biofilms to remain attached in our 2D and 3D simulations are consistent with the cohesive strength measurements provided in Aggarwal,Poppele,and Hozalski(2010).Since the diameter ofStaphylococcus epidermidisis about 1µm,in 3D,we multiply the cohesive strengths by 1µm2to get an approximation for the range of forces on the surface area of one cell.Using the range of 61-5182 Pa yields a range of forces from 6.1×10⁻¹¹N to 5.18×10⁻⁹N.In 2D,we multiply the cohesive strengths by the cell diameter to get a rough approximation for the range of forces on the surface perimeter surrounding one cell.Using the range of 61-5182 Pa yields a range of forces from 6.1×10⁻⁵N to 5.18×10⁻³N.Our values forFmaxare at the low end of these ranges.The actual strength of the biofilm is most likely larger than ourFmaxvalues since the positional data was from a biofilm that was not fragmenting in the flow conditions in which it was grown,and we used the same flow conditions in our simulations.Thus,in order to see detachment under these flow conditions,we had to lower the value ofFmax.We could alternatively increase the flow rate to necessitate a largerFmaxrequirement to avoid detachment.One eventual goal of this work is that,if the approximate value ofFmaxis known for a particular type of biofilm,then our simulations can be used to predict the flow rates required to break different shaped biofilms.
5.2 Two-Dimensional Simulations
In this section, we provide results from our 2D simulations, which represent a crosssection of a biofilm attached to the inside of a tube and subjected to fluid flow in a computational domain of 150µm by 50µm.The parameters for our simulations are given in Table 9.
In all simulations,we implement a breaking condition on the springs of two times the rest length.The initial configuration for the biofilm in these simulations is shown in Figure 3.The spring connections between Lagrangian nodes are putin place at the beginning of the simulation with every node connected to every other node less thandcaway(the reason for this connection distance is given above in §4.2).The mushroom shaped biofilm has a height of about 8.5µm and width of about 8µm(width of about 2µm at the thinnest part).We use a nondimensionalizedto match the radius ofStaphylococcus epidermidisand choosein all of the simulations shown,so thatω>h.
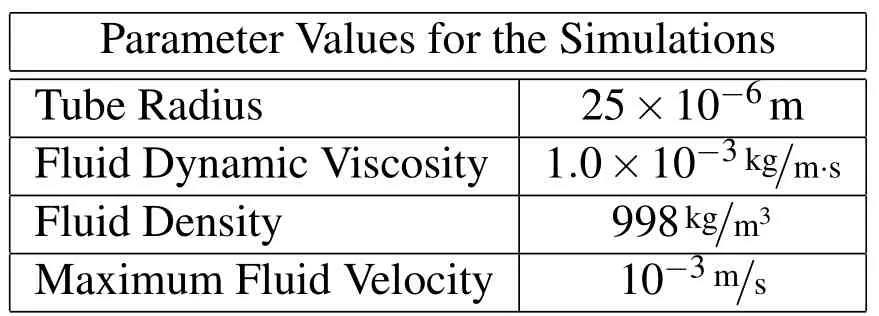
Table 9:The values of parameters used in the 2D simulations.
In the first simulation,the maximum spring force,Fmax,is set to 5.00×10⁻⁷N,and the results are provided in Figure 9.The biofilm bends over in the flow,and the connections in the thin part of the biofilm break as they stretch too far.The blue streamlines in(b),(c),and(d)of Figure 9 and in all of the other 2D simulation plots follow the trajectories given by the velocity fi eld,u.
We point out that the values of the spring constants are well within physically realistic values(see the discussion in§5.1),although,in this work,we have chosen these values for the qualities they give to the simulations rather than experimental evidence of the elastic strength of biofilms.For example,in these 2D simulations,we investigated several simulation runs with various spring constants until we obtained those that exhibited the above described behaviors.
Next,we conducted a simulation of the same mushroom shaped biofilm with all of the same parameter values,but we gave the biofilm additional density ofρb=compared to the ambient fluid.We know this density is larger than what is seen in actual biofilms(at most 20%greater density than water(Masuda,Watanabe,and Ishiguro(1991);Ro and Neethling(1991))),but we chose it to show an exaggerated example of increasing the biofilm density.These result is provided in Figure 10(b)and illustrates that the added density essentially adds momentum to the biofilm.This additional momentum causes the biofilm to curl over into the slower flow region and thus prevents detachment.
Finally,we conducted a simulation of the same mushroom shaped biofilm with all of the same parameter values as the first simulation,but we increasedFmaxto 5.00×10⁻⁶N.The effect of these stronger springs is that the thin part of the biofilm does not stretch enough to break the connections.The result is depicted in Figure(10)(c).We can see from these simulations that either increasing the biofilm density or strengthening the springs causes similar results,but,with the increased density,the biofilm has more of a curling action.
In the next simulation,we use all of the same parameters described in the first simulation,with the addition that the biofilm has a 500×larger viscosity than the surrounding fluid,soComparing simulation results illustrated in Figure 10(d)and Figure 10(a),which show the biofilm configurations just before detachment,we observe a longer time until detachment in the high viscosity case.This is the expected outcome of increasing the viscosity in the biofilm.We note here that we usedin the equation forµ(x)in Equation(20)because we wanted to spread additional viscosity over the same region that the elastic forces are spread to.We achieve an even longer detachment time in the simulation by widening the influence of additional viscosity by using,for example
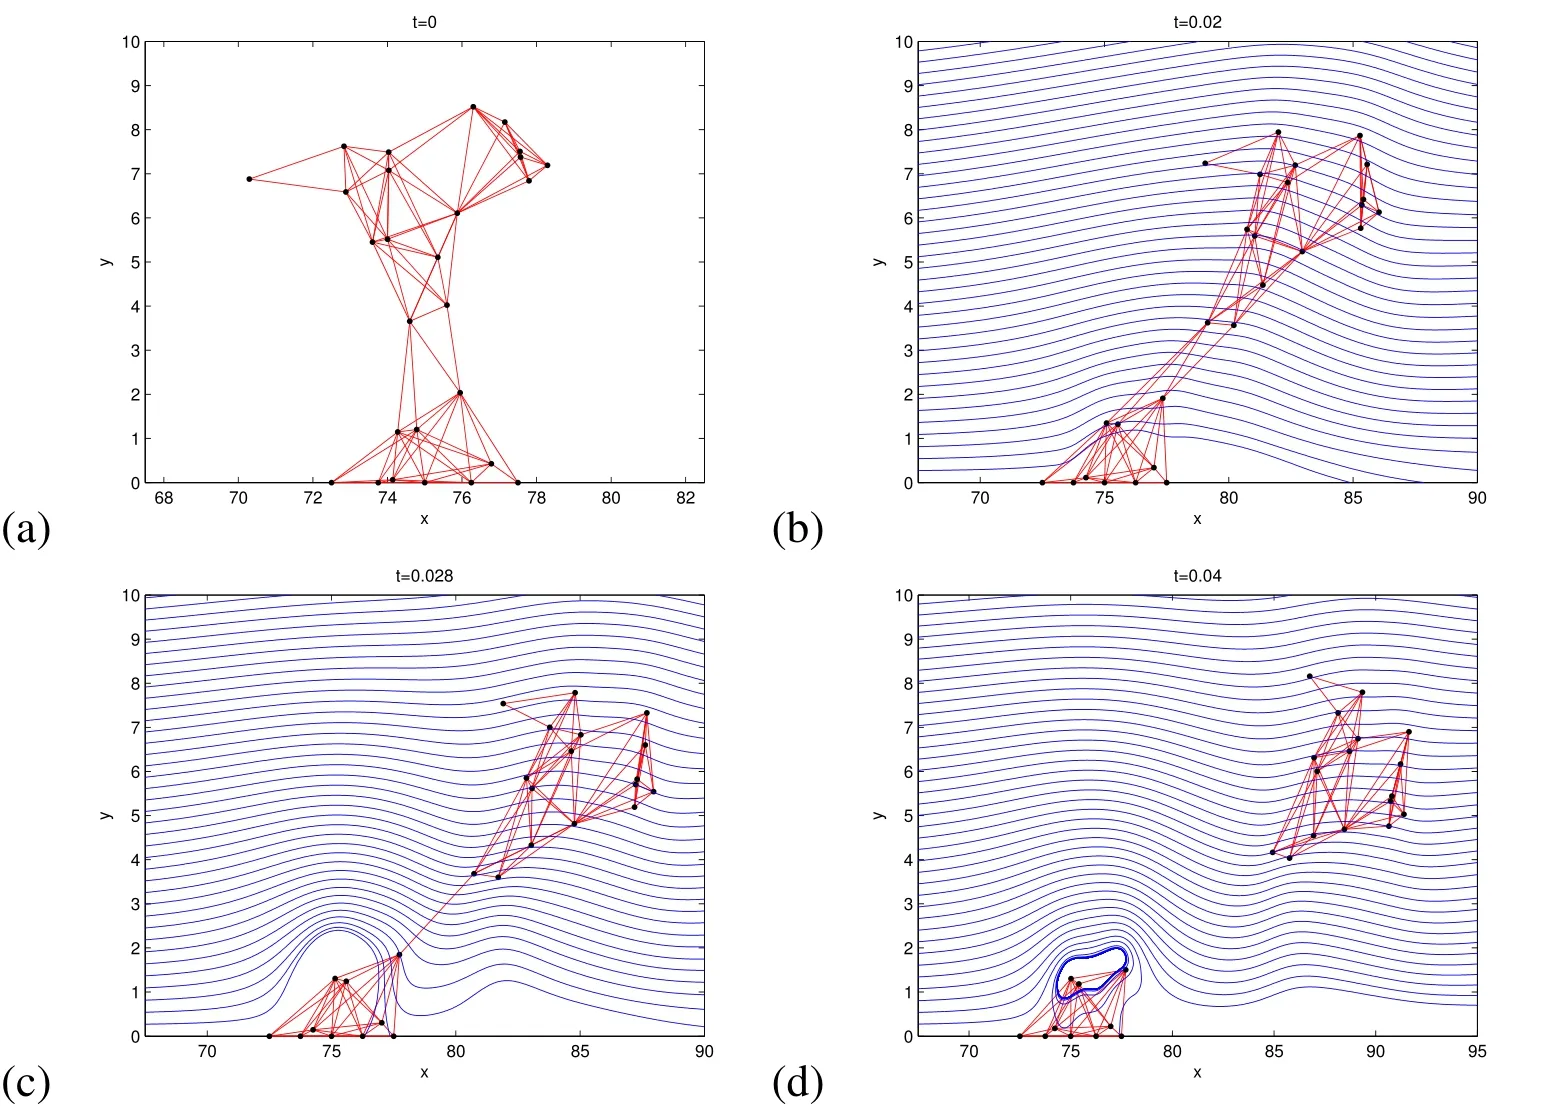
Figure 9:2D Simulation of a mushroom shaped biofilm with the same density as the surrounding fluid.Time t is in seconds and the distance is in microns.In this simulation,ρ0=998kg/m3,ρb=0,Fmax=5.00×10−7N.The blue streamlines follow the velocity field.In this simulation,the top of the biofilm stretches in the flow,and the top breaks off as the connections in the the middle separate as they exceed the breaking criteria of twice the rest length.As expected in a laminar shear flow,the broken piece then tumbles end over end through the flow.
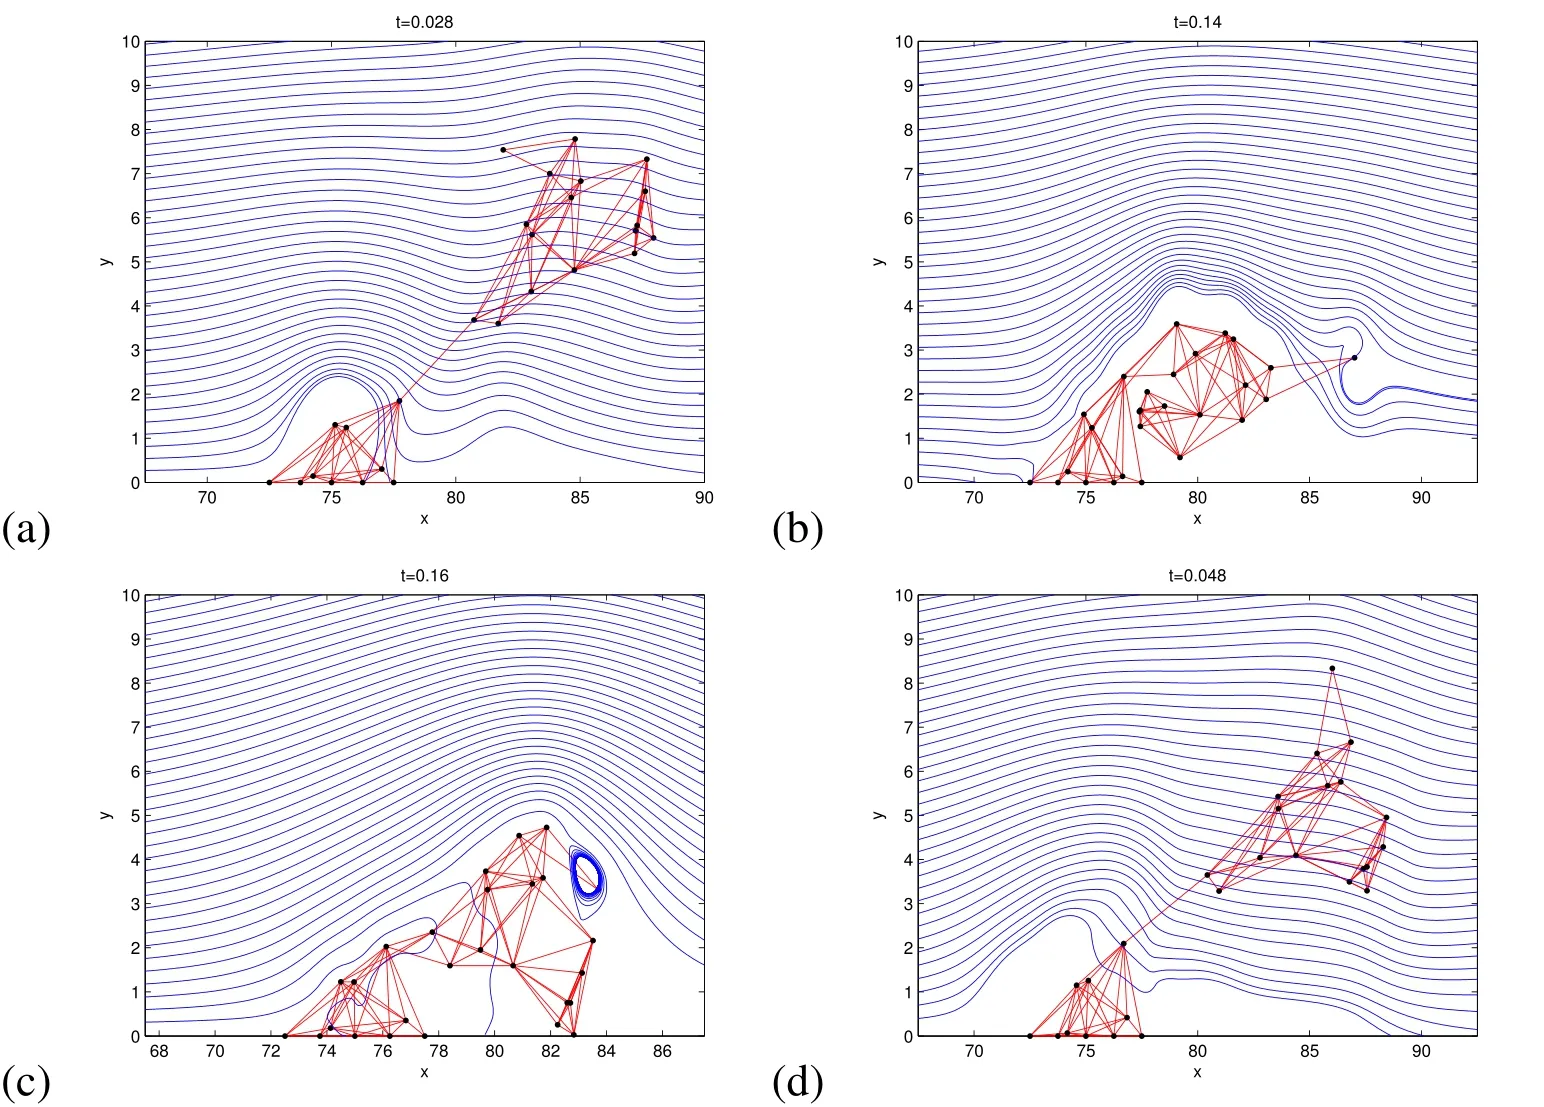
Figure 10:Snapshots in time(t in seconds)of cell distributions resulting from 2D simulation of mushroom shaped biofilm with four different property configurations.In(a),the biofilm has the same density and viscosity as the surrounding fluid(just before detachment),(b)increased Fmax,(c)density twice as large as the surrounding fluid density,and(d)viscosity is 500×that of the surrounding fluid(just before detachment).The blue streamlines follow the velocity field.
5.3 Three-Dimensional Simulations
In this section,we provide results from our 3D simulations,which use the same parameter values as in the two dimensional simulations(see Table 9).The difference is that the simulation in 3D represents flow through a square shaped tube with a side length of 50µm.Note that these 3D simulations reproduce qualitatively the same results as in the 2D ones.Our 3D simulations were run on a 50×50×150µm computational domain.We simulate on a mushroom shaped biofilm with a height of about 8.5µm and a diameter of about 7.5µm.This shape is carved from the same set of data points described in§4.2.The spring connections between Lagrangian nodes are put in place at the beginning of the simulation,with every node connected to every other node less thandc=3µm away.Note that,for the 3D simulations,we increaseddcslightly to establish enough connections in the biofilm.We again useto match the radius ofStaphylococcus epidermidisand choosein all of the simulations shown,so thatω>h.In the first simulation,the maximum spring force,Fmax,is set to 1.25×10⁻¹²N.We again chose the value of these spring constants in order to illustrate specific behaviors.The results of the first simulation are shown in§11.The mushroom shaped biofilm bends over and stretches in the flow.The connections in the midsection of the biofilm exceed their breaking length and the top of the biofilm breaks off into the flow.Next,we ran a simulation of the same mushroom shaped biofilm,but we addedadditional density to the biofilm compared to the surrounding fluid.The final result is provided in Figure 12(b)and illustrates that the added density increases the momentum of the biofilm.This allows for the mushroom to curl over into the flow and increases the time until detachment.We also ran a simulation of the same mushroom shaped biofilm,but we increasedFmaxto 1×10⁻¹¹N and kept the biofilm density the same as the surrounding fluid.The result is provided in Figure 12(c).The effect of these stronger springs is that the thin part of the biofilm does not stretch enough to break the connections.We can see from these simulations that either increasing the biofilm density or strengthening the springs causes similar results,but with the increased density the biofilm just curls over.
Finally,we provide one 3D simulation to show that,with increased biofilm viscosity,they produce qualitatively the same behavior as in the 2D case. In the simulation result shown in Figure 12(d),we use the same parameters as the first 3D simulation,but we use a viscosity in the biofilm that is a factor of 500 times that of the surrounding fluid.Just as in the 2D case,this results in a longer time until detachment(compare time in Figure 12(a)and Figure 12(d)).
For ease of comparison,we now provide the figures in the order in which they were discussed in this section.
6 Realistically Shaped Biofilm Simulation
The biofilm shapes used in §5.2 and §5.3 were intentionally carved from the data in a way to provide a weak point at which it would be most likely to break.This was done in order to verify the expected effects of varying the different parameters in the simulation.In this section,we provide results of the simulation on a biofilm
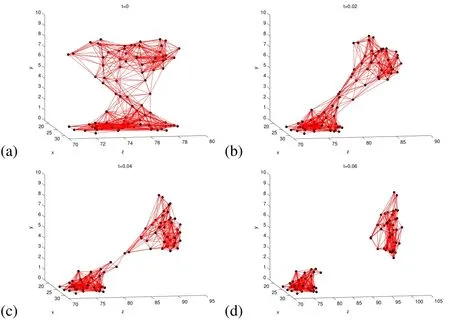
Figure 11:Full 3D simulation of a mushroom shaped biofilm with the same density as the surrounding fluid.The time t is in seconds and the distance is in microns.As the biofilm stretches in the flow,the strain in the midsection exceeds the breaking length of the connections,and the top of the biofilm breaks off into the flow.Then the broken piece tumbles end over end through the flow,and the base retracts back.In this simulation,ρ0=998kg/m3,ρb=0,Fmax=1.25×10−12N.
that is a subset of points taken directly from the real biofilm data set.In reality,this biofilm was surrounded by more cells on all sides,which would change the behavior of the fluid structure interactions.However,we use this to show the results of the simulation on arealtop heavy biofilm shape that was grown in a lab.TheStaphylococcus epidermidisdata set discussed in§4.2 was supplied as positions in three 30×30×15µm sub-domains of a biofilm.
In Figure 13(a),we show the biofilm taken from a 2×30×15µm subset of one data set that has been connected withdc=2.8µm.For the 2D representation,we collapse the 2µm dimension,leaving only the(x,y)coordinates of the data.The most interesting feature of this biofilm is that in the region fromx=60µm tox=67µm the biofilm exhibits a mushroom shape similar to the one we used in§5.2.
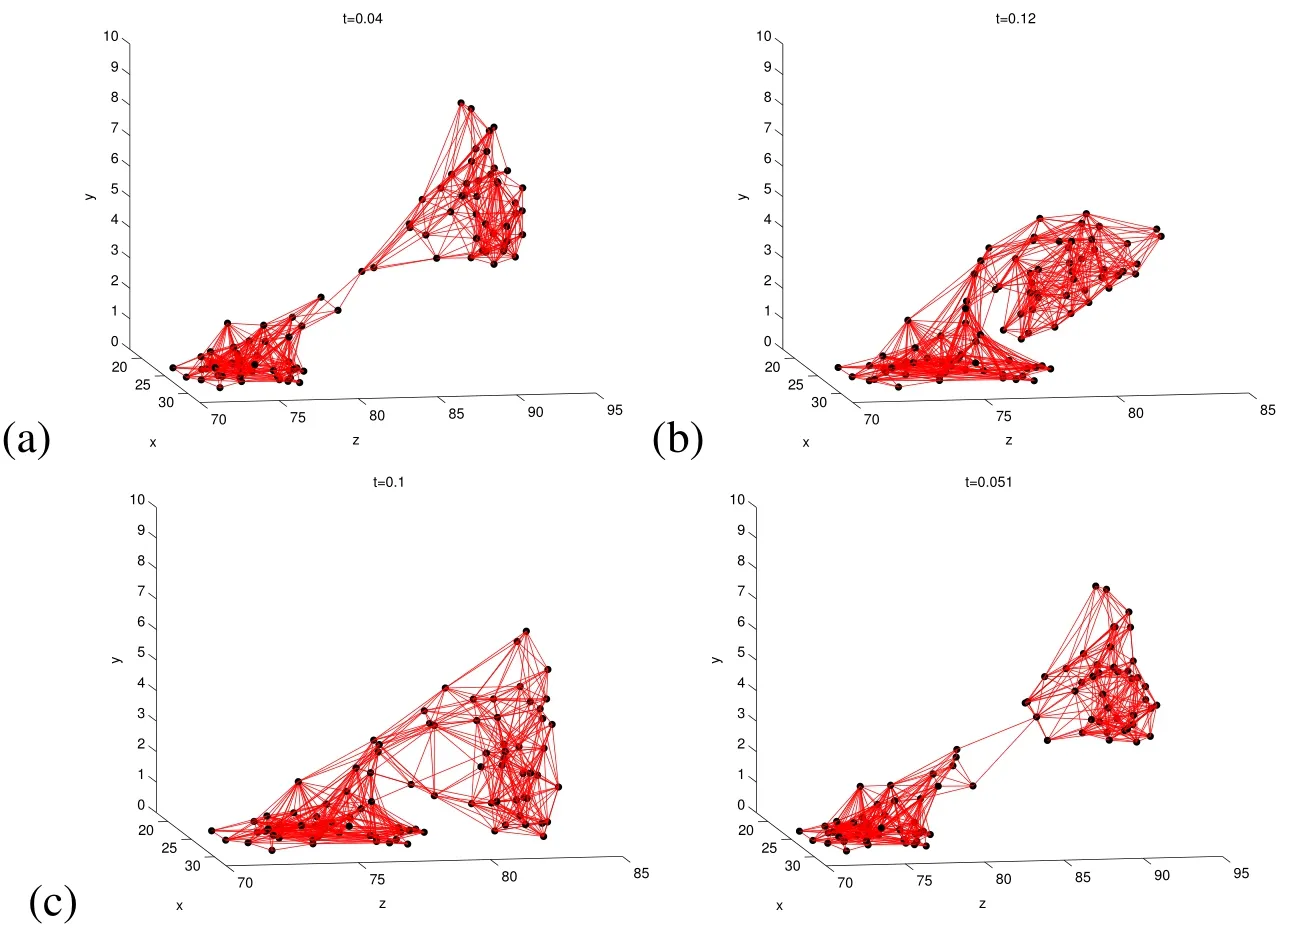
Figure 12:Snapshots in time(t in seconds)of cell distributions resulting from 3D simulation of mushroom shaped biofilm with four different property configurations.In(a),the biofilm has the same density and viscosity as the surrounding fluid(just before detachment),(b)increased Fmax,(c)density twice as large as the surrounding fluid density,and(d)viscosity is 500×that of the surrounding fluid(just before detachment).
We now provide two simulation results on this realistically shaped biofilm.The first simulation(see Figure 13)uses a biofilm density equal to the surrounding fluid and usesFmax=7.5×10⁻⁷N.In this simulation,the mushroom shaped part pushes against the biofilm behind it,then rolls over the top of it as it breaks from its base,forming a long streamer-like biofilm.8Streamers are a natural occurrence in biofilms.Examples in Klapper,Rupp,Cargo,Purvedorj,and Stoodley(2002);Rusconi,Lecuyer,Guglielmini,and Stone(2010).Then the streamer breaks completely off leaving two distinct attached structures.In the second simulation,we use a biofilm density ofρb=120kg/m3and kept everything else the same.Although the density is only 12%larger than the surrounding fluid,it has a large impact on the outcome of the simulation.In this simulation,the effect of the increased density of the biofilm is a longer breaking time(compare time in Figure 14(b)and Figure 14(c)).This occurs since the increased momentum causes the first detached piece to continue further down,pulling the whole streamer lower(compare the height of the detaching pieces).The fluid forces continue to push the streamer until it breaks into the flow.
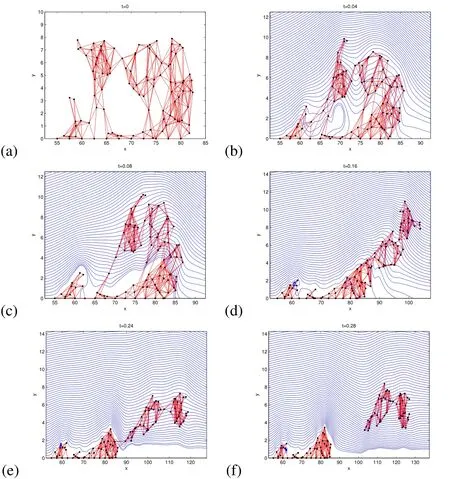
Figure 13:Simulation on a 2D slice of a real biofilm with the same density as the surrounding fluid.Time t is in seconds and the distance is in microns.In this simulation,ρ0=998kg/m3,ρb=0,Fmax=7.5×10−7N.The blue streamlines follow the velocity field.In this simulation,the mushroom shaped part pushes against the biofilm behind it(b),then rolls over the top of it as it breaks from its base(d).Then a large portion of the biofilm breaks completely off leaving 2 distinct bases(f).
In the final simulation,we show that increasing the viscosity in the “realistically”shaped biofilm has larger impact on the results than in the case of the previous standalone mushroom shaped biofilm.In this simulation,we increased the biofilm viscosity to 50×the surrounding fluid withAlthough this is 10×less than in the previous variable viscosity simulation,it has a larger impact on this wider biofilm,doubling the detachment time from the case of constant viscosity(compare Figure 14(b)and Figure 14(d)).
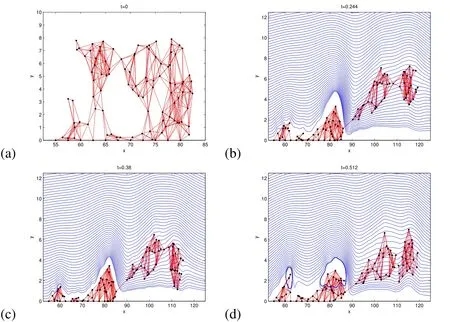
Figure 14:Snapshots in time(t in seconds)showing the detachment time and configuration at detachment of a 2D slice of a real biofilm with initial configuration in(a).In(b),biofilm has the same density and viscosity as the surrounding fluid,(c)12%larger density,and(d)50×larger viscosity than the surrounding fluid.The blue streamlines follow the velocity field.
6.1 Numerical Concerns
We note that there remains one pressing concern that will be the focus of our future work.When adapting the multigrid scheme for large values ofµmax,we do not achieve expected speed ups in convergence rates.We use restriction to transfer the viscosity to the coarse grids works for small values ofµmax,but we found that,for larger values ofµmax,this technique leads to a very slowly converging solver.Intriguingly,we found that using our restriction operator to define the coarse grid viscous values and then scaling the values leads to faster convergence.Specifically,we define the coarse grid viscosity as

wherelhdenotes the grid whose mesh width isltimesh(l=2,4,8,16,...),is the scaling which maximizes the convergence of the solver,andµh(x)is defined by Equation(20).Through repeated experimentation,we found that usingresulted in the fastest convergence rates in the 2D and 3D simulations.This approach is admittedly ad-hoc.However,the consistency with which we achieved dramatic speed ups strongly suggests the existence of an underlying mathematical principle to be discovered.
For our future work,the highest priority is to resolve the problem of slow convergence for largeµmax.There are three approaches that may lead to resolving this issue.The first would be to mathematically derive optimal values for the scaling parameters,γlh.Second,we could ensure that our discretization satisfies the Galerkin condition.Lastly,and probably the best choice,would be to re-implement the geometric multigrid as an algebraic multigrid method(AMG,see Ch.8 of Briggs,Henson,and McCormick(2000)).
7 Conclusions
In this work we developed a simulation to model the flow-induced fragmentation of biofilms.In this simulation,we have provided a way to adjust the biofilm density and viscosity,which had not been addressed in previous IBM biofilm models.We also have control of the fluid flow rate,density,viscosity,and elastic forces within the biofilm.We used experimentally measured biofilm bacterial cell locations as initial positions for our Lagrangian nodes.This is dramatically different than the traditional IBM,in which methods usually refine the Lagrangian mesh along with the Eulerian mesh.We adapted the Dirac delta approximation to scale with the radius of the bacteria rather than with the mesh width.This implies that the information that transfers from the Lagrangian grid to the Eulerian grid(i.e.,density,viscosity,and elastic force)is spread over a set distance rather than scaling by the mesh width,h.This adapted Dirac Delta approximation improves our numerical convergence rates as well.
We used a projection method to split the incompressible Navier-Stokes equations to solve separately for an intermediate velocity and the pressure,and then used a Gauss-Seidel iterative method with multigrid to solve the resulting equations.Using an iterative solver,as opposed to a spectral method,to solve these systems was necessitated by the fact that biofilms have spatially varying density and viscosity.With this solver we achieved first order convergence in both space and time.
For the numerical simulations,we carved a mushroom shaped biofilm from the bacterial cell locations and ran simulations with varying parameters.We first ran the simulation on a simplistic shape in order to validate the effect of the various parameter changes on the outcome of the biofilm.By adjusting the maximum elastic force,Fmaxin the biofilm,we controlled the detachment phenomenon.We also showed that slight changes in the density of the biofilm has a large effect on the outcome of the simulation.This is an important conclusion as usually modelers ignore the differences in biofilm density.Finally,we showed that we can increase the detachment time in the simulations by increasing the viscosity of the biofilm.Finally,we ran simulations on more realistically shaped biofilms,which showed how a larger biofilm with different shapes will react to fluid flow forces.Adjusting these parameters will be a necessary component when we attempt to match these simulations to experimental data.
8 Future Work
As mentioned in the introduction,this is the first of two articles which detail our investigation into modeling and simulating the response and fragmentation of a biofilm in shear flow.The second article(currently in preparation Stotsky et.al(2014))will involve using the results of our simulation to match biofilm rheological properties(such as those reported in Pavlovsky,Younger,and Solomon(2013)).Below we provide an overview of potential improvements,some of which will appear in the followup article and some which will be pursued in subsequent work.There are straightforward ways to include more biologically realistic terms to interpret biofilm internal stress dynamics,cell volume,and fragmentation dynamics.In its current form,our simulations can be used to make predictions in detachment times of biofilms,as well as general behavioral responses of biofilms to various flow conditions.We do plan to include the fact that bacterial cells displace fluid.While we have adapted the Dirac delta function approximation to transfer the cell parameters(F,ρ,µ)to the Eulerian grid,the current simulation does not actually assign a size to the cells.As a result,the cells are free to pass through each other.We first plan to alter the model for the bacterial cell so that it displaces fluid.An important step in this process will be to identify a collision detection strategy.We will base ours on some combination of potentials for electrostatic,steric,and Van der Waals forces.
Our current simulation also uses a spring-breaking criteria of double the rest length,and assumes that the bonds are linearly elastic until the breaking point.This is not an accurate assumption,as it is known that biofilms are composed of polymer based ECMs.These structures are linearly elastic for small strains and then experience plastic deformation(permanently altering the bonds in the ECM and thus the rest length)before finally fracturing.In the future,we will use biofilm yielding data from experiments such as Aggarwal,Poppele,and Hozalski(2010)to determine accurate approximations for yield points and fracture points in the biofilm.We plan to include plasticity into the simulations by changing the equations for stress,Equation(18),when the bond has been stretched beyond its yield point.
We also have several plans for improving our numerical method.Our current simulation is limited to first-order accuracy.Guided by the results in Brown,Cortez,and Minion(2001),we will derive the numerical boundary conditions for our projection method to ensure second order accuracy for both velocity and pressure computations.To improve the accuracy of the immersed boundary method,we could also adapt our modeling method to either an immersed interface method(Li and Ito(2006))in which we adapt the finite difference approximations close to the interface or a blob projection immersed boundary method as discussed in Cortez and Minion(2000)in order to obtain second-order spatial accuracy.Another limitation of our current numerical scheme is the time-step stability restrictions,which limit the size of the elastic forces between the cells.We plan to eliminate these restrictions altogether by changing to a semi-implicit or implicit method of transferring the data between the Eulerian and Lagrangian grids,as is shown in Newren,Fogelson,Guy,and Kirby(2007).
Finally,with large biofilm densities and viscosities,our multigrid method in its current formulation does not converge as fast as expected.We plan to fix this by appropriately adapting our implementation of the geometric multigrid(by satisfying the Galerkin condition)or by changing to an algebraic multigrid approach.
9 Acknowledgements
We thank Stephen McCormick for his advice concerning the multigrid method used in our simulations.We also thank Charles Peskin and Thomas Fai for insightful comments and discussions related to a previous draft of this work.
This work was supported in part by the National Science Foundation grants PHY-0940991 and PHY-0941227 and NIH-NIGMS grant GM081702.This work also utilized the Janus supercomputer, which is supported by the National Science Foundation(award number CNS-0821794),the University of Colorado Boulder,the University of Colorado Denver,and the National Center for Atmospheric Research.The Janus supercomputer is operated by the University of Colorado Boulder.
Aggarwal,S.;Poppele,E.H.;Hozalski,R.M.(2010):Development and testing of a novel microcantilever technique for measuring the cohesive strength of intact biofilms.Biotechnol.Bioeng.,vol.105,no.5,pp.924–34.
Alpkvist,E.;Klapper,I.(2007):Description of Mechanical Response Including Detachment Using a Novel Particle Method of Biofilm/Flow Interaction.Water Sci.Technol.,vol.55,no.8-9,pp.265–273.
Aravas,N.;Laspidou,C.S.(2008):On the calculation of the elastic modulus of a biofilm streamer.Biotechnol.Bioeng.,vol.101,no.1,pp.196–200.
Balestrino,D.;Ghigo,J.-M.;Charbonnel,N.;Haagensen,J.A.J.;Forestier,C.(2008): The characterization of functions involved in the establishment and maturation of Klebsiella pneumoniae in vitro biofilm reveals dual roles for surface exopolysaccharides.Environ.Microbiol.,vol.10,no.3,pp.685–701.
Briggs,W.L.;Henson,V.E.;McCormick,S.F.(2000):A Multigrid Tutorial.SIAM,Philadelphia,PA.
Brown,D.L.;Cortez,R.;Minion,M.L.(2001):Accurate Projection Methods for the Incompressible Navier-Stokes Equations.J.Comput.Phys.,vol.168,no.2,pp.464–499.
Chen,M.J.;Zhang,Z.;Bott,T.R.(1998):Direct measurement of the adhesive strength of biofilms in pipes by micromanipulation.Biotechnol.Tech.,vol.12,no.12,pp.875–880.
Chen,M.J.;Zhang,Z.;Bott,T.R.(2005):Effects of operating conditions on the adhesive strength ofPseudomonas fluorescensbiofilms in tubes.Colloids Surf.B.Biointerfaces,vol.43,no.2,pp.61–71.
Cortez,R.;Minion,M.(2000): The Blob Projection Method for Immersed Boundary Problems.J.Comput.Phys.,vol.161,no.2,pp.428–453.
Dillon,R.;Fauci,L.;Fogelson,A.;Gaver III,D.(1996): Modeling Biofilm Processes Using the Immersed Boundary Method.J.Comput.Phys.,vol.129,no.1,pp.57–73.
Ehret,A.E.;Böl,M.(2013):Modelling mechanical characteristics of microbial biofilms by network theory.J.R.Soc.Interface,vol.10,no.78.
Fai,T.G.;Griffith,B.E.;Mori,Y.;Peskin,C.S.(2013):Immersed Boundary Method for Variable Viscosity and Variable Density Problems Using Fast Constant-Coefficient Linear Solvers I:Numerical Method and Results.SIAM J.Sci.Comput.,vol.35,no.5,pp.B1132–B1161.
Fai,T.G.;Griffith,B.E.;Mori,Y.;Peskin,C.S.(2014):Immersed Boundary Method for Variable Viscosity and Variable Density Problems using Fast Constant-Coefficient Linear Solvers II:Theory.SIAM J.Sci.Comput.(to appear).
Ferziger,J.H.;Peric,M.(2002):Computational Methods for Fluid Dynamics.Springer,3rd edition.
Hammond,J.F.(2012):Analysis and Simulation of Partial Differential Equations in Mathematical Biology:Applications to Bacterial Biofilms and Fisher’s Equation.Phd,University of Colorado,2012.
Hammond,J.F.;Stewart,E.J.;Younger,J.G.;Solomon,M.J.;Bortz,D.M.(2013): Spatially Heterogeneous Biofilm Simulations using an Immersed Boundary Method with Lagrangian Nodes Defined by Bacterial Locations.http://arxiv.org/abs/1302.3663.
Huang,W.X.;Sung,H.J.(2009): An immersed boundary method for fluid flexible structure interaction.Comput.Methods Appl.Mech.Eng.,vol.198,no.33-36,pp.2650–2661.
Kissel,J.C.;McCarty,P.L.;Street,R.L.(1984): Numerical Simulation of Mixed-Culture Biofilm.J.Environ.Eng.,vol.110,no.2,pp.393–411.
Klapper,I.;Dockery,J.(2010):Mathematical Description of Microbial Biofilms.SIAM Rev.,vol.52,no.2,pp.221.
Klapper,I.;Rupp,C.J.;Cargo,R.;Purvedorj,B.;Stoodley,P.(2002):Viscoelastic fluid description of bacterial biofilm material properties.Biotechnol.Bioeng.,vol.80,no.3,pp.289–96.
Kreft,J.-U.;Booth,G.;Wimpenny,J.W.T.(1998): BacSim,a simulator for individual-based modelling of bacterial colony growth.Microbiology,vol.144,pp.3275–3287.
Kreft,J.-U.;Picioreanu,C.;Wimpenny,J.W.T.;van Loosdrecht,M.C.M.(2001): Individual-based modelling of biofilms.Microbiology,vol.147,no.Pt 11,pp.2897–2912.
Lau,P.C.Y.;Dutcher,J.R.;Beveridge,T.J.;Lam,J.S.(2009): Absolute quantitation of bacterial biofilm adhesion and viscoelasticity by microbead force spectroscopy.Biophys.J.,vol.96,no.7,pp.2935–48.
LeVeque,R.J.(2007):Finite Difference Methods for Ordinary and Partial Differential Equations:Steady-State and Time-Dependent Problems.SIAM,Philadelphia,PA.
Li,Z.;Ito,K.(2006):The Immersed Interface Method:Numerical Solutions of PDEs Involving Interfaces and Irregular Domains,volume 33 ofFrontiers in Applied Mathematics.SIAM,Philadelphia,PA.
Lim,S.;Peskin,C.S.(2012): Fluid-mechanical interaction of flexible bacterial flagella by the immersed boundary method.Phys.Rev.E,vol.85,no.3,pp.036307.
Luo,H.;Mittal,R.;Zheng,X.;Bielamowicz,S.a.;Walsh,R.J.;Hahn,J.K.(2008):An immersed-boundary method for flow-structure interaction in biological systems with application to phonation.J.Comput.Phys.,vol.227,no.22,pp.9303–9332.
Masuda,S.;Watanabe,Y.;Ishiguro,M.(1991):Biofilm properties and simultaneous nitrification and denitrification in aerobic rotating biological contactors.Water Sci.Technol.,vol.23,pp.1355–1363.
Mori,Y.;Peskin,C.S.(2008):Implicit second-order immersed boundary methods with boundary mass.Comput.Methods Appl.Mech.Eng.,vol.197,no.25-28,pp.2049–2067.
Newren,E.P.;Fogelson,A.L.;Guy,R.D.;Kirby,R.M.(2007):Unconditionally stable discretizations of the immersed boundary equations.J.Comput.Phys.,vol.222,no.2,pp.702–719.
Ohashi,A.;Harada,H.(1996):A novel concept for evaluation of biofilm adhesion strength by applying tensile force and shear force.Water Sci.Technol.,vol.34,no.5-6,pp.201–211.
Pavlovsky,L.;Younger,J.G.;Solomon,M.J.(2013): In situ rheology of Staphylococcus epidermidis bacterial biofilms.Soft Matter,vol.9,no.1,pp.122.
Peskin,C.S.(1977):Numerical analysis of blood flow in the heart.J.Comput.Phys.,vol.81,pp.372–405.
Peskin,C.S.(2002):The immersed boundary method.Acta Numer.,vol.11,pp.479–517.
Picioreanu,C.;Kreft,J.-U.;van Loosdrecht,M.C.M.(2004):Particle-Based Multidimensional Multispecies Biofilm Model.Appl.Environ.Microbiol.,vol.70,no.5,pp.3024–3040.
Picioreanu,C.;van Loosdrecht,M.C.;Heijnen,J.J.(2001):Two-dimensional model of biofilm detachment caused by internal stress from liquid flow.Biotechnol.Bioeng.,vol.72,no.2,pp.205–18.
Picioreanu,C.;van Loosdrecht,M.C.M.;Heijnen,J.J.(1999): Discrete differential modelling of biofilm structure.Water Sci.Technol.,vol.39,no.7,pp.115–122.
Picioreanu,C.;van Loosdrecht,M.C.M.;Heijnen,J.J.(2000): Effect of diffusive and convective substrate transport on biofilm structure formation:A twodimensional modeling study.Biotechnol.Bioeng.,vol.69,no.5,pp.504–515.
Rittmann,B.E.(1982): Comparative performance of biofilm reactor types.Biotechnol.Bioeng.,vol.24,no.6,pp.1341–70.
Rittmann,B.E.;McCarty,P.L.(1980): Evaluation of steady-state-biofilm kinetics.Biotechnol.Bioeng.,vol.22,no.11,pp.2359–2373.
Ro,K.S.;Neethling,J.B.(1991):Biofilm density for biological fluidized beds.Res.J.Water Pollut.Control Fed.,vol.63,no.5,pp.815–818.
Rupp,C.J.;Fux,C.A.;Stoodley,P.(2005): Viscoelasticity of Staphylococcus aureus biofilms in response to fluid shear allows resistance to detachment and facilitates rolling migration.Appl.Environ.Microbiol.,vol.71,no.4,pp.2175–8.
Rusconi,R.;Lecuyer,S.;Guglielmini,L.;Stone,H.A.(2010):Laminar flow around corners triggers the formation of biofilm streamers.J.R.Soc.Interface,vol.7,no.50,pp.1293–9.
Spiga,M.;Morino,G.(1994): A symmetric solution for velocity profile in laminar flow through rectangular ducts.Int.Commun.Heat Mass Transf.,vol.21,no.4,pp.469–475.
Stewart,E.J.;Satorius,A.E.;Younger,J.G.;Solomon,M.J.(2013):Role of environmental and antibiotic stress on Staphylococcus epidermidis biofilm microstructure.Langmuir,vol.29,no.23,pp.7017–24.
Stotsky et.al,J.(2014):Variable Viscosity and Density Biofilm Simulations using an Immersed Boundary Method,Part II:Experimental Validation and Accelerated Convergence.(in preparation).
Strychalski,W.;Guy,R.D.(2012):Viscoelastic Immersed Boundary Methods for Zero Reynolds Number Flow.Commun.Comput.Phys.,vol.12,no.2,pp.462–478.
Todar,K.G.(2012):Todar’s Online Textbook of Bacteriology,2012.
Wang,Q.;Zhang,T.(2010): Review of mathematical models for biofilms.Commun.Solid State Phys.,vol.150,no.21-22,pp.1009–1022.
Zamir,M.(2000):The Physics of Pulsatile Flow.Biological Physics Series.Springer-Verlag,New York,NY.
Zhang,T.;Cogan,N.G.;Wang,Q.(2008): Phase Field Models for Biofilms.I.Theory and One-Dimensional Simulations.SIAM J.Appl.Math.,vol.69,no.3,pp.641.
Zhang,T.;Cogan,N.G.;Wang,Q.(2008):Phase- field models for biofilms II.2-D numerical simulations of biofilm- flow interaction.Commun.Comput.Phys,vol.4,no.1,pp.72–101.
Zhu,L.;Peskin,C.S.(2002): Simulation of a Flapping Flexible Filament in a Flowing Soap Film by the Immersed Boundary Method.J.Comput.Phys.,vol.179,no.2,pp.452–468.
Zhuo,J.;Dillon,R.(2011): Using the immersed boundary method to model complex fluids-structure interaction in sperm motility.Discret.Contin.Dyn.Syst.-Ser.B,vol.15,no.2,pp.343–355.
 Computer Modeling In Engineering&Sciences2014年9期
- Computer Modeling In Engineering&Sciences的其它文章
- Hybrid Simulation and Observation of Human Vertebral Endplate Morphology
- Activation Pattern of Nuclear Factor-kB in Skin after Mechanical Stretch–a Multiscale Modeling Approach
- A Computational Modeling Framework for Heat Transfer Processes in Laser-Induced Dermal Tissue Removal
- Molecular Dynamics Simulations of Ions Diffusion in Carbon Nanotubes Embedded in Cell Membrane
