Impact of Economic Development Model on the Fitting Effect of the Mathematical Model of Changes in Cultivated Land Resources
Xin YAO,Min ZHANG
School of Remote Sensing,Nanjing University of Information Science&Technology,Nanjing 210044,China
With the accelerated process of reform and opening up,the limited cultivated land resources are facing the dual pressure of urban-rural construction and food production[1],and the dwindling cultivated land resources gradually affect the food security,thereby restricting the further economic development.Correct understanding of the relationship between the economic development and changes in cultivated land resources has become one of the hot spots of relevant researches[2].In earlier studies,when modeling the trend of changes in cultivated land,some scholars find that the area of cultivated land is reduced exponentially along with the increase in the per capita GDP[3].This conclusion has been well verified in Beijing and Anhui[4-5].
With the deepened understanding of the relationship between the economy and the environment,some scholars include the cultivated land resources in the scope of the study of Kuznets curve to theoretically prove it[6],and carry out empirically study of the provincial panel data[7-8].They believe that the farmland conversion process can be really described with Kuznets curve.In recent years,the logistic curve of ecological significance has also been applied in some researches[9].In comparison with the above models,the linear model is the simplest,but its choice of independent variable has also undergone a long process of change:from time sequence to the socio-economic indicators[10],from unitary linear regression to the current multivariate linear regression based on principal component analysis[11].
In addition,the gray model GM(1,1)is also one of the commonly used models in the studies of changes in cultivated land resources[12],which has the advantage in needing no other socioeconomic indicators to generate data sequence,but in some comparative studies,its performance is not better than the above trend model[13-14].For the county,city and other small areas,the changes in the cultivated land area and related indicators of economic growth are more susceptible to regional planning,industrial and agricultural development policies and other factors[15],so we need to further verify and discuss whether the process of changes in cultivated land resources is in line with various above curve characteristics,and whether the differences in regional economic models will lead to different variations.
In this paper,taking Xinghua City and Jingjiang City under the jurisdiction of Taizhou area in central Jiangsu Province as the study area,we carry out analysis of the long time series data,and use multiple mathematical models to simulate the changes in the reduction of cultivated land and compare the differences in the process of loss of cultivated land.And we discuss the economic development models of the two cities in order to find out the underlying causes of these differences and take it as a supplement to the existing related researches.
1 Study area and methods
1.1Study area Xinghua City and Jingjiang City are both administered by Taizhou City,Jiangsu Province.Taizhou is a prefec-ture-level city in central Jiangsu Province in eastern China.Situated on the north bank of the Yangtze River,it borders Nantong to the east,Yancheng to the north and Yangzhou to the west.The prefecture-level city of Taizhou administers six county-level divisions,including two districts and four county-level cities(Fig.1).These are further divided into 105 township-level divisions,including 91 towns,eight townships and six subdistricts.
Xinghua City(32°40′-33°13′N,119°43′-120°16′E),which is located in the north of Taizhou City,covers an area of 2393.35 square kilometers,and has jurisdiction over 28 towns,6 townships,1 provincial economic development zone.At the end of 2010,there was a total population of 1.5594 million in the city,the regional GDP was38.024 billion yuan,and the area of cultivated land was0.128million hectares.
Jingjiang City(31°56′-32°08′N,120°01′-120°33′E),which is located in the south of Taizhou City,covers an area of 665 square kilometers,and has jurisdiction over 8 towns,1 street office,and 2 provincial economic development zones.At the end of2010,there was a total population of 0.6682million in the city,the regional GDP was43.603 billion yuan,and the area of cultivated land was0.029 million hectares.
The two cities are at the two sides of Taizhou,respectively.There is a certain difference in the economic growth rate and policy orientation between the two cities.In a series of administrative division adjustments,Xinghua City and Jingjiang City are less affected,so they are more suitable than the surrounding Taixing,Jiangyan,Hailing and Gaogang for the comparative analysis of the data.
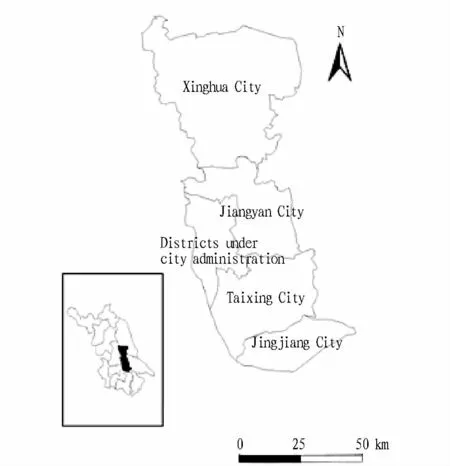
Fig.1 The location of Taizhou
1.2Research methods This paper selects30 years of cultivated land area and GDP data from Statistical Yearbook of Xinghua City and Jingjiang City in the period 1980-2009[16-17].According to previous research and the actual situation,we make appropriate modification[3,6,9,11], and employ logarithmic model,Kuznets model,logistic curve model and multivariate linear regression model for fitting.The specific equation as follows:
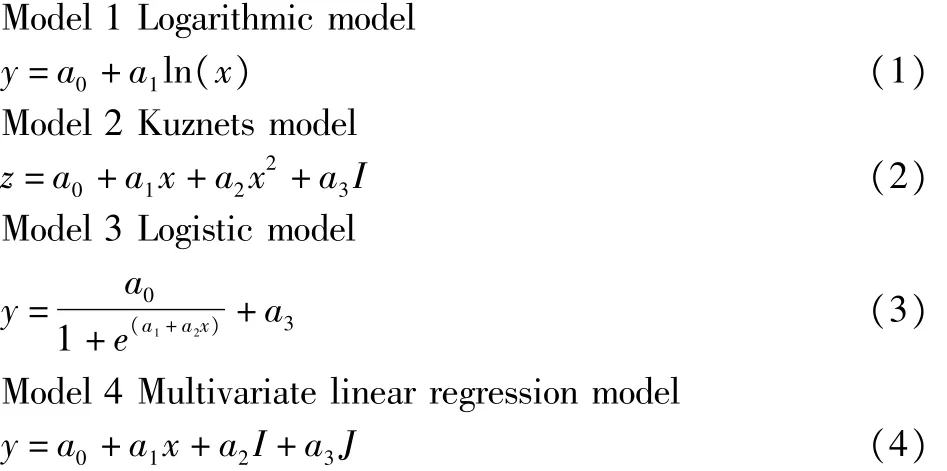
where y is the cumulative reduction amount of arable land area for many years;z is the reduction amount of arable land area each year;x is the per capita GDP;I is the proportion of added value of nonagricultural industries to GDP;J is grain yield per mu;a0,a1,a2,a3are the equation parameters.
The independent variables in equation(4)are all the relevant socio-economic indicators contributing significantly to changes in the area of cultivated land.x,I,J signify the level of socioeconomic development,economic structure and the level of agricultural modernization,respectively.The gray model can not reflect the unique trend of changes in the area of cultivated land and the related driving factors,so this paper does not take it as an object for discussion.These data are processed in EXCEL2010 and SPSS16.0.
2 Calculation results
The simulation results of data set in Xinghua City and Jingjiang City during the period 1980-2009 are shown in Table1.R2is the coefficient of determination for the model,and SE is the standard error.For the model as a whole and each coefficient,p<0.05.The dependent variable of logistic model,logarithmic model and multivariate linear model are the cumulative reduction amount of cultivated land area for many years,and the dependent variable of Kuznets model is the reduction amount of cultivated land area each year.For unified comparison,here we calculate the standard error of accumulated reduction amount of cultivated land area fitted by Kuznets curve.

Table1 Determination coefficients and standard errors of mathematical models
The coefficient of determination of logistic curve model in Xinghua City is the highest(R2=0.987),followed by multivariate linear model(R2=0.885),and logarithmic model(R2=0.841).The coefficient of determination of Kuznets curve model is the lowest(0.410).From the standard error,the standard error of logistic curve is the lowest(SE=1.104),followed by multivariate linear model(SE=3.097),but the standard error of Kuznets curve model is lower than that of logarithmic model(3.457 and 3.651,respectively).The fitting effect in Jingjiang City is different.The coefficient of determination of logarithmic model is the highest(R2=0.972),followed by logistic model(R2=0.933),multivariate linear model(R2=0.911),and Kuznets model(R2=0.547).The standard error of logarithmic model is the lowest(SE=0.312);SE of logistic model is0.345;SE of multivariate linear model is 0.401;SE of Kuznets model is 0.615.
Larger R2and smaller SE represent better fitting effect.In terms of the model fitting effect in Xinghua City,it is in the order of M3>M4>M1>M2,which is related to the fact that the local areas lay great emphasis on agricultural development,and pay close attention to ensuring the cultivated land area;in terms of the model fitting effect in Jingjiang City,it is in the order of M1>M3>M4>M2,and the deep-seated cause is that its development model is dominated by extended trade expansion,and the level of intensive land use is constantly improved.It is worth mentioning that since the dependent variables use the reduction amount of cultivated land area in Kuznets curve model,although its curve fitting coefficient of determination is low,the actual results will not be much worse when predicting the changes in the cultivated land area.
The logistic curve fitting of changes in the cultivated land area in Xinghua City is shown in Fig.2.As can be seen from the figure,the cultivated land area in Xinghua City is always in a flat state when the per capita GDP is less than 1000 yuan,and it is even increased slightly due to land consolidation earlier;when the per capita GDP is higher than 1000 yuan,the cultivated land area is rapidly reduced,and this stage will continue until the per capita GDP reaches about4000 yuan;subsequently it enters a new stage of fluctuated equilibrium and continues to this day.According to the logistic curve theory,the upper limit of cumulative reduction amount of arable land area S max=20.511-2.079=18.432 khm2,which reflects a further decrease of arable land posing greater pressure.
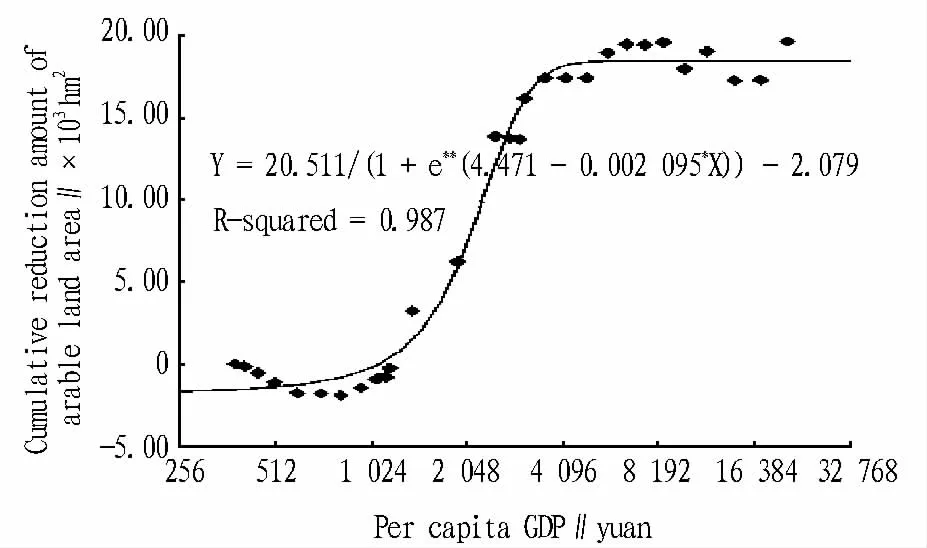
Fig.2 The logistic curve of cultivated land change in Xinghua
The logarithmic curve fitting of changes in cultivated land area in Jingjiang City is shown in Fig.3.Overall,its cultivated land area has always been a state of continuing decline.When the per capita GDP is less than 10000 yuan,the decline rate is higher;when the per capita GDP is more than 10000 yuan,the decline rate is lower.
During the period 1980-1984,when the cultivated land area was reduced by 1 hm2,the per capita GDP would increase by 0.84 yuan;during the period 2005-2009,when the cultivated land area was reduced by 1 hm2,the per capita GDP would increase by 44 yuan.It suggests that there are differences in the economic growth pattern in different periods,and the land use pattern is changed from extensive mode to intensive mode.
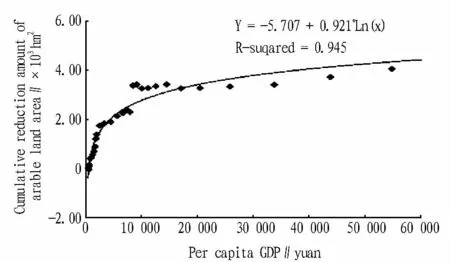
Fig.3 The logarithm ic curve of cultivated land change in Jingjiang
3 Analysis and discussion
3.1Differences in economic development pattern between the two cities Xinghua City is the Yangtze River Delta'smajor commodity grain production base,the province'smain rice producing area and high-yield area,and national basic farmland protection demonstration area.Xinghua City is rich in water and land resources,with high land reclamation coefficient and cropping index.The quality of cultivated land is good,and there are rich resources of reed land.The village settlements are relatively concentrated.
The overall land use planning in Xinghua City points out that in the process of promoting urban development and accelerating the urbanization,the urban construction land in Xinghua City mainly depends on the reconstruction of the old city town,merging village,building the central villages;the per capita city's urban land area does not exceed 100 square meters,it is necessary to carry out land development,consolidation,reclamation,mining land potential,and strictly control non-agricultural use of farmland,so that cultivated land area will slightly increase on the basis of achieving dynamic equilibrium of total cultivated land[18].
So,Xinghua City should occupy farmland as little as possible in the course of urban construction,and the results in Fig.2 show that Xinghua City has better completed the planning objectives.In the basic farmland protection plan,Xinghua City takes improving cultivated land quality as the main way to increase yield,requires the organization of low-yielding farmland transformation to prevent soil erosion and pollution,and strengthens the construction of bas-ic farmland ecological environment,to improve the quality of farmland and achieve the strict dynamic monitoring of land use planning.These measures ensure the steady growth of grain production,and at same time,make the changes in its cultivated land area reach the growth ceiling earlier microscopically,showing variations of logistic curve.
Jingjiang City is an emerging riverside industrial city dominated by the modern manufacturing industry,and one of regional logistics bases in the north wing of the Yangtze River Delta.At present its industrial development model is still based on extensive expansion[19],so the cultivated land will be constantly occupied in the future.The cumulative reduction of cultivated land area in Jingjiang City shown in Fig.3 will continue to intensify,which just reflects this situation.
Nevertheless,in recent years,Jingjiang City has also taken a series of measures to improve land utilization.In 2004,Jingjiang City implemented city-town linkage development strategy,and revoked the township industrial park.In addition to the technological transformation of some key enterprises in the towns,there were no new construction sites,and all new projects entered the Economic Development Zone,to promote the centralized input to riverside area project,intensive use of resources,and development of industrial clusters.Jingjiang Land Resources Bureau guides the enterprises to build two-story or multi-story standardized plant,to ease the growing tension between supply and demand of land and promote land conservation and intensive use.These measures have played a direct or indirect role in protecting cultivated land.This also explains why the per capita GDP has increased rapidly since 2000 in Jingjiang City,but the loss rate of arable land has been controlled in a large degree.Extensive expansion-based industrial development model and the increasing intensive use of land,have made the changes in the cultivated land area in Jingjiang City show logarithmic curve characteristics overall.
3.2Phase characteristics of changes in cultivated land resources The differences in economic development model,in a strict sense,are not only reflected in the space,but also in the time[20].This also produces a corresponding impact on the process of changes in cultivated land resources,leading to phase characteristics of changes in cultivated land resources[21].Nevertheless,on the one hand,due to the continuity of regional economic development characteristics before and after the stage,and on the other hand,due to modeling's requirements on the data sequence length,the too short data can not necessarily reflect the real trend.So in the face of such problems,it is prudent to use the same type of mathematical model for phase simulation,although at different stages,using different models is theoretically feasible.
Taking Jingjiang City for example,we regard the city-town linkage development strategy in 2004 as a dividing point,and use logarithmic model to carry out phase fitting of it.The model coefficient of determination R2before and after the stage is 0.958 and 0.851,respectively,and SE is 0.261 and 0.137,respectively.Compared to R2=0.945 and SE=0.312 of the original model,the fitting effect of both at the first stage is improved,and the coefficient of determination in the second phase is slightly low,but the standard deviation experiences a substantial increase,and the model predicted value is closer to the true value.
The Jingjiang case is not the most typical.Wu Guiping et al found that the total cultivated land area of one county in the South declined in a wavy manner during the period 1996-2005,and the trend model's fitting effect of it was not good[14].From the analysis in this paper,we can find that this phenomenon can actually be classified as multi-stage logistic curve mode,because along with the per capita GDP growth,the level of intensive land use will be also improved.For a particular study area,the total area is limited,and in the absence of special factors,it can be expected that the new reduction space of cultivated land area should be slightly lower than that of the original reduction space.The ideal multistage logistic curve is shown in Fig.4:I,II,III represent different stages of land use.
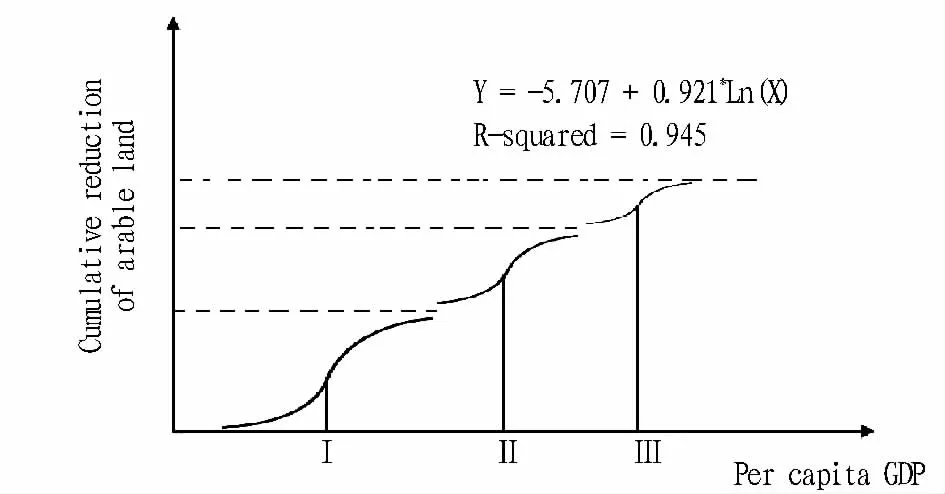
Fig.4 The multi-stage logistic curve
There is also the same problem in Kuznets model fitting,that is,after the annual reduction amount of cultivated land area is increased from 0 to the maximum and then returns to 0,it will start a new cycle,and the scatter plot shows"M"shape,but not typical inverted"U"shape of Kuznets curve,indicating that it may undergo two cycles.Taking the data of Qu Futian et al on 20 years of cultivated land loss rate in the six coastal provinces during the period 1981-2000[6]for example,we carry out Kuznets model refitting of Shanghai,Jiangsu,Shandong,Guangdong and Fujian with prominent features of"M"shape in the scatter plot(with 1990 as the boundary).The comparison of coefficients of determination can be seen in Table2,and the coefficient of determination of all phases is better than that of the original model.

Table2 Comparison of coefficients of determination
4 Conclusions
Mathematical model is a commonly used method to predict and analyze the changes in cultivated land resources in the current land use planning.In previous studies for different regions,their performance is different.Based on the comparative study of Xinghua City and Jingjiang City,this paper finds a practical case for differences in the fitting effects of mathematical models caused by differences in the economic development model,and believes that for the regions laying great emphasis on agricultural development,since ensuring the cultivated land area is important,using the logistic curve with upper limit to fit the reduction process of cultivated land area is appropriate;the extensive expansion-based industrial development model and continuously improved level of intensive land use correspond to the logarithmic curve.Kuznets model and multivariate linear model make poor performance in the study area,but in view of their characteristics,Kuznets model should be similar to logistic model,more applicable to the regions with the reduction of cultivated land area approaching the upper limit.The multivariate linear model is complicated,and the specific effects depend on the number and nature of the selected independent variables.
Meanwhile,compared with other models,due to different dependent variables,Kuznets model often has a too small coefficient of determination,but it does not necessarily mean that the overall forecast effect is poor,which should be noted when selecting the model in the future.In addition,for some areas,the differences in the economic development model in different periods can lead to multi-stage characteristics of changes in cultivated land resources,and this phenomenon is also reflected in other scholars'study,for example,using the idea of segmented simulation can better solve the problems that the scatter plot of logistic model presents waveshape and the scatter plot of Kuznets model presents"M"-shape,in order to improve the applicability of mathematical models.
[1]CAIYL,FU ZQ,DAIEF.The minimum area per capita of cultivated land and its implication for the optimization of land resource allocation[J].Acta Geographica Sinica,2002,57(2):127-134.(in Chinese).
[2]LUQ.Some issues on the relationship between land resources development,production and food security[J].Resources Science,1999,21(6):5-8.(in Chinese).
[3]YANGGS.The process and driving forces of change in arable land area in the Yangtze River Delta during the past50 years[J].Journal of Natural Resources,2001,16(2):121-127.(in Chinese).
[4]LIZY,YANGGS.The relationship between the cultivated land change and food security in the area of Yangtze River watershed of Anhui Province[J].Resources Science,2006,28(6):91-96.(in Chinese).
[5]SUNQ,CAIYL,WANGWB.Study on temporal-spatial processes of farmland conversion and its control mechanisms in Beijing,China,1996-2004[J].Progress in Geography,2006,25(6):108-116.(in Chinese).
[6]QU FT,WU LM.Validation of Kuznets curve hypothesis for economic growth and cultivated land conversion:Evidence from provincial panel data in China[J].Resources Science,2004,26(5):61-67.(in Chinese).
[7]LIYL,WUQ.Validation of Kuznets curve for economic growth and cultivated land conversion:Evidence from provincial panel data in China[J].Resources Science,2008,30(5):667-672.(in Chinese).
[8]CAO YG,WANG J,CHENG Y,et al.Research of changes in cultivated land around the reservoir area of Three Gorges[J].Progress in Geography,2006,25(6):117-125.(in Chinese).
[9]ZENG XK,LIGC,WANG YL,et al.Hypothesis and validation on the Kuznets curves of cultivated land change and its human driving forces in rapidly urbanized area:A case study of Shenzhen City[J].Resources Science,2009,31(4):604-611.(in Chinese).
[10]WU XH.A review of research on non-agriculturalization of arable land[J].Geography and Geo-information Science,2006,22(1):51-56.(in Chinese).
[11]WU Y,YANG GS,WAN RR.Advances in researches on relations between cultivated land change and socio-economic development[J].Progress in Geography,2008,27(1):90-98.(in Chinese).
[12]XU Y,ZHOU Y,ZHAN L.Study on dynamic changes of the farmland in Jingzhou City based on the graymodel GM(1,1)[J].Hubei Agricultural Sciences,2007,46(5):713-715.(in Chinese).
[13]YANG F,XIAO L,ZHANG L,et al.Study on cultivated land-grain system balance in Gansu[J].Journal of Arid Land Resources and Environment,2010,24(12):49-54.(in Chinese).
[14]WU GP,ZENG YN,YANG S,et al.Predicting methods of arable land demand and their application in county's general land use planning[J].E-conomic Geography,2007,27(6):995-1002.(in Chinese).
[15]YAO X,YANGGS,WAN RR.The application of hierarchical cluster analysis to the prediction of grain security of small research areas—A case study of Kunshan[J].Journal of Natural Resources,2011,26(2):218-226.(in Chinese).
[16]Xinghua Statistical Bureau.Xinghua statistical yearbook[M].Xinghua:Xinghua Statistical Bureau,1980-2009.(in Chinese).
[17]Jingjiang Statistical Bureau.Jingjiang statistical yearbook[M].Jingjiang:Jingjiang Statistical Bureau,1980-2009.(in Chinese).
[18]Xinghua Land Bureau.Xinghua general land use planning[M].Xinghua:Xinghua Land Bureau,2007.(in Chinese).
[19]SHEN DX,XIONGGP,etal.Consultation of Jingjiang comprehensive urban plan(1999-2020)[M].Nanjing:Jiangsu Institute of Urban Planning and Design,2001.(in Chinese).
[20]SHEN HF.A comparative study of economic development models in East Asia[M].Xiamen:Xiamen University Press,2002.(in Chinese).
[21]XU HZ,GUO YY,JIN J.Change rate and regional difference of land conversion in different stages of economic development—A case study of Jiangsu Province[J].Bulletin of Soil and Water Conservation,2010,30(3):186-229.(in Chinese).
 Asian Agricultural Research2014年2期
- Asian Agricultural Research的其它文章
- Drought and Waterlogging Characteristics during the Grow th Period of Summer Maize in Luxi Plain Areas
- The Coordinated Development of Sports Industry and Tourism under the Perspective of Soft Power:A Case Study of Henan Province
- Incentives for the Quality and Safety Traceability System of Agricultural Products
- Assessment of Cultivation M ethod for Energy Beet Based on LCA Method
- Model for Predicting Climatic Yield of Sugarcane in Nanning City
- Efficiency Evaluation of Vegetable Specialized Cooperatives Based on Data of Chongqing Municipality
