Efficiency Evaluation of Vegetable Specialized Cooperatives Based on Data of Chongqing Municipality
Zimin LIU,Dan YANG
1.College of Economics and Management,Southwest University,Chongqing 400716,China;2.Agricultural Education Development Research Center,Southwest University,Chongqing 400716,China
With the development of China's rural cooperative economy,especially the implementation of the Law of the People's Republic of China on Farmers'Specialized Cooperatives,cooperatives receive considerable development.No.1 document of central government of 2013 also stresses energetic development of new farmers'specialized cooperatives in various forms.As an essential part of rural economic development,the vegetable specialized cooperative oriented towards production,operation and processing of vegetables grows up strong and sturdy.Through voluntary cooperation of farmers,vegetable planting farmers can earn higher income and more profits through cooperatives.However,with the development of vegetable cooperatives and extension of industrial chain,vegetable specialized cooperatives are polarized,and some cooperatives are low in operating efficiency.Thus,it is necessary to make proper evaluation and analysis on efficiency of cooperatives and come up with pertinent measures according to development direction and expansion strategies of vegetable specialized cooperatives.
In both quantity and scale,cooperatives gradually grow and realize large-scale expansion.Meanwhile,some cooperatives have such problems as small scale,nonstandard development,loose management,and low efficiency in the process of development.Compared with other types of rural economic organizations including companies,associations,and farms,vegetable specialized cooperatives have problems of short time development and varied development level,so they need strengthen their competitive power and raise operating efficiency.In this study,we firstly introduced the Data Envelopment Analysis(DEA)efficiency analysis and super efficiency analysis model.On the basis of collecting and arranging related data of cooperatives in Chongqing Municipality,we analyzed and ranked efficiency of vegetable specialized cooperatives.Then,we divided efficiency into pure technical efficiency and scale efficiency,and came up with corresponding improvement measures from the perspective of different types of efficiency in line with characteristics of different types of vegetable specialized cooperatives.
1 Study methods
The DEA method is a nonparametric method in operations research and economics using Pareto optimal frontier to estimate efficiency.Compared with other subjective evaluation methods,DEA features that evaluation results free from influence of indicator measuring unit,weight coefficient of evaluation model obtained through optimization,and avoiding artificial set(Charnes et al.1978).Compared with other efficiency evaluation methods,DEA method adopts mathematical planning model,and can realize processing of multiple input and output variables for Decision Making Units(DMU).
1.1Traditional DEA model DEA method is based on relative efficiency.Its basic thought is to make comprehensive analysis on ratio of input to output of all samples.It conducts evaluation and calculation taking DMU input and output indicators,determines effective production frontier,judges if DMU is effective according to the distance of DMU to effective production frontier,and determines efficiency values of each DMU.
In 1978,A.Charnes,Cooper and Rhoes introduced a most common DEA model(referred to as CCR model).With the aid of CCR model,it is able to make analysis of efficiency,scale income and projection analysis on DMUs.Since traditional DEA method is a comparatively mature method,we make no further discussion.The details can be found in Coelli T.et.al(1998).
Besides,calculation of CCR model is based on no change of returns to scale.A.Charnes(1985)introduced BCC model for evaluating effectiveness of technical efficiency,calculating pure technical efficiency and scale efficiency of DMUs.And their relationship is technical efficiency=pure technical efficiency*scale efficiency.
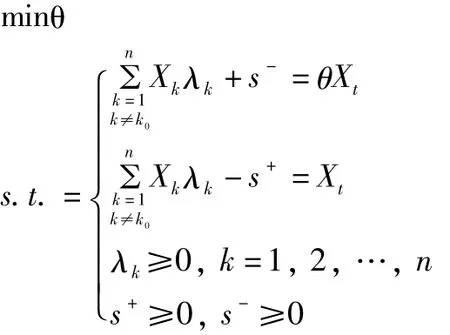
1.2Super efficiency DEA model A drawback of traditional DEA model is its failure to effectively distinguish difference of DMUs.In other words,the efficiency value of all effective DMUs is1.In this situation,it is impossible to make further evaluation.To overcome this drawback,Andersen and Petersen(1993)put forward DEA super efficiency model,which can effectively compare efficiency of all DMUs,to make complete order ranking of DMUs.Its linear programming model is as follows:

where n is number of DMUs,X1=(x1l,x2l,…,xml)is input variable,m is number of input variables,Yl=(y1l,y2l,…,ysl),and s is number of output variables.
The above formula is the super efficiency model in CCR model.Compared with traditional DEA model,the super efficiency model features replacing the input and output combination of the DMU with the input and output combination of other DMUs,excluding itself,and adding the constraint k≠k0.In BCC model,the super efficiency model means addition of the constraint 0 in the above linear programming model.
2 Empirical analysis
Empirical data in this study come from cooperatives participating in application of cooperative project in Chongqing Municipality in 2010-2011.These cooperatives are typical cooperatives in districts of Chongqing Municipality,and the data source is accurate and intact.Among a total of 95 cooperatives,30 are vegetable specialized cooperatives.In the process of project evaluation,we need evaluating cooperatives,select carriers that can efficiently implement and realize project objectives,i.e.efficient cooperatives,to make input resources of the project effectively used.Different from traditional expert subjective selection or setting weight level scoring,DEA method can help us select cooperatives with higher efficiency in scientific,objective and reasonable evaluation manner.
Therefore,using DEA method,the selected cooperatives have higher executing ability and production efficiency,use resources in a better way,and develop into higher cooperatives.In addition,through efficiency comparison and analysis,it is able to obtain difference in efficiency of cooperatives in different districts of Chongqing Municipality.Through analyzing the slack variable and making efficiency decomposition,it is favorable for those cooperatives with lower efficiency to seek approaches to raise efficiency.Furthermore,these cooperatives represent development level of typical cooperatives in Chongqing Municipality.Taking cooperatives of Chongqing Municipality as the example will be of certain guiding significance to development of cooperatives in western regions or even in the whole country.
2.1Definition of input and output variables For efficiency evaluation,the first step is to select proper input and output variables.With reference to selection of input and output indicators by Fu Yuzhi(2011)and Ariyaratne et al.(2000)and Galdeano-Gomez(2008),we took number of cooperative members,total amount of assets,and area of the base as input variables of cooperatives.Number of cooperative members is personnel input of cooperatives,total amount of assets is financial input of cooperatives,and area of the base is the material input of cooperatives.These three indicators comprehensively reflect comprehensive input of personnel,finance and material of cooperatives.
Output performance of cooperatives not only includes direct economic efficiency of cooperatives.Zhao Jiarong(2010)stated that cooperatives also undertake corresponding social responsibilities,especially important responsibility of guiding farmers to get rich.Therefore,in economic performance indicators,we used annual sales income and annual net profit to reflect economic scale and operating performance of cooperatives.We used number of farmers promoted and increase of farmers'net income to reflect social performance of cooperatives.Descriptive statistics of variables are listed in Table 1.

Table 1 Descriptive statistics of input and output of cooperatives
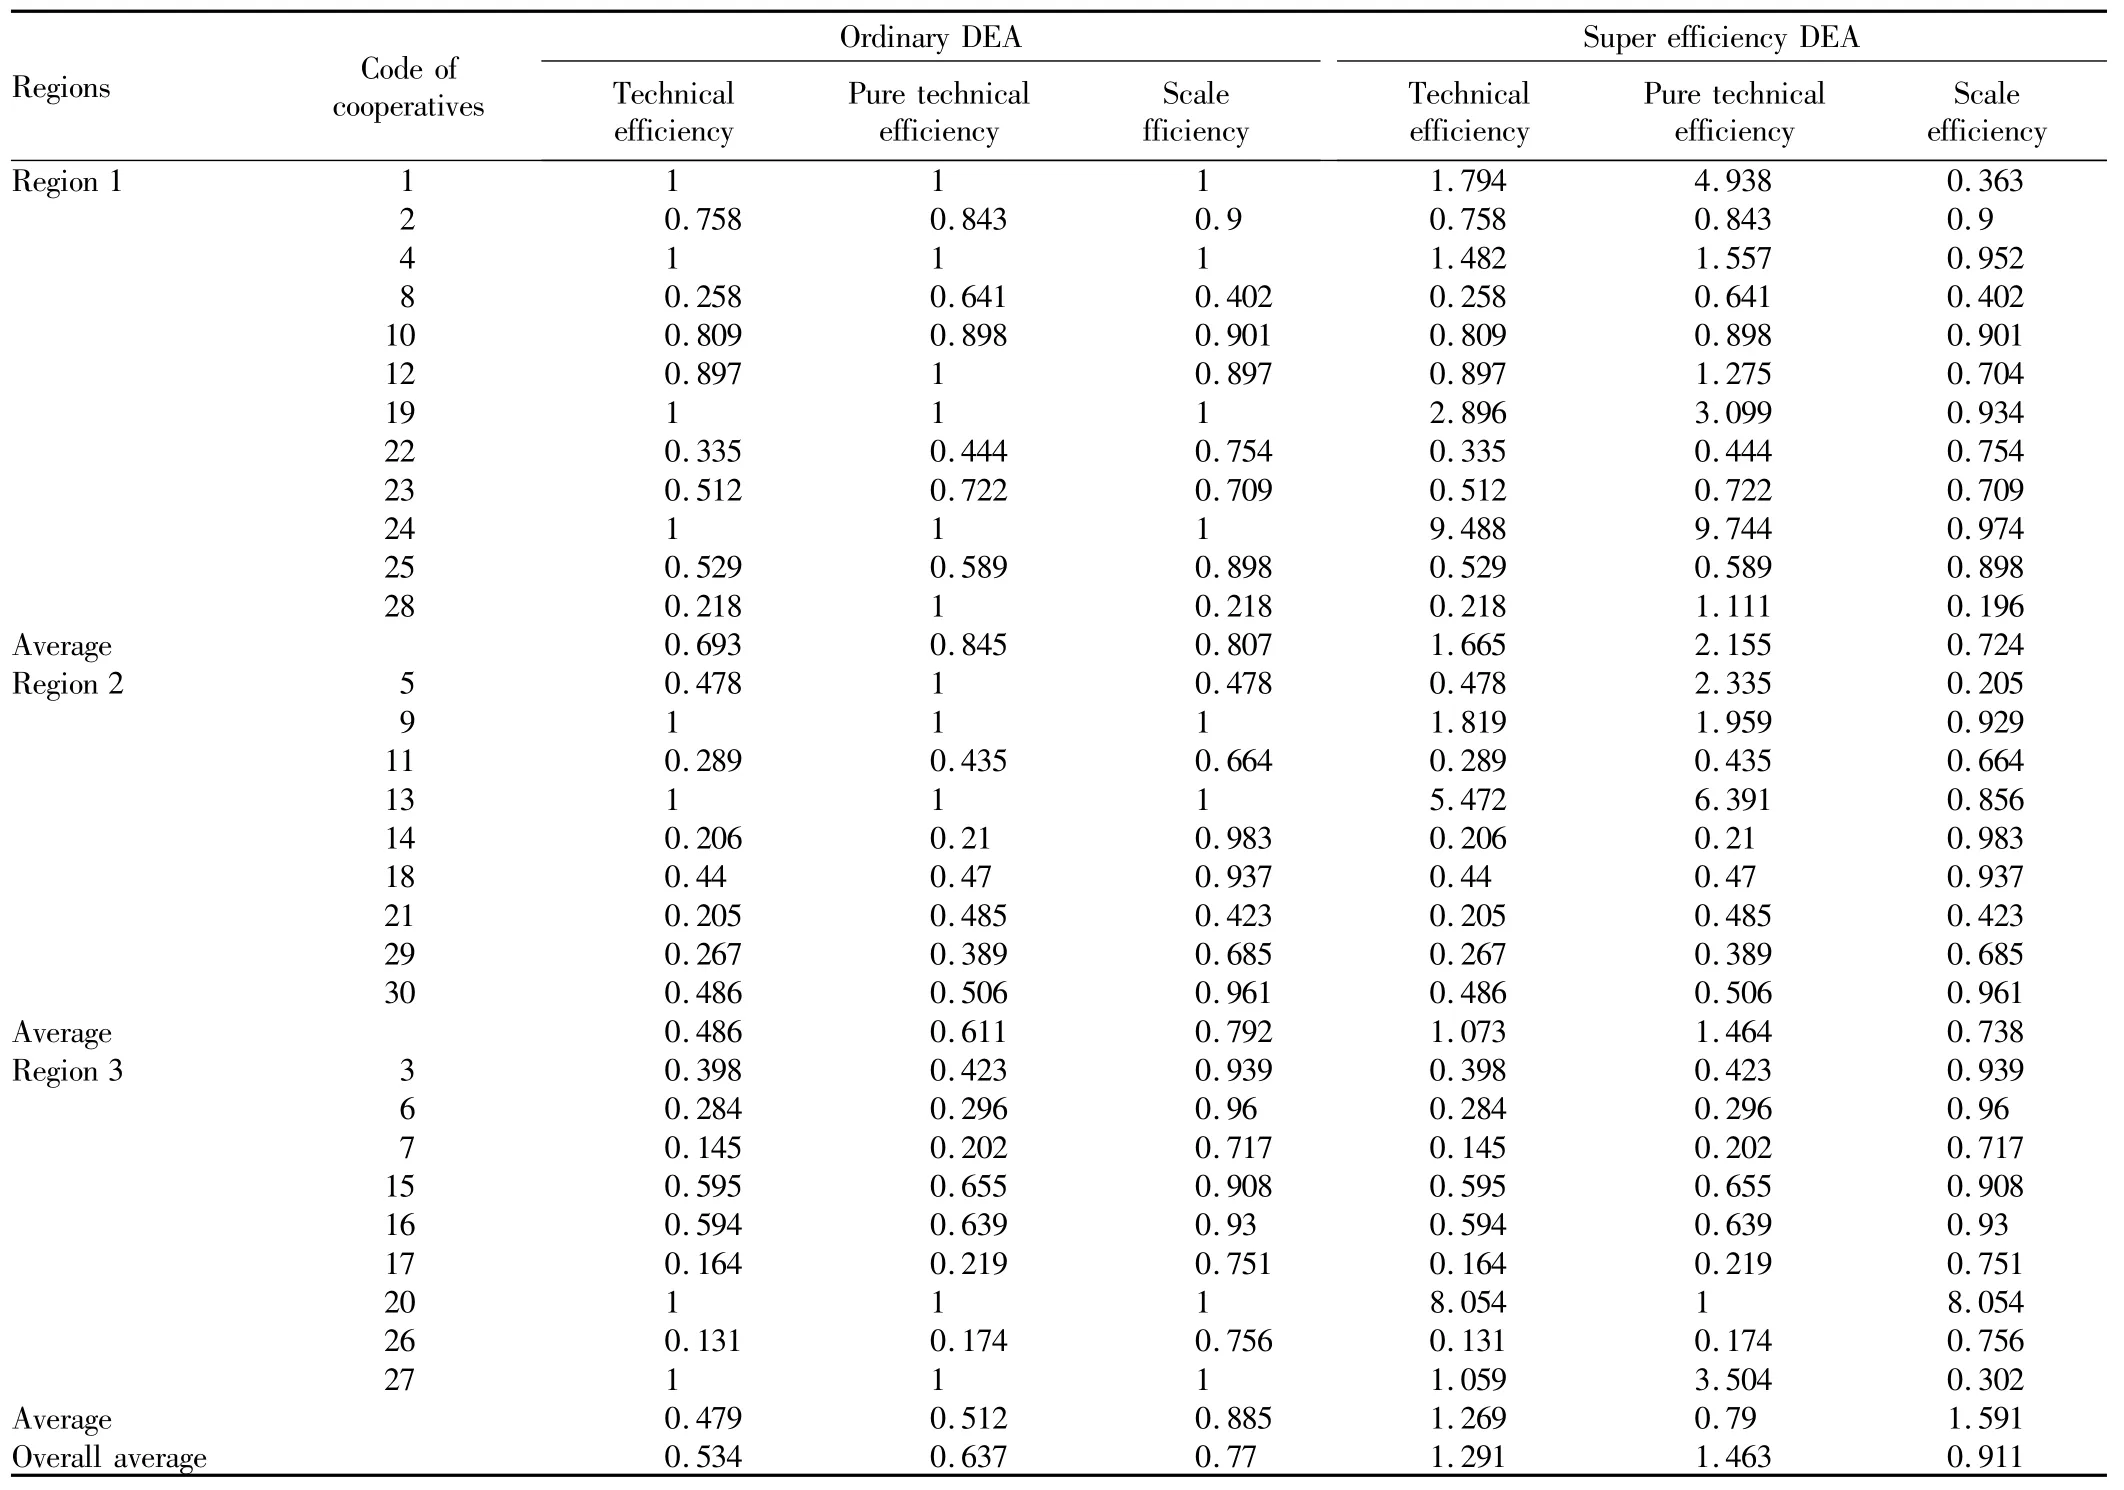
2.2 Analysis of efficiency results Through calculation of DEA efficiency and super efficiency of vegetable specialized cooperatives in Chongqing Municipality,and division of"one-hour economic circle"and"two wings",we divided Chongqing Municipality into one-house economic circle,southeastern and western Chongqing regions.We obtained efficiency values of vegetable specialized cooperatives in different regions of Chongqing Municipality,as listed in Table 2.

Table 2 Technical efficiency and super efficiency of cooperatives in different regions of Chongqing Municipality
From Table 2,we can know that in the total 30 vegetable specialized cooperatives,there are 12 cooperatives in one-hour economic circle,and 9 cooperatives separately in other two regions.This is basically consistent with economic development level of Chongqing Municipality.In the distribution of efficiency value,the efficiency of cooperatives in region 1 is obviously higher than that in other two regions.The average efficiency of region 3 is slightly higher than that of region 2.However,ordinary DEA model fails to distinguish 8 cooperatives that are effective DMUs.In this situation,we used the super efficiency model to further distinguish all effective DMUs.It can be seen that No.24 cooperative in region 1 has the highest efficiency in all30 cooperatives,and has the greatest difference with No.27 cooperative in traditional DEA model.Therefore,the super efficiency model provides further analysis tool for identifying efficiency of cooperatives,and increases accuracy of evaluation.
From the perspective of decomposition of technical efficiency values,in ordinary DEA model,pure technical efficiency and scale efficiency of region 1 are higher,while overall efficiency of region 3 is lower than region 2 because pure technical efficiency of region 3 is relatively low.In super efficiency model,since it makes further division of effective DMUs,it can be seen that high overall efficiency of region 1 gives the credit to high pure technical efficiency,and scale efficiency of region 1 is lower region 2.Besides,cooperatives in region 3 have larger scale,but their pure technical efficiency lags behind other two regions.
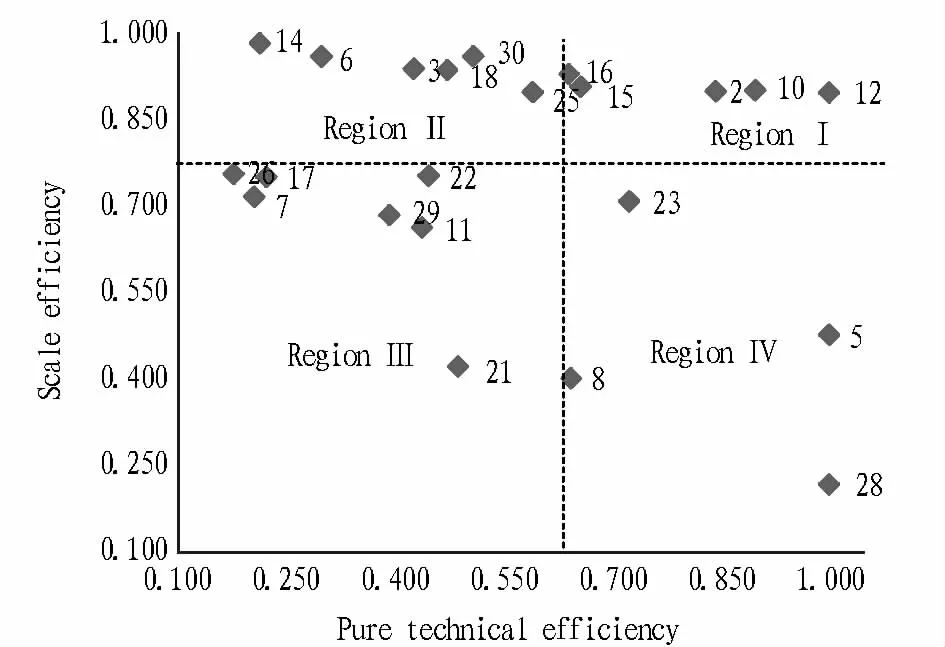
2.3Analysis on pure technical efficiency and scale efficiency Through analysis on efficiency of cooperatives in all regions,we further used BCC based DEA model and divided efficiency values into pure technical efficiency and scale efficiency,to analyze reasons for difference in efficiency values of different cooperatives and obtain efficiency increase and improvement direction of various cooperatives.Excluding 8 cooperatives in production frontier,we took pure technical efficiency as axis of abscissa and allocation efficiency as axis of coordinate,average value0.637 of pure technical efficiency and average value 0.770 of allocation efficiency to make division,and divided 22 vegetable specialized cooperatives in non-production frontier into 4 intervals,as shown in Fig.1.

Fig.1 Distribution of pure technical efficiency and scale efficiency of vegetable specialized cooperatives
For 5 cooperatives in region I,both pure technical efficiency and allocation efficiency are high.Compared with completely effective cooperatives,these cooperatives need make little improvement and may introduce advanced planting technology or adjust scale.For 6 cooperatives in region II,their pure technical efficiency is low,but their scale efficiency is high.These cooperatives should introduce pertinent production technologies,provide training services for cooperative members in vegetable planting,and introduce fine variety cultivation,to improve technical efficiency.For 7 cooperatives in region III,both pure technical efficiency and scale efficiency are low.Firstly,cooperatives should popularize planting technology with the support of government and other organizations.Besides,they should make effort to attract farmers to join in their cooperatives.For 4 enterprises in region IV,the pure technical efficiency is high and scale efficiency is low.To increase overall efficiency,these cooperatives should expand their scale,realize large-scale operation,reduce costs,and increase efficiency.
3 Conclusions and recommendations
Using DEA method and traditional and super efficiency DEA models,we analyzed efficiency values of vegetable specialized cooperatives.According to regional division of Chongqing Municipality,we compared efficiency of cooperatives in three regions.Overall technical efficiency,pure technical efficiency and scale efficiency of three regions take on different characteristics,but the overall trend is consistent with local economic development.At the same time,it can be concluded that the super efficiency DEA model can identify and rank order of effective DMUs,so as to make more accurate evaluation on efficiency of cooperatives.
On this basis,it can provide path for judging and analyzing efficiency of cooperatives.We made decomposition of technical efficiency,classified cooperatives with incomplete efficiency,and divided those cooperatives into 4 categories using distribution of pure technical efficiency and scale efficiency.Finally,in line with efficiency distribution of 4 categories of cooperatives,we came up with pertinent measures and recommendations,to point out direction for incomplete effective cooperatives transforming into complete effective cooperatives.
[1]Ariyaratne,C.B.,Featherstone,A.M.,Langemeier,M.R.and Bartone,D.G.Measuring X-efficiency and scale efficiency for a sample of agricultural cooperatives[J].Agricultural and Resource Economics Review,2000,29(2):198-207.
[2]Galdeano-Gómez,E.Productivity effects of environmental performance:Evidence from TFP analysis on marketing cooperatives[J].Applied Economics,2008,40(14):1873-1888.
[3]YANG SW,YANG D.The relation between regional difference and government behavior:Making analysis on specialized farmers cooperatives[J].Reform,2011(11):13-19.(in Chinese).
[4]YANG D.Can agricultural working divide and specialization cause farmer households'cooperation behavior——Based on the empirical analysis of peasant households data of 20 counties 5 provinces of Western China[J].Journal of Agrotechnical Economics,2012(8):37-45.(in Chinese).
[5]LIS.Efficiency evaluation of agricultural information based on DEA and super-efficiency DEA model[J].Hubei Agricultural Sciences,2011,50(6):1291-1294.(in Chinese).
[6]LIU ZM,ZHANG XZ.The dynamic efficiency and convergence of China government health investment——Based on modified malmquist index method[J].Soft Science,2012,26(12):100-111.(in Chinese).
 Asian Agricultural Research2014年2期
- Asian Agricultural Research的其它文章
- Training and Recommendations on the Lower Limbs Exp losive Force of Juvenile Amateur M en Sprinters
- Effects of Soil C/N Ratio on Apple Grow th and Nitrogen Utilization,Residue and Loss
- Drought and Waterlogging Characteristics during the Grow th Period of Summer Maize in Luxi Plain Areas
- Model for Predicting Climatic Yield of Sugarcane in Nanning City
- Assessment of Cultivation M ethod for Energy Beet Based on LCA Method
- Incentives for the Quality and Safety Traceability System of Agricultural Products
