
Muscle activity and kinematics of forefoot and rearfoot strike runners
2014-03-21 02:33AhnBrytonBhtiMrtin
A.N.Ahn,C.Bryton,T.Bhti,P.Mrtin
aDepartment of Biology,Harvey Mudd College,Claremont,CA 91711,USA
bKeck Science Center,Scripps College,Claremont,CA 91711,USA
cDepartment of Engineering,Harvey Mudd College,Claremont,CA 91711,USA
Muscle activity and kinematics of forefoot and rearfoot strike runners
A.N.Ahna,*,C.Braytona,T.Bhatiab,P.Martinc
aDepartment of Biology,Harvey Mudd College,Claremont,CA 91711,USA
bKeck Science Center,Scripps College,Claremont,CA 91711,USA
cDepartment of Engineering,Harvey Mudd College,Claremont,CA 91711,USA
Background:Forefootstrike(FFS)and rearfootstrike(RFS)runners differ in their kinematics,force loading rates,and joint loading patterns,but the tim ing of their muscle activation is less clear.
Methods:Forty recreational and highly trained runners ran at four speeds barefootand shod on a motorized treadm ill.“Barefoot”runners wore thin,five-toed socks and shod runners wore neutral running shoes.Subjects were instructed to run com fortably ateach speed with no instructions about foot strike patterns.
Results:Eleven runners landed w ith an FFS when barefoot and shod and eleven runners landed w ith an RFS when barefoot and shod.The 18 remaining runners shifted from an FFS when barefoot to an RFS when shod(shifters).Shod shifters ran w ith a lowerstride frequency and greater stride length than all other runners.A ll FFS runners landed w ith more plantarflexed ankles and more vertical lower legs at the beginning of stance compared to RFS runners.FFS runners activated their plantarflexor muscles 11%earlier and 10%longer than RFS runners.
Conclusion:This earlierand longer relative activation of the plantarflexors likely enhances the capacity for the passive structures of the footand ankle to store elastic energy,and may also enhance the performance of the active muscle by increasing the storage of elastic strain energy in the cross-bridges and activated titin.
CopyrightⒸ2014,Shanghai University of Sport.Production and hosting by Elsevier B.V.All rights reserved.
Barefoot;Forefoot strike;Gastrocnem ius;Muscle activity;Rearfoot strike;Running
1.Introduction
In modern times,runners usually land on theirheels using cushioned running shoes to absorb the impact.1—3The differences in foot position during landing are used to classify various running styles;“toe-heel-toe”running or forefoot strike(FFS),“flat-footed”running w ith a m idfoot strike (MFS),or“heel-toe”running w ith a rearfoot strike (RFS).4—6The majority of habitual barefoot runners FFS or MFS,while the majority of habitual shod runners RFS.5—9Due to the lower occurrence of both FFS and MFS runners (5%—25%),they are often grouped together as an FFS running style,where the point of impact of the foot occurs anterior to the ankle joint.5,7,8These FFS and MFS running styles w ill result in sim ilar dorsifl exion torques about the ankle and presumably sim ilar muscle activation patterns to absorb that impact.
FFS runners experience no impact peak and lower loading rates of the ground reaction force compared to RFS runners.3,5,10—12Despite the higher load rate and magnitude of the impact peak during RFS running,RFS runners are more prevalent in modern times due to the development of the running shoe w ith a cushioned heel.1Before the cushioned heel in running shoes,humans ran w ithout this protection and likely ran more often on the balls of their feet reducing thelanding impact5,11—14and enhancing the storage and release of energy by the elastic structures in the leg and foot.3,9,13,15
A lthough most runners have a habitually preferred style, they can generally convert from an RFS style to an FFS style orvice versa,when requested.9,15—17For example,some habitually shod RFS runners can readily convert to an FFS style when running barefoot to reduce the pressure on their heels using sim ilar kinematics and mechanics as habitual FFS runners.12,17—19
Generalgaitkinematics(stride length and stride frequency) have been wellstudied when exam ining FFS and RFS running. FFS runners run w ith shorter stride lengths,higher stride frequencies,and shorter contact times w ith the ground.11,16,20FFS runners flex their knees more at strike,shortening their stride.5,16,19Bending the knees shortens the stride length during FFS running,which correspondingly increases the stride frequency.2Additionally a higher stride frequency means each stride takes less time resulting in shorter contact times w ith the ground.11Shorter stride lengths during FFS running also allow the runners to land w ith a more plantarflexed ankle and flatter foot to allow for the toe-heel-toe running style.3,11—14,19
A lthough the kinematics and landing forces have been well studied,the muscle activation patterns of barefoot or FFS running have been lesscommonly exam ined.19,20HabitualRFS runners activate their calfmuscles differently in amplitude between barefoot and shod running.20For example,the preactivation amplitude of the medial and lateral gastrocnem ius muscles(MG and LG)are 24%and 14%greater,respectively, when barefoot compared to the shod condition using an RFS style.20The EMG amplitude of the gastrocnemius jumps to 400%—450%for the pre-activation,increases by only 28% during the stance phase,and are sim ilar during the take-off phase during FFS running compared to thatof RFS running.19The pre-activation of the plantarflexor muscles before landing would increase tension in the Achilles tendon allow ing absorption of the impactof landing.2,19,21Furthermore,the activation of the plantarflexor muscles w ill stretch the tendons in the shank and foot,allow ing for enhanced storage of energy in these elastic structures.9,20Instead of muscle activation amplitude,the currentstudy focuseson the tim ing of the plantarflexor activation during FFS and RFS running.
We hypothesize that consistent FFS runners will activate their gastrocnem iimuscles earlier than consistent RFS runners in order to stiffen the ankle,12,16resist the ground reaction forces acting to dorsiflex the ankle,13,19,22and lessen the internal ankle forces.18We also hypothesize that runners who sw itch between FFS and RFS styles depending on their footwear condition w ill change their muscle activity patterns as they sw itch between running styles to accommodate the different stride and joint kinematics during FFSvs.RFS running.3,12,13,16,18,19The current study aims to determ ine the muscle activity and stride patterns used to compensate for the different impact forces of barefootand shod running,allow ing insight into how FFS and RFS running styles influence the activity patterns of the gastrocnem ii muscles and joint kinematics.
2.M aterials and methods
2.1.Subjects
Forty runners(20 males and 20 females,ages 18—56,mean age=29.0±11.9 years)were recruited from Harvey Mudd College and the surrounding community.The subjects measured 1.72±0.10 m in height and 65.15±10.74 kg in weight.Of the 40 subjects,21 were recreational runners who ran at least 8 miles per week for more than 1 year,while 19 subjects trained regularly and ran competitively,including ultramarathons.Four subjects self-reported using minimal running shoes,two subjects self-reported using Vibram Five-Finger shoes,and allother subjects used typical running shoes. The subjects were instructed to run com fortably at all speeds, w ith no instructions to use or convert to any particular foot strike pattern.All experiments were performed w ith Institutional Review Board approval from Harvey Mudd College and the Claremont Graduate University.
2.2.Running regimen
Subjects ran on a motorized treadm ill at 2.5,2.8,3.2,and 3.5 m/s while wearing five-toed lightweight toesocks(45 g; Injinji,San Diego,CA,USA),which we considered to simulate being“barefoot”,and in a neutral running shoe(Asics GELCumulus).5,9,23Subjects wore thin toesocks during the“barefoot”condition to hold in place and protect the pressure sensors as well as to prevent injury to the runners from the textured treadm ill belt(see Section 2.3;Fig.1).Since running in unloaded diving socks and Vibram FiveFinger shoes adequately imitate the mechanics and energetics of running barefoot,wearing lightweight five-toed socks should also adequately mimic barefoot running even though the sensory feedback may differ slightly.9,11,13The order of speeds while barefoot or shod was random ized.Each subject fi rst ran at a self-selected com fortable speed for 2 m in.Then,the subjects ran for1 min to become adjusted to the new speed before a 30-s data collection period.
2.3.Gait kinematics
The tim ing of the stride cycles was determ ined from plantar pressures measured on the bottom of the foot.These plantar pressure forces were collected at4000 Hz with a w ireless data logger and four circular,0.5′′-diameter force sensing resistors placed below the metatarsal heads of the 1st,4th,and 5th toes and the heel pad(Fig.1;M yomonitor IV;Delsys Inc.,Natick, MA,USA;Interlink Electronics,Camarillo,CA,USA).24The pressure sensor system allowed for immediate collection and processing of 20—30 sequential steps.11,20The pressure sensors were protected and held in place by five-toed socks (Injinji).Plantar pressure recordings were used to determ ine the average stride frequency,which in combination w ith running speed,further provided average stride length.The fraction of the stride period,where plantar pressure was measurable,underestimated the stance phase,because theplantar pressures did not include the last portion of stance between when the pressure is generated from the balls of the feet to the toes.
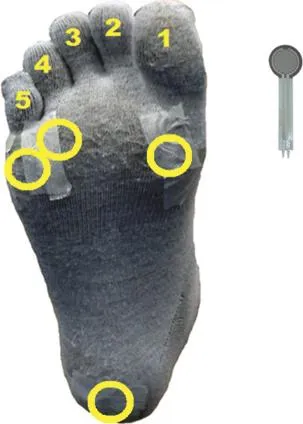
Fig.1.Locations of pressure sensors on the bottom of the right foot(yellow circles).The sensors were placed underneath the 1st,4th,5th metatarsalheads and the m iddle of the heelpad and adhered w ith paper tape to the lightweight toesock.
The duty cycle,or the fraction of the stride during which one foot was on the ground,was determ ined from the light video(208 fps;AVT Pike 032C Camera,A llied Vision Technologies,Newburyport,MA,USA).
2.4.Foot strike angle(FSA)determined running style
To determine the running style(FFSvs.RFS)used by each runner,FSA was measured at each speed under both barefoot and shod conditions(Fig.2).FSA,the angle between the horizontaland the line from the ankle to the 5th toe at the time of contact between the runner’s foot and the horizontal,was corrected for the rest angle(Fig.2).6Runners were recorded w ith a high-speed light camera for 6 s of the 30 s recording period(208 fps).Each video trial included at least seven complete strides of running at each speed for each condition. To categorize each trial,FSA<8°represented an FFS trial and FSA>8°represented an RFS trial(NIH ImageJ;Fig.2).6The average FSA across the four speeds for each subject determ ined if the individual ran w ith an FFS or RFS style when barefoot and when shod.Consistently FFS(CFFS) runners always used an FFS style and consistently RFS (CRFS)runners used an RFS style during both footwear conditions.Runners in the“shifter”group used an FFS when barefoot and an RFS when shod.
2.5.Measuring activity(electromyographical)patterns of the calf muscles
Surface electromyography(sEMG)determ ined the activity patterns of the medial and lateral gastrocnemii muscles w ith a w ireless data logger and a laptop computer(Myomonitor IV;EMGworks,Delsys Inc.)The subjects wore the myomonitor around their waist w ith the provided adjustable belt.Over the surface of each muscle,the hair was shaved,if necessary,and the skin surface was lightly exfoliated to increase electrode conductance.Bipolar electrodes(Delsys) were adhered lengthw ise along the medial and lateral gastrocnem ii muscles one-third of the way down the tibia and at the m idpoint of the muscle based on measurements made by a B-mode,real-time ultrasound machine(210DX;7.5 MHz linear transducer,Medasonics,Mountain View,CA,USA).25The w ires between the right foot and hip were secured to the leg w ith self-adherent athletic w rap to m inim ize movement artifact in the sEMG signal.The M yomonitor,used for collecting sEMG and plantar pressure data,acquired signals at 4000 Hz for 30 s intervals at each speed w ith recording started by a manual trigger(EMGworks).
Three maximum voluntary contractions(MVC)were recorded by having subjects perform a series of 1 s,maximaleffort seated calf raises at a calf raise weight machine (background of Fig.2).The sEMG amplitude of the MVC was used to normalize the sEMG amplitudes of the gastrocnemii muscles for each individual.The contractions were isometric, if the subject could not lift the weights,or maximally concentric contractions,if the subject could lift all the weights.
To relate muscle activation to the start of each stride,the plantarpressure recordings were used to quantify the tim ing of the foot contact w ith the ground(foot strikes)for each stride, and these time points were used to distinguish the startof each stride in the sEMG patterns.An average stride was generated for each subject at each speed and footwear condition,by overlaying and averaging the sEMG patterns for each stride using custom-w ritten software (MATLAB;Mathworks, Natick,MA,USA).As with the kinematics,the initial contact determ ined by the plantar pressure recordings was corrected for the initial contact determ ined by high-speed light video (208 fps).
The sEMG signals were fi ltered using a second order Butterworth band-pass fi lter from 20 to 400 Hz w ith a 60 Hz notch fi lter.The signal was then rectified and smoothed using a moving average fi lter(MATLAB).The MVC signals were fi ltered and recorded in the same way as the running sEMG data.The sEMG amplitude of each speed was determ ined by averaging the strides to create an average signalateach speed then finding the maximum value from the average stride.25Each sEMG signal was also binned and averaged based on a percentage of the gait cycle to determ ine the timing of the muscle activation patterns for each speed.Custom-w ritten MATLAB software was used to quantify the onset and offset of each sEMG signal.The tim ing of the smoothed sEMG signal was determined to have a positive or negativefi rst derivative for onsets and offsets,respectively,and exceeded the threshold of two standard deviations beyond the average noise of the relaxed muscle.
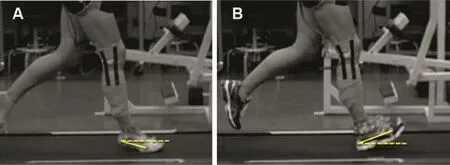
Fig.2.Foot strike angle(FSA)determ ined the two strike types differentiated during running.A representative shifter running at 3.2 m/s w ith a positive FSA (yellow)during a forefoot strike while barefoot(A),and a negative FSA during a rearfootstrike while shod(B).The FSAwas measured as the angle between the line from the 5th metatarsal marker to the heel marker(solid yellow)and the horizontal(dashed yellow)at the beginning of stance.
2.6.Joint kinematics of the leg
Three-dimensional(3D)joint kinematics,or joint angle patterns,were collected while subjects ran on the treadm ill using three high-speed cameras(Oqus,148 Hz;Qualisys Motion Capture System;Deerfi eld,IL,USA).Two-cm, spherical,reflective markers were adhered on the right side of each subject centered on the axis of rotation of five joints (greater trochanter of the femur(hip),the lateral condyle of the femur(knee),the lateral malleolus(ankle),and the fi rst and fi fth MTP)to determ ine the major joints angles of the leg.An additionalmarker was placed on the lateral surface of the calcaneus(heel)over the sock or the shoe to obtain the FSA(Fig.2).When barefoot,the calcaneus and MTP markers were placed above the sock;when shod,these markers were placed on their corresponding locations on the shoes.The cameras em it and measure only infrared light. Therefore,each marker simulates the joints and is used to create a computer generated 3D-model that tracks the movement of each subject(Qualisys Motion Caption System).
The 3D position of each marker was used to quantify the joint angle patterns(Qualisys Motion Caption System).The tim ing of each heel strike from the pressure sensors was used to divide the 30-s trial into gait cycles(MATLAB).The gait cycles were then averaged to determ ine a typical stride for each joint at each speed under both conditions per subject. Because the plantar pressure sensors determ ined the onset of pressure of the m iddle of the heel or the base of the MTP joints,the average gait cycle was then corrected for the initial contact as determined by high-speed light video(208 fps).
2.7.Statistics
Tim ing(sEMG onset,offset,duration)and amplitude of muscle activation were compared between the FFS,RFS,and shifter groups to exam ine the variability between the three running styles.The muscle activity and kinematic variables were analyzed using analysis of variance(ANOVA),paired and unpairedttests.Values from the groups were considered significantly different whenp<0.05.A ll values are reported as mean±SD.To m inim ize clutter,we present the values for the representative speed of 3.2 m/s periodically.
3.Results
3.1.Three categories of runners
The CFFS runners included individuals who always landed w ith an FFS under both barefoot and shod conditions,and consisted of 11 individuals:five men and six women;six recreational and five competitive runners.The CRFS runners included 11 individuals who always landed on their heels when barefoot and shod:six men and fi ve women;six recreational and five competitive runners.The shifter group included 18 individuals who ran w ith an FFS when barefoot and an RFS when shod:10 men and eight women;seven recreational and 11 competitive.There were no differences between the runners of the three groups in age,weight,height,and hip height(p>0.05).The joint kinematics for two shifters(1 male,1 female;1 recreational,1 competitive)were unusable and om itted from the dataset.
3.2.FSA,stride frequency,and stride length increased with running speed for all runners
When not considering footwear condition or type of runner, FSA increased slightly w ith speed(p<0.05;n=40;Table 1). FSA,however,varied considerably w ithin each speed and more w ith footwear condition than w ith speed(see Section 3.3;Figs.2—4).Overall,stride frequency increased by 0.09 Hz per 1 m/s(p<0.05;n=39;Table 1;Fig.3).Average stride length also increased w ith speed,w ith an increase of 0.6 m w ith each 1 m/s(p<0.05;n=40;Table 1;Fig.3).Average duty cycle for the runners decreased by 7.8%per 1 m/s increase in speed(p<0.05;n=39;Table 1).
3.3.Barefoot runners tend to FFS
Overall,runners generally landed more on their forefeet when barefoot(FSA=-0.2°±10.0°;n=40)and theylanded more on their heels when shod at each speed (FSA=13.4°±9.9°;n=40;p<0.05).CFFS runners always landed on their forefeet when barefoot and shod and CRFS runners always landed on their heels whether barefoot or shod (p<0.05;Table 2).Shifters tended to land on their forefeet when barefoot and on their heels when shod(Table 2;Fig.2). The FSA of barefoot shifters was similar to those of CFFS runners and the FSA of shod shifters was similar to that of CRFS runners(p>0.05).Overall,barefoot runners tended to land on their forefeet and shod runners generally landed on their heels(Table 1;p<0.05;n=40).
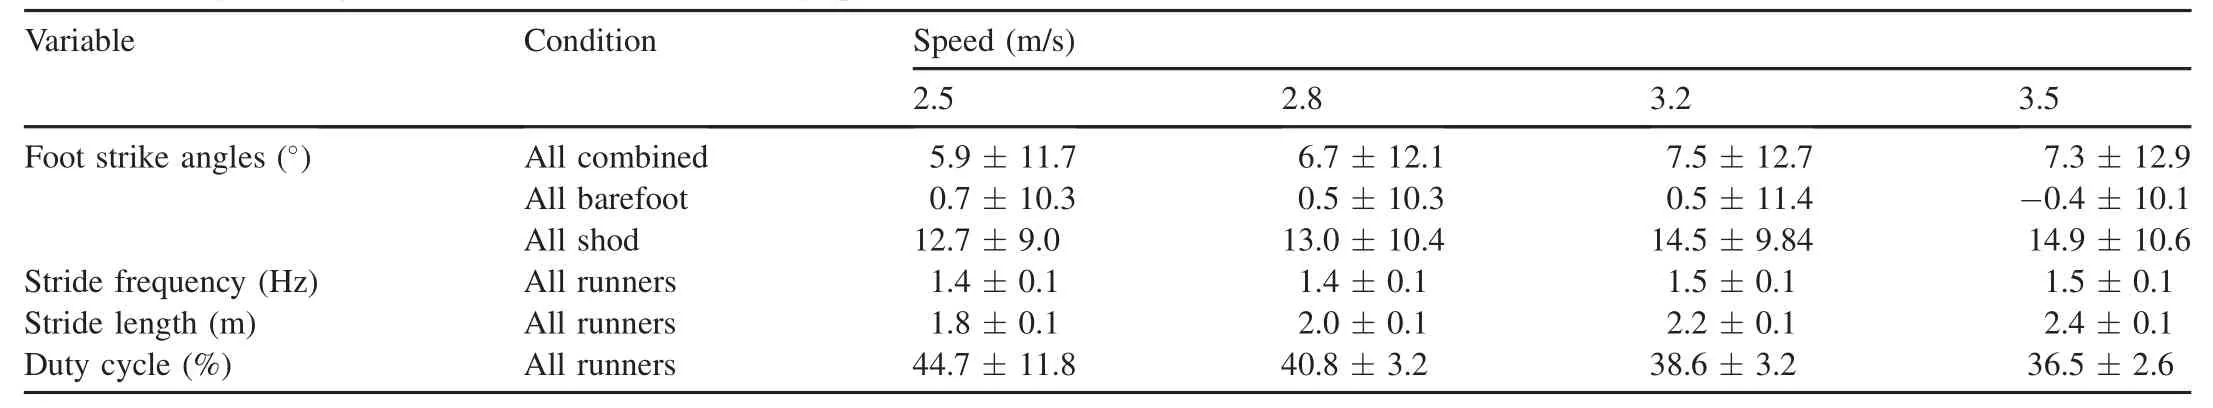
Table 1 Foot strike angles and gait kinematics at different running speeds(mean±SD).
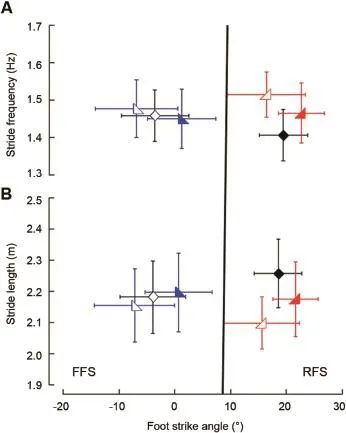
Fig.3.Stride frequency and stride length of the three groups of runners at 3.2 m/s.Open symbols represent the barefoot condition,while solid symbols represent shod.Symbols and error bars represent the mean± SD of the consistently forefoot strike(CFFS;blue),consistently rearfoot strike(CRFS; red),and shifter(black)groups.Vertical line indicates the foot strike angle division between FFS(<8°)and RFS(>8°)runners.6(A)Barefoot runners use higher stride frequencies.When grouped,CFFS(blue,left-biased triangles), CRFS(red,right-biased triangles),and barefoot shifters(open black diamonds)run w ith similar stride frequencies.Shod shifters(closed black diamonds)run with lower stride frequencies.(B)Barefoot runners use longer stride lengths.When grouped,CFFS,CRFS,and barefoot shifters run w ith sim ilar stride lengths.Shod shifters run w ith longer stride lengths.
3.4.Gait kinematics differed for barefoot and shod running
In general,barefoot running increased stride frequency compared to shod running by 1.5%—4.5%(Table 2;n=40;p< 0.05).When grouped,the stride frequencies of CFFS runners were sim ilar to those of the CRFS runners.Both CFFS and CRFS runners ran w ith stride frequencies sim ilar to barefoot shifters(Table 2;p>0.05;Fig.3A;n=18).By contrast,the shod shifters(RFS)ran with a lower stride frequency than all the other groups,including the barefoot shifters(FFS)(Table 2;p<0.05;Fig.3A).These trends were consistent at all four speeds,at which shod shifters ran w ith lower stride frequencies than barefoot shifters,CFFS runners, and CRFS runners(p<0.05).
Shod shifters(RFS)ran w ith longer strides(i.e.,more overstride)than CFFS runners,CRFS runners,and barefoot shifters(FFS)(Table 2;p< 0.05;Fig.3B).Additionally, w ithin each of the three groups,running barefoot shortened stride lengths compared to running shod by 1.5%—4.9% (n=40;p<0.05).
At each speed,shifters ran w ith 4.2%—6.7%lower duty cycles when barefoot than shod.CRFS runners also used lower duty cycles when barefoot than when shod(Table 2;p< 0.05).By contrast,the duty cycle for CFFS runners remained constant between barefoot and shod conditions (Table 2;p>0.05).Shod CFFS runners used 7.4%—11.1% lower duty cycles than shod CRFS runner(Table 2).When shod,those in the CFFS group ran w ith lower duty cycles than those in the CRFS group(Table 2;p<0.05).When barefoot, the two groups ran w ith sim ilar duty cycles(Table 2;p>0.05).
3.5.Shank angle at initial contact varied similarly
The landing or shank angle relative to the vertical(λin Fig.4C)at initial contact in CFFS runners(2.4°±3.2°)was slightly more vertical compared to CRFS runners(8.4°±4.1°;n=11 each;p< 0.05;Fig.4B).Barefoot shifters(FFS) (3.6°± 2.9°)landed w ith the shank similarly vertical like CFFS runners,whereas shod shifters(RFS)(8.3°± 4.0°) landed w ith their legs positioned like CRFS runners(Fig.4B;n=16;p<0.05).The landing angle w ithin CFFS and CRFS groups was similar between barefoot and shod conditions (p>0.05;Fig.4B).In all,FFS runners landed w ith a more vertical shank,indicating less overstride,than RFS runners who landed w ith their foot angled farther in front of them (Fig.4B).The landing angle at initial contact remained constant across all speeds for all groups.
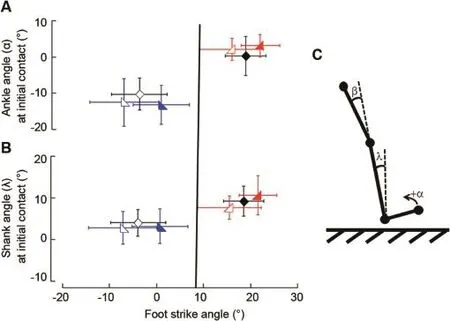
Fig.4.Ankle and lower leg kinematics at the beginning of stance for the three groups of runners at3.2 m/s.Open symbols represent the barefootconditions,while solid symbols represent shod.Symbols and error bars represent the mean±SD of the consistently forefoot strike(blue),consistently rearfoot strike(red),and shifter(black)groups.Vertical line indicates the footstrike angle(FSA)division between a forefootstrike(<8°)and a rearfootstrike(≥8°)runners.6Ankle(A) and shank(B)angles at the initial contact for the three groups of runners increase w ith FSA.(C)The ankle(α),knee(β;notplotted;see text),and shank(λ)angles examined.The ankle angle is determined relative to a 90°angle,where positive denotes dorsiflexion.The knee angle is determined relative to a straight leg and the shank angle is relative to the vertical.
CFFS runners landed w ith their knee more flexed (16.0°±4.5°)than did CRFS runners(9.5°±6.5°;n=11 each;p<0.05).Both CFFS and CRFS runners did notalter theirknee kinematics when barefootcompared to when shod(p>0.05). However,barefoot shifters(FFS)(12.7°±4.2°)landed w ithmore flexed knees compare to shod shifters (RFS) (8.71°±5.9°;n=16 subjects at four speeds under two conditions;p< 0.05).For the knee angle at landing,barefoot shifters(FFS)did not differ from CFFS runners and shod shifters(RFS)did not differ from CRFS runners(p>0.05). Knee angles at initial contactdid notchange w ith speed forall groups.
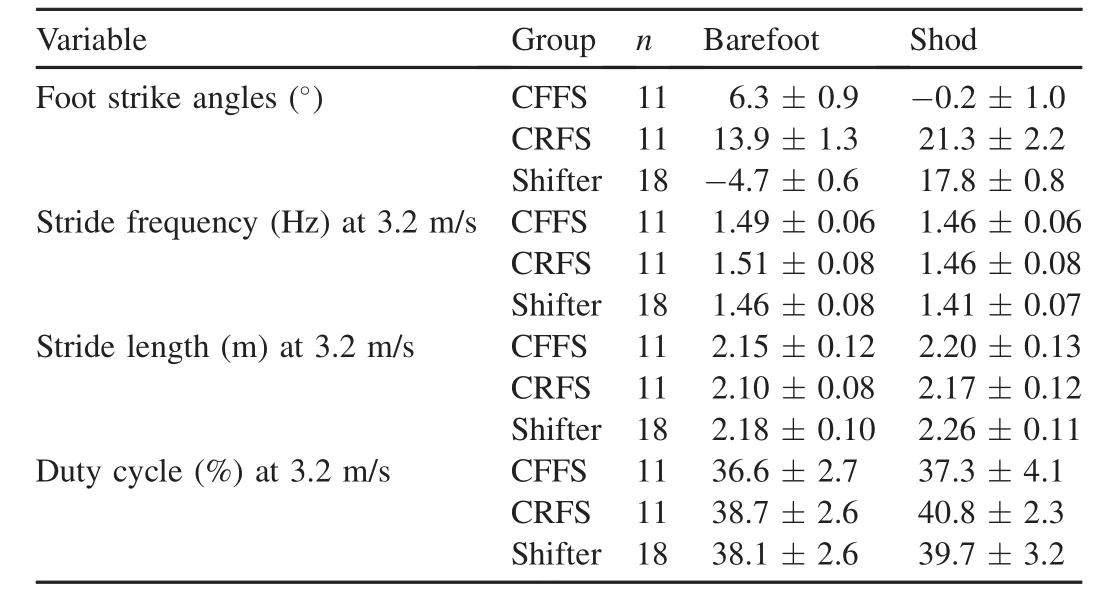
Table 2 Foot strike angles and gait kinematics of the groups when barefootvs.shod (mean±SD).
CFFS runners landed w ith their ankles(-13.0°±5.8°)in more plantarflexion than did CRFS runners(1.9°± 3.7°;n=11 each;p< 0.05;Fig.4A).Barefoot shifters(FFS) (-10.5°± 4.4°)landed w ith their ankles similarly plantarflexed like CFFS runners,whereas shod shifters(RFS) (0.0°±5.3°)landed w ith their ankles positioned similarly to that of CRFS runners(n=16;p<0.05;Fig.4A).The ankle angle at initial contact in CFFS runners was sim ilarly plantarflexed when barefootcompared to shod(p>0.05;n=11; Fig.4A).This angle in CRFS runners was similarly dorsiflexed when barefootand shod(p>0.05;n=11;Fig.4A).In all,FFS runners,regardless of group,landed w ith a more plantarflexed ankle joint than RFS runners,regardless of group.Ankle angle at initial contact remained constant across all speeds for all groups.
The clearest difference in joint kinematics was the movement of the ankle joint just after the initial contact(Fig.5). A ll FFS runners,including barefoot shifters,landed w ith more plantarfl exed ankle joints,and then dorsiflexed during the fi rst half of the stance phase(Fig.5A).A ll RFS runners, including shod shifters,landed w ith more dorsiflexed ankles, then immediately plantarflexed the beginning of stance (Fig.5C).
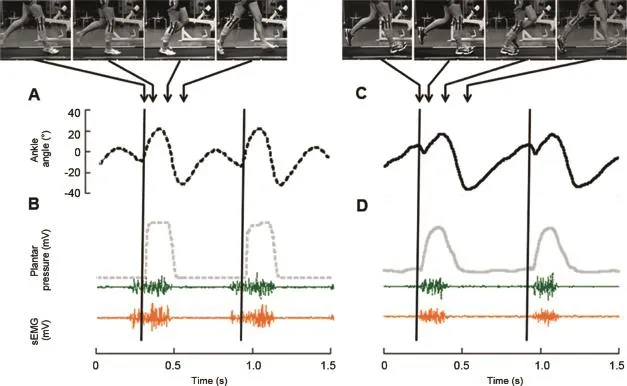
Fig.5.Ankle kinematics,plantar pressures,and muscle activity patterns of a representative shifter where the vertical lines represent the beginning of stance while running at3.2 m/s.In each seriesofarrows,the fi rstarrow indicates the initialcontactand the 4th arrow indicates the end of stance.These recordingswere obtained from the same representative individual as shown in Fig.2.(A)When barefoot,the ankle dorsifl exes immediately upon landing.(C)When shod,the RFS runner lands on their heels and immediately plantarflexes after heel strike.(B),(D)The activity patterns of the lateral gastrocnem ius(green,upper)and medial gastrocnemius(orange,lower)muscles of the forefoot strike runner activate earlier than that of the rearfoot strike runner.
3.6.Running speed altered muscle activity patterns of calf muscles
A ll runners activated and deactivated both medial(MG)and lateral gastrocnemii(LG)muscles earlier in the stride as they ran faster(Table 3;Fig.6;n=40;p<0.05).The changes in the tim ing ofactivation patterns of the gastrocnem iiw ith speed were sim ilar amongst runners regardless of strike type or footwear condition(n=40,Fig.6).The MG and LG activated and deactivated at sim ilar times at each speed(Table 3;p>0.05;Fig.6).The activation durations for the MG and LG did not vary w ith speed(Table 3;p>0.05;Fig.6).
The activation amplitudes of the MG and LG increased w ith running speed in all runners(Table 3;p<0.05;n=39). Unlike the other activation parameters,activation amplitude did notdiffer between barefootand shod conditions.In all,the amplitudes of the MG exceeded that of the LG at the two lower speeds(p< 0.05),but matched at the two higher speeds.
3.7.FFSs activate calf muscles earlier
CFFS runners activated their MG muscles 7.7%—16.3%of the gait cycle earlier than CRFS runners at 2.5,2.8,3.2,and 3.5 m/s(Table 3;p<0.05;Fig.6).Barefoot shifters(FFS) also activated their MG at the four speeds(Figs.5 and 6) earlier than shod shifters(RFS)(p< 0.05).CFFS runners, when both barefoot and shod,activated the MG muscles at similar times to the barefootshifters(Fig.6).Correspondingly, CRFS runners when barefoot and shod activated their muscle at sim ilar times to the shod shifters(RFS)at the four speeds (p>0.05;Fig.6).
The tim ing of LG activation followed the same trends as thatof the MG for all runners(Fig.6).CFFS runners activated their LG muscles 7.7%—13.1%of the gait cycle earlier than CRFS runners at all speeds(p< 0.05;Fig.6).Barefoot shifters(FFS)activated their LG earlier than shod shifters (RFS)at all speeds(Table 3;p<0.05).Barefoot and shod CFFS runners activated their LG muscles at similar times to the barefoot shifters(FFS)at all speeds(Fig.6).Correspondingly,barefoot and shod CRFS runners activated their LG atsimilar times to shod shifters(RFS)(Table 3;p>0.05; Fig.6).
3.8.Calf muscle deactivation time did not depend on running style
All runners deactivated their calf muscles sim ilarly regardless of footwear condition or strike type(p> 0.05; Table 3).In all,runners have sim ilar MG offset times when barefoot(42.4% ± 6.0% gait cycle)and when shod (44.6%±5.8%gait cycle;p>0.05;n=40).In all,runners have sim ilar LG offset times when barefoot(42.7%±7.7% gait cycle)and when shod(44.7% ± 7.9%gait cycle;p>0.05;n=40).
3.9.FFSs activate calf muscles longer
CFFS runners activated their MG muscles on average 9.7% of the gait cycle longer than CRFS runners(n=11 each;p<0.05;Fig.6).Barefoot shifters(FFS)activated their MG muscles longer than shod shifters(RFS)ateach speed(n=18;p<0.05).MG activation in CFFS runners lasted sim ilar durations when barefootand shod,and sim ilar to thatofbarefoot shifters(FFS)(p>0.05).CRFS runners,when both barefoot and shod,activated their MG activation in similar duration to the shod shifters(RFS)(p< 0.05;Fig.6).Overall,runners activated their MG muscles longer when landing w ith an FFS than w ith an RFS(Fig.6).
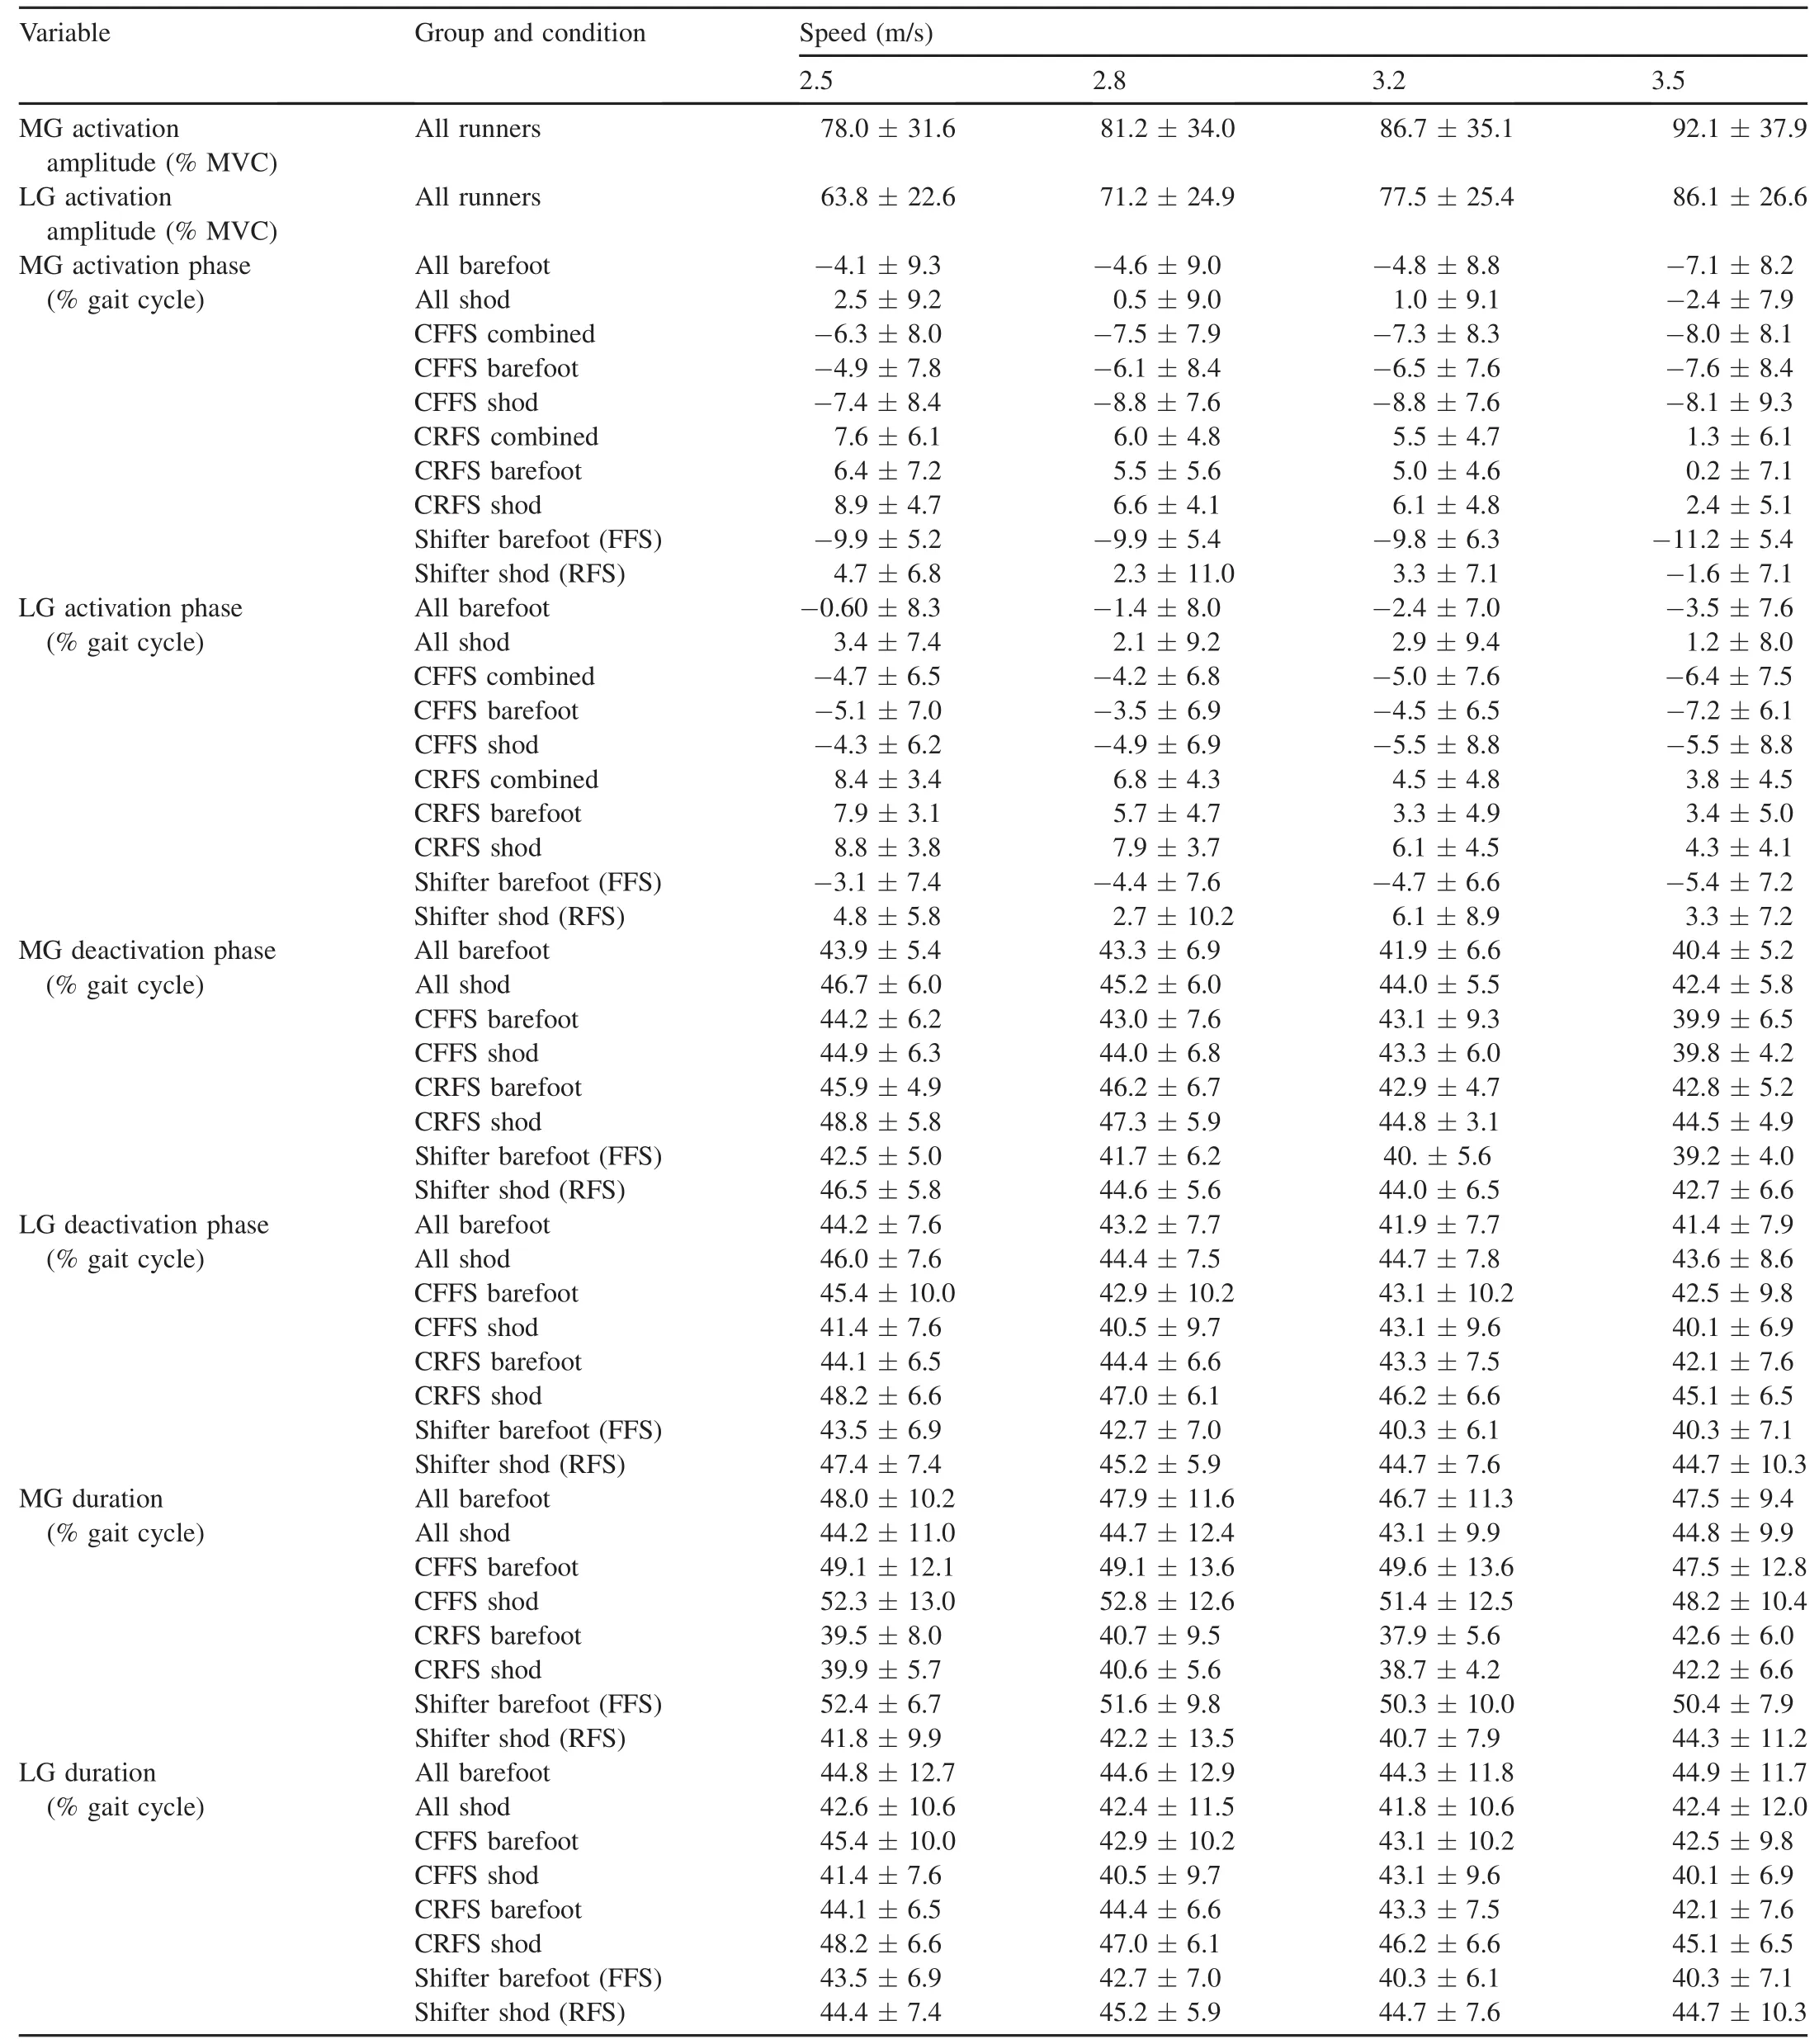
Table 3 Muscle activity patterns at different running speeds(mean±SD)(n=40).
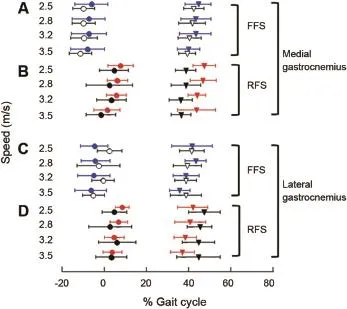
Fig.6.Muscle activity patterns of the medial gastrocnemius(MG)(A,B)and the lateralgastrocnem ius(LG)(C,D)during the gaitcycle,where 0 represents the beginning of stance.Symbols(mean±SD)represent the normalized onset (circles)and offset(triangles)times of the muscle activity patterns.Vertical axis for the four panels indicates speed.(A)MG activity patterns during running for forefoot strike(FFS)runners,which include consistently forefoot strike(CFFS;blue)and barefoot shifters(open black).(B)MG activity patterns during running for rearfoot strike(RFS)runners,which include consistently rearfoot strike(CRFS;red)and shod shifters(closed black).(C)LG activity patterns during running for FFS runners,which include CFFS(blue) and barefootshifters(open black).(D)LG activity patterns during running for RFS runners,which include CRFS(red)and shod shifters(closed black).
Similarly,CFFS runners activated their LG muscles 6.3%—14.3%of the gait cycle longer than CRFS runners at the four speeds(Table 3;p<0.05;Fig.6).CFFS runners,when both barefoot and shod,activated their LG for durations sim ilar to that of barefoot shifters(FFS)(n=11).Shifters activated the LG muscles longer when barefoot(FFS)than when shod (RFS).CRFS runners,when both barefootand shod,activated their LG for durations sim ilar to the shod shifters(RFS) (n=11,Fig.6).In general,runners activated their LG muscles longer when running w ith an FFS style than when running w ith an RFS style(Table 3;Fig.6).
4.Discussion
Runners were categorized into three groups based on the strike type when running barefoot and shod.Of the 40 subjects,11 individuals(27.5%)were CFFS runners,landing only on their forefeet whether running barefoot or shod,whereas CRFS runners landed only on their heels when barefoot and shod(n=11;27.5%).The remaining subjects(n=18;45%) used an FFS style when barefoot and then shifted to an RFS style when shod.Runners who CRFS or CRFS when both barefoot and shod have been studied previously.5,9,14,16,17However,almost half of the runners in the current study shifted their running style between an RFS when shod and an FFS when barefoot.12
Within a given group or footwear condition,an increase in speed increases both stride length and stride frequency (Table 1).11,15,20Barefoot runners generally run w ith shorter stride lengths and higher stride frequencies and are more likely to FFS than shod runners(Fig.3).3,11,15,16,20Shorter stride lengths attenuate the shock wave caused by the heel strike at initial contact2and may also reduce decelerations that occur w ithin running strides,due to more vertical ground reaction forces.26Interestingly,CFFS and CRFS runners used sim ilar stride lengths and frequencies at a given speed and footwear condition(Fig.3).Shod shifters,however,use longer stride lengths and higher stride frequencies and duty cycles than all othergroups(Fig.3).Runners who change their running style also modulate their stride length and stride frequency.Notably, runners w ith consistent styles,whether FFS or RFS,have stride lengths,stride frequencies and duty cycles sim ilar to each other across groups.The similar stride lengths,frequencies,and duty cycles between CFFS and CRFS runners may relate more to training level than foot strike pattern. Sometimes,training shortens stride lengths27,28but elite training lengthens stride lengths.29In our subjects,even though the levelof training and m ileage did notdiffer between the three groups,these effects may mask differences in stride length.When training level is controlled(e.g.,in the shifters), FFS barefoot runners shorten their stride lengths compared to the RFS shod runners(Fig.3).11,16,20Only the shod shifters ran w ith longer stride lengths(Fig.3).These shod runners may be using the cushioning of the shoe to attenuate the increased shock experienced through the leg and decrease energy absorption when running w ith longer stride lengths.2
Shorter strides during FFS running also correlate w ith more vertical landing angles(less overstride;Fig.4).3FFS runners land w ith their shank more vertical(2°)compared to RFS runners(8°).Barefoot RFS runners also land with a more vertical shank compared to shod RFS runners.16This vertical landing angle in FFS runners likely functions to m inim ize ankle moments.2
FFS runners slightly plantarflex(-12.5°)their ankle joints at impact,RFS runners slightly dorsiflex their ankle joints (1.2°;Figs.4 and 5),3,11—14,19while shifters alter their kinematics to correspond to the two styles of running.Typically, running involves a quick plantarflexion at heel contact before dorsiflexion,2,4,16,26,30—32but only for RFS runners(Fig.4).3,5The ankle may passively plantarflex due to the“toe-down”torque generated by the heel contact posterior to the ankle joint.33The plantarflexion immediately after heel contact is possibly passive because the fast-tw itch plantarflexors are likely not generating force yet(Fig.5;see Section 3.7).By contrast,FFS runners only dorsiflex upon initial contactat thebeginning of stance(Figs.4 and 5).3,5,9,17,22,34The foot strike style seems to determ ine not only the ankle angle at initial contact,but also the direction of the ankle rotation during the fi rst half of stance(Fig.4).3,9,19In fact,the ankle movement during the fi rst half of the stance phase could be used as a method to determ ine whether a runner uses an FFS or an RFS style using only joint kinematics(Fig.5).5
CFFS runners activate their gastrocnem iimuscles earlier by~11%of the stride duration and longer by~10%of the stride duration relative to CRFS runners,as hypothesized (Fig.6).Again,shifters adjust their muscle activity patterns based on their footwear condition conform ing to the patterns of the consistent or“habitual”runners of a single style.The muscle activity patterns and joint kinematics of the barefoot shifters(FFS)are indistinguishable from those in the CFFS and shod shifters(RFS)are indistinguishable from CRFS runners(Figs.4—6).
Earlier activation of the plantarflexor muscles w illnotonly plantarflex the ankle joint to prepare for landing,but also increase the capacity of the passive structures to store elastic energy at the beginning of stance.5,9,15When the gastrocnem ii muscles activate,the muscle fibers contract and begin to shorten the muscle just before initial contact of the foot. During an FFS,if the muscles were passive,dorsiflexion at the initial contactwould stretch the gastrocnemiimuscles(Fig.5). In FFS runners,the force of landing is immediately counteracted by the earlier and longer contractions of their plantarflexormuscles,which stabilizes the ankle jointand smoothens the tendon force development.35The pre-activation of the gastrocnem ii muscles also increases the immediate storage capacity of the elastic tissues in the shank by stretching the Achilles tendon before landing.36,37If the tendon is in tension before landing,then the force of landing would stretch the tendon more,allow ing for greater storage of elastic energy. Increased storage of elastic energy in the connective tissue of the tendon and aponeurosis w ill increase the force output of the plantarflexors during the latter,energy-producing phase of stance.26,36,37
Earlier activation of plantarflexors before dorsifl exion at initial contact also enhances the performance of the active components operating at the ankle.For example,the elastic energy can be stored in the activated cross-bridge springs w ithin the sarcomeres during the fi rst20%—25%of the stance phase when the gastrocnem ii operate nearly isometrically.31,38Active pre-stretch enhances work generated in muscle39or amplifi es power production from a jointsystem.21Finally,titin stiffness varies w ith activation level.40Increased activation of titin w ill lead to the storage additional elastic energy to enhance force after active lengthening.41Several active mechanisms in muscle could function independently or in concert to enhance plantarflexion during the latter,energyproducing phase of stance during running.
Longer activation of the plantarflexors in FFS running implies greaterplantarflexor forces and possibly an increase in energetic cost when using this style.Studies have shown varied results,however.Barefoot running can lower the energetic cost of running by 2.8%when compared to shod running,but this increase in energetic cost may be caused by the extra weight of the shoe.13When controlled for mass, barefoot FFS running increases metabolic cost of running by 3%—4%compared to shod FFS running.42Alternatively,FFS running can be more 2.4%more economical than RFS running in m inimal shoes.9Finally,there can be no difference between FFS and RFS running either in m inimal shoes or w ith standard shoes.15The increased costof increased activation may or may notbe negated by the elastic energy stored in and subsequently returned by the foot arch,the Achilles tendon,and/or the plantarflexors.
Habitual runners of one style may convert temporarily to using different foot strike patterns to adequately m im ic the mechanical loading condition.17,18However,the difference of the muscle activation patterns in FFS running compared to RFS running indicates possible re-training of the motorpattern for a runner.43,44Transitioning from an RFS to an FFS style can require many months to build the proper musculature to m inim ize injury and include modifying one’s muscle activation and kinematic patterns.
Acknow ledgm ents
We thank John M ilton(Keck Science Department)for use of Qualisys and Delsys equipment,Jennifer Tave assistance w ith data collection,Ivo Ros and Daniel Lieberman for discussions,Rachel Roley for assistance in collecting and analyzing the foot strike data.Funding was provided by the Purves Summer Research Award,Sherman Fairchild Foundation,National Science Foundation(NSF-0634592),and Howard Hughes Medical Institute Undergraduate Science Program award 52006301 to Harvey Mudd College.
1.Nigg BM.Biomechanics of running shoes.Champaign,IL:Human Kinetics Publishers;1986.
2.Derrick TR,Hamill J,Caldwell GE.Energy absorption of impacts during running at various stride lengths.MedSci Sport Exerc1998;30:128—35.
3.Lieberman DE.What we can learn about running from barefoot running:an evolutionary medical perspective.Exerc Sport Sci Rev2012;40:63—72.
4.Bobbert MF,Yeadon MR,Nigg BM.Mechanical analysis of the landing phase in heel-toe running.J Biomech1992;25:223—34.
5.Lieberman DE,Venkadesan M,Werbel WA,Daoud AI,D’Andrea S, Davis IS,et al.Foot strike patterns and collision forces in habitually barefoot versus shod runners.Nature2010;463:531—5.
6.A ltman AR,Davis IS.A kinematic method for footstrike pattern detection in barefootand shod runners.Gait Post2012;35:298—300.
7.Hasegawa H,Yamauchi T,Kraemer WJ.Foot strike patterns of runners at 15-km point during an elite-level half marathon.J Strength Cond Res2007;21:888—93.
8.Larson P,Higgins E,Kaminski J,Decker T,Preble J,Lyons D,etal.Foot strike patterns of recreationaland sub-elite runners in a long-distance road race.J Sports Sci2011;29:1665—73.
9.Perl DP,Daoud AI,Lieberman DE.Effects of footwear and strike type on running economy.Med Sci Sports Exerc2012;44:1335—43.
10.Laughton CA,Davis IM,Ham ill J.Effect of strike pattern and orthotic intervention on tibial shock during running.JAppl Biomech2003;19:153—68.
11.Squadrone R,GallozziC.Biomechanicaland physiologicalcomparison of barefoot and two shod conditions in experienced barefoot runners.J Sports Med Phys Fit2009;49:6—13.
12.Ham ill J,Russell EM,Gruber AH,M iller R.Impact characteristics in shod and barefoot running.Footwear Sci2011;3:33—40.
13.Divert C,Mornieux G,Freychat P,Baly L,Mayer F,Belli A.Barefootshod running differences:shoe or mass effect?Int J Sports Med2008;29:512—8.
14.W illiams DB,Green DH,Wurzinger B.Changes in lower extremity movement and power absorption during forefoot striking and barefoot running.Int J Sports Phys Ther2012;7:525—32.
15.Ardigo LP,Lafortuna C,M inetti AE,Mognoni P,Saibene F.Metabolic and mechanical aspects of foot landing type,forefootand rearfoot strike, in human running.Acta Physiol Scand1995;155:17—22.
16.De Wit B,De Clercq D,Aerts P.Biomechanical analysis of the stance phase during barefootand shod running.J Biomech2000;33:269—78.
17.W illiams DS,M cClay IS,Manal KT.Lower extrem ity mechanics in runners w ith a converted forefoot strike pattern.J Appl Biomech2000;16:210—8.
18.Rooney BD,Derrick TR.Joint contact loading in forefoot and rearfoot strike patterns during running.J Biomech2013;46:2201—6.
19.Shih Y,Lin KL,Shiang TY.Is the foot striking pattern more important than barefoot or shod conditions in running?GaitPosture2013;38:490—4.
20.Divert C,Mornieux G,Baur H,Mayer F,Belli A.Mechanical comparison of barefoot and shod running.Int J Sports Med2005;26:593—8.
21.Roberts TJ,Azizi E.Flexible mechanisms:the diverse roles of biological springs in vertebrate movement.J Exp Biol2011;214:353—61.
22.Novacheck TF.The biomechanics of running.GaitPosture1998;7:77—95.
23.Queen RM,Gross MT,Liu HY.Repeatability of lower extrem ity kinetics and kinematics for standardized and self-selected running speeds.Gait Posture2006;23:282—7.
24.Kanatli U,Yetkin H,Sims‚ek A,O¨ztu¨rk AM,Esen E,Bes‚li K.Pressure distribution patterns under the metatarsal heads in healthy individuals.Acta Orthop Traumatol Turc2008;42:26—30[in Turkish].
25.Ahn AN,Kang JK,Quitt MA,Davidson BC,Nguyen CT.Variability of neural activation during walking in humans:short heels and big calves.Bio Lett2011;7:539—42.
26.W inter DA.Moments of force and mechanical power in jogging.J Biomech1983;16:91—7.
27.Nelson RC,Gregor RJ.Biomechanics of distance running:a longitudinal study.Res Quart1976;47:417—28.
28.Cavanagh PR,Pollock ML,Landa J.A biomechanical comparison of elite and good distance runners.Ann NY Acad Sci1977;301:328—45.
29.W illiams KR,Cavanagh PR,Ziff JL.Biomechanical studies of elite female distance runners.Int J Sports Med1987;8:107—18.
30.Nilsson J,Thorstensson A,Halbertsma J.Changes in leg movements and muscle activity w ith speed of locomotion and mode of progression in humans.Acta Physiol Scand1985;123:457—75.
31.Lichtwark GA,Bougoulias K,Wilson AM.Muscle fascicle and series elastic element length changes along the length of the human gastrocnem ius during walking and running.J Biomech2007;40:157—64.
32.Lohman 3rd EB,Balan Sackiriyas KS,Swen R.A comparison of the spatiotemporal parameters,kinematics,and biomechanics between shod, unshod,and m inimally supported running as compared to walking.Phys Ther Sport2011;12:151—63.
33.W right IC,Neptune RR,van Den Bogert AJ,Nigg BM.Passive regulation of impact forces in heel-toe running.Clin Biomech1998;13:521—31.
34.Thordarson DB.Running biomechanics.Clin Sport Med1997;16:239—47.
35.Kom i PV,Fukashiro S,Ja¨rvinen M.Biomechanical loading of achilles tendon during normal locomotion.Clin Sport Med1992;11:521—31.
36.Roberts TJ.The integrated function of muscles and tendons during locomotion.Comp Biochem Physiol A Mol Integr Physiol2002;133: 1087—99.
37.A lexander RM.Tendon elasticity and muscle function.Comp Biochem Physiol A Mol Integr Physiol2002;133:1001—11.
38.Huxley AF,Simmons RM.Proposed mechanism of force generation in striated muscle.Nature1971;233:533—8.
39.Cavagna GA,Dusman B,Margaria R.Positive work done by a previously stretched muscle.J Appl Physiol1968;24:21—32.
40.Tatsum i R,Maeda K,Hattori A,Takahashi K.Calcium binding to an elastic portion of connectin/titin fi laments.J Mus Res Cell Motil2001;22:149—62.
41.Herzog W,Schachar R,Leonard TR.Characterization of the passive component of force enhancement follow ing active stretching of skeletal muscle.J Exp Biol2003;206:3635—43.
42.Franz JR,Wierzbinski DM,Kram R.The metabolic cost of running barefootvs.shod:is lighter better?Med Sci Sports Exerc2012;44:1519—25.
43.Davis IS.Gait retraining in runners.OrthopPhysTher Pract2005;17:8—13.
44.Crowell HP,Davis IS.Gait retraining to reduce lower extrem ity loading in runners.Clin Biomech2011;26:78—83.
Received 3 September 2013;revised 3 February 2014;accepted 10 March 2014
*Corresponding author.
E-mail address:aahn@hmc.edu(A.N.Ahn)
Peer review under responsibility of Shanghai University of Sport.
2095-2546/$-see front matter CopyrightⒸ2014,Shanghai University of Sport.Production and hosting by Elsevier B.V.A ll rights reserved. http://dx.doi.org/10.1016/j.jshs.2014.03.007
 Journal of Sport and Health Science2014年2期
- Journal of Sport and Health Science的其它文章
- Can m inimal running shoes im itate barefoot heel-toe running patterns? A comparison of lower leg kinematics
- The effect of m inimal shoes on arch structure and intrinsic foot muscle strength
- Strike type variation among Tarahumara Indians in m inimal sandals versus conventional running shoes
- Foot strike patterns and hind limb joint angles during running in Hadza hunter-gatherers
- Impact shock frequency components and attenuation in rearfoot and forefoot running
- The effectof shoe type on gait in forefootstrike runners during a 50-km run