Parametric analyses of evapotranspiration landf i ll covers in humid regions
Wenjie Zhng,Cheng Sun
aDepartment of Civil Engineering,Shanghai University,Box 1147,149 Yanchang Road,Shanghai 200072,China
bMOE Key Laboratory of Soft Soil and Geoenvironmental Engineering,Zhejiang University,Hangzhou 310058,China
Parametric analyses of evapotranspiration landf i ll covers in humid regions
Wenjie Zhanga,b,*,Cheng Suna
aDepartment of Civil Engineering,Shanghai University,Box 1147,149 Yanchang Road,Shanghai 200072,China
bMOE Key Laboratory of Soft Soil and Geoenvironmental Engineering,Zhejiang University,Hangzhou 310058,China
A R T I C L EI N F O
Article history:
Received 6 September 2013
Received in revised form
3 December 2013
Accepted 25 December 2013
Available online 31 January 2014
Evapotranspiration(ET)covers
Natural soils are more durable than almost all man-made materials.Evapotranspiration(ET)covers use vegetated soil layers to store water until it is either evaporated from the soil surface or transpired through vegetation.ETcoversrelyonthewaterstoragecapacityofsoillayer,ratherthanlowpermeabilitymaterials,to minimizepercolation.WhiletheuseofETcoversinlandf i llsincreasedoverthelastdecade,theyweremainly used in arid or semi-arid regions.At present,the use of ET covers has not been thoroughly investigated in humidareas.Thepurposeof thispaperisto investigate the useofETcovers inhumidareaswhere there isan annualprecipitationofmorethan800mm.Numericalanalyseswerecarriedouttoinvestigatetheinf l uences of cover thickness,soil type,vegetation level and distribution of precipitation on performance of ETcovers. Performance and applicability of capillary barriers and a new-type cover were analyzed.The results show that percolation decreases with an increasing cover thickness and an increasing vegetation level,but the increasingtrendbecomesunclearwhencertainthicknessorLAI(leafareaindex)isreached.Coversoilwitha large capability of water storage is recommended to minimize percolation.ET covers are signif i cantly inf l uenced by distribution of precipitation andare more effective inareas where rainyseason coincides with hot season.Capillary barriers are more eff i cient than monolithic covers.The new cover is better than the monolithic cover in performance and the f i nal percolation is only 0.5%of the annual precipitation.
©2014 Institute of Rock and Soil Mechanics,Chinese Academy of Sciences.Production and hosting by Elsevier B.V.All rights reserved.
1.Introduction
Alternative f i nal covers such as evapotranspiration(ET)covers are increasingly being considered for use at landf i lls when equivalent performance to conventional f i nal covers can be demonstrated. Unlike conventional cover designs that use materials with low hydraulic permeability(barrier layers)to minimize the downward migration of water from the cover to the waste(percolation),ET covers use water balance components to minimize percolation. Thesecoversystemsrelyonthepropertiesofsoiltostorewateruntil itiseithertranspiredthroughvegetationorevaporatedfromthesoil surface.An ETcovertypicallyconsistsof athicklayerof f i ne-grained soil,such as silts or clayey silts,which are capable of supporting vegetation(EPA,2003).Basically,an ET cover does not act as a barrier,but as a reservoir that retains water during rainfall and later returns it to the atmosphere by evapotranspiration.
As ET covers are expected to be less costly in construction and maintenance,the use of ETcovers is becoming increasingly popular, however,performancedataanddesignguidanceforthesecoversare limited(Benson et al.,2001).Lysimeter tests have been carried out by many researchers to evaluate the performance of ET covers(e.g. Roesler et al.,2002;Dwyer,2003).But lysimeter test is expensive andtime-consuming.Furthermore,lysimeterconditionsmaynotbe representative of actual f i eld conditions,because geomembrane in the bottom of lysimeter can cut off the moisture and heat f l ux from waste below.Thus,using lysimeter as a tool for ETcover evaluation was questionable(Kavazanjian et al.,2006).Performance of ET covers was evaluated by Zornberg et al.(2003)and Albright et al. (2004)using water balance methods.The factors that affect the accuracy of water balance analyses were described by Gross(2005).
However,mostoftheabove-mentionedresearcheswere focused on ET covers in arid and semi-arid regions.The performance of ET covers in humid regions still needs to be investigated. Parametric analyses were carried out in this paper.Accordingly, inf l uences of cover thickness,soil type,vegetation level and distribution of precipitation on performance of ET covers wereinvestigated.Performance and applicability of capillary barriers and a new-type cover in humid areas were also analyzed.
2.Numerical model
2.1.Moisture balance of an ET cover
The moisture balance of an ETcovercan be illustratedin Fig.1.As the slope of the cover is only 5%,lateral f l ow can be neglected (Bohnhoff et al.,2009),and hence moisture balance of the covercan be expressed as

whereΔSis the variation of water storage in the cover,Pis the precipitation,Ris the surface runoff,Eis the evaporation of water fromsoil surface,Tis the evapotranspiration byvegetation,andPris the percolation.The sum ofEandTmakes evapotranspiration,ET, i.e.E+T=ET.
Evapotranspiration is signif i cantly inf l uenced by climatic condition,such as solar radiation,windspeed,relative airhumidityand temperature,quality of vegetation,grow stage,root depth,and actual water content of cover soils.Surface runoff is inf l uenced by precipitation,unsaturated hydraulic conductivity and actual water content of cover soils.
2.2.Governing equation and boundary conditions
To describe the moisture movement in cover soils,the following two-dimensional governing equation was used:

wheretis the time;θis the volumetric water content;his the total head;ψis the matric suction;kψis the hydraulic conductivity;xandyare the coordinates,as shown in Fig.1.
Volumetric water content and hydraulic conductivity were both functionsof matricsuction,knownassoil watercharacteristiccurve (SWCC)and hydraulic conductivity function,respectively.They weredef i nedusingvanGenuchtenequation(VanGenuchten,1980):


Fig.1.Moisture balance of a monolithic ET cover.

Table 1Weather data of Suzhou,Philadelphia and Juneau.

whereksis the hydraulic conductivity parameter;θsis the saturated water content;θris the residual water content;αandnare the curve f i tting parameters;Θis the dimensionless water content and is def i ned as

The initial condition was def i ned as

whereθ0is the initial water content of soil in the cover.
The upper boundary corresponding to the surface of the ET cover was def i ned as a f l ux boundary:

where cos(n,x)and cos(n,y)are the cosine of angle between outward normal and coordinate axes.Value of the f l ux boundary can be positive or negative,indicating precipitation or evapotranspiration,respectively.
For the lower boundary corresponding to bottom of the cover, free drainage under gravity was assumed:

2.3.Parameters
2.3.1.Weather data
Weather data of three cities,i.e.Suzhou in China,Philadelphia and Juneau in USA,were used in the following analyses.The annual precipitation,average wind velocity and average relative humidity of the three cities are given in Table 1.It should be noted that Suzhou,Philadelphia and Juneau are in subtropical monsoon climate,temperate continental climate and temperate marine climate zone,respectively.The seasonal distributions of precipitation in the three sites were different.Daily precipitation and temperature are presented in Fig.2.
2.3.2.Vegetation
The main factors that inf l uence capability of vegetative evapotranspiration are vegetation level and root depth.Leaf area index (LAI)was used to characterize the quality of vegetation.LAI is a dimensionless ratio of the active leaf area to the nominal area of the land surface.According to the climate condition,growing season in Suzhou started from the 56th day and ended on the 335th day.In Philadelphia,it started from the 73rd day and endedon the 341st day.In Juneau,it started from the 112th day and ended on the 303rd day.The LAI is assumed to be 2.0 in Suzhou and 1.0 in the other two cities.Root depth is assumed to be 50 cm at the three sites.

Fig.2.Daily precipitation and temperature of the three cities.
2.3.3.Soil type
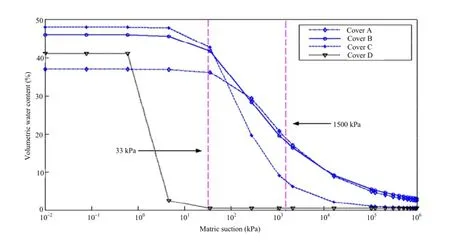
Three types of soils were chosen as vegetative soils.Hydraulic properties of these soils were def i ned using Van Genuchten equation(Roesler et al.,2002)and are given in Table 2.Soils A,B and Cbelong to f i ne-grained soil.Soil D belongs to sand and is used in a capillary barrier as coarse-grained soil.SWCCs of these soils are presented in Fig.3.The volumetric water content corresponding to matric suction 33 kPa is considered to be the f i eld capacity(θfc)of a soil,and the one corresponding to 1500 kPa was considered to be the wilting point(θwp)(Hillel,1998).Thusθfc-θwpis def i ned as the storage capacity,which represents the maximum amount of removable water under evapotranspiration.The storage capacities of soils A,B and C are 0.17,0.23 and 0.36,respectively.
3.Parametric analyses
3.1.Thickness of vegetative layer
Soil B and weather data of Suzhou were used in this analysis.“Cover B”in this graph(and the subsequent graphs)represents an ET cover made up of soil B,and so do“Cover A”and“Cover C”.The initial volumetric water content was 0.18.In order to avoid the inf l uence of an uncertainty in initial water content on the result, every simulationwas performed for a 4-year period time and result of the 4th year was presented.The f i rst thickness employed was 600 mm.The results show that there was rare surface runoff during the year except that a 10 mm surface runoff occurred on the 194th day corresponding to the intense rainfall period in summer.The calculated annual evapotranspiration was 985 mm.Daily evapotranspiration is shown in Fig.4,which was mainly controlled by temperature.In addition,it was also inf l uenced by antecedent precipitation,or the actual water content.For example,on the 168th day,the temperature was high whereas the amount of evapotranspiration was only 1.1 mm.
Daily percolation and watercontentof cover soils near the lower boundary are presented in Fig.5.Percolation mainly happened in the rainfall-concentration period,i.e.from July to September. Accordingly,water content of the bottom soil was relativity high. The annual percolation amounted to 15 mm.It could be calculated from Eq.(1)that variation of water storage over the year was ΔS=1000-10-985-15=-10 mm,where minus means loss of water.
Percolation,i.e.the amount of water expected to percolate through the soil cover,is the criterion to evaluate the performance of the landf i ll cover.The annual acceptable percolation of an ET cover in humid areas has not been specif i ed by the regulatory community,but it can be controlled at no less than 1 mm in arid and semi-arid regions(Waugh et al.,2006).For the study of the inf l uence of cover thickness on the cover performance,thicknesses of 800 mm,1000 mm,1200 mm and 1400 mm for cover B were analyzed.The trend is shown in Fig.6.It is illustrated that percolation decreased with an increasing cover thickness.The annual percolation of the 1400 mm thick vegetative cover was only 0.7 mm.The standard for percolation control in such climate condition can be satisf i ed.
3.2.Soil types
Using climatic data of Suzhou,the performances of covers A,B and C can be compared.When the cover thickness was 600 mm,the annual percolations of covers A,B and C were 40 mm,15 mm and 2mm,respectively,suggestingthatwaterstoragecapacity (θfc-θwp)has a major inf l uence on the performance of an ETcover.
Calculations were carried out considering various cover thicknesses.It can be observed in Fig.6 that the percolation became negligible when the thickness of cover C reached 800 mm.To cover A,the annual percolation f i rstly decreased evidently as thickness increased;however,the decreasing trend became slightly when the thickness exceeded 1600 mm.Even when the thickness reached 2000 mm,there still remained percolation of 8 mm.This illustrates that increasing cover thickness will not always be an effective way to minimize percolation of an ETcover.It is the difference in storage capacity(θfc-θwp)that resulted in the different performances of the three covers.Thus,soils with high storage capacities are recommended in humid regions in orderto minimize f i nal percolation.

Table 2Hydraulic parameters of cover soils(Roesler et al.,2002).
3.3.Leaf area index(LAI)
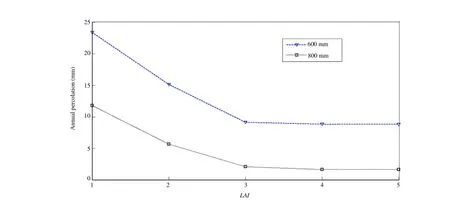
A 600 mm and an 800 mm thick cover B were used to investigate the effect of LAI on annual percolation.Climatic data of Suzhou were used in this analysis.LAIs of the covers were assigned from 1 to 5,in which“5”means the highest vegetation level.The changes in annual percolationwith different LAIs are presented in Fig.7.The annual percolation decreased clearly as LAI increased whenLAI≤3, but the trend became unclear whenLAI>3.Taking the 600 mm thick cover as an example,whenLAI=3,4 and 5,the calculated annual percolations were 9.1 mm,8.8 mm and 8.0 mm,respectively,suggesting that enhancement of the presence of vegetation may not be an effective way to improve the performance of an ET cover.Furthermore,avalue ofLAI=5 was almost impossible during the whole growing season,especially in dry period of time without irrigation.
3.4.Distribution of precipitation
Cover C with a thickness of 1400 mm was taken as an example. The simulation was carried out using climatic data of Suzhou, Philadelphia and Juneau.The calculated cumulative evapotranspiration,volumetric water content of bottom soils and cumulative percolations over a year are shown in Fig.8.
In Fig.8a,the cumulative evapotranspiration in Philadelphia from the 102nd day to the 232nd day was a little higher than that of the other two cities,due to the abundant antecedent precipitation. There were many rainfalls in the middle of the year in Suzhou and the temperature was high during that time,therefore a peak evapotranspiration period happened,and the cumulative evapotranspiration in Suzhou became the largest afterthe 232nd day.The cumulative evapotranspiration in Juneau was the lowest,because the temperature there was relatively low and intensive precipitation happened in low temperature season.
In Suzhou,most precipitation was sent back to atmosphere by evapotranspiration as the rainy season coincided with the hot period,so the bottom soils remained dry throughout the year,as shown in Fig.8b.However,in Philadelphia and Juneau,a majorityof precipitations could not be evaporated or transpired from the soil, especially when temperature was low.In Juneau,there was a huge precipitation in winter,so water content signif i cantly increased during that time and became saturated.
When water content exceeds the f i eld capacity of cover soil, obvious percolation occurs.As a result,there is a strong percolation in the beginning and end of the year in Juneau,whereas in Suzhou almost has no percolation(Fig.8c).The annual percolations in Suzhou,Philadelphia and Juneau are 0 mm,12 mm and 51 mm, respectively.

Fig.3.SWCCs of cover soils(Roesler et al.,2002).

Fig.4.Daily evapotranspiration of the 600 mm thick cover B.

Fig.5.Daily percolation and water content of bottom soils of the 600 mm thick cover B.

Fig.6.Annual percolation of covers A,B and C with various thicknesses.

Fig.7.Annual percolations of cover B with various LAIs.
Further calculation showed that there were still 6.4 mm(in Philadelphia)and 7.6 mm percolations(in Juneau)even if the cover thickness reached 2000 mm.A monolithic ET cover could not minimize the percolation to less than 1 mm in Philadelphia and Juneau.Analysis shows that the climatic condition,especially seasonal distribution of precipitation,has a major inf l uence on performance of an ET cover.
3.5.Capillary barrier ET cover
Another common ETcover design is capillary barrier.A capillary barrier cover consists of a coarser-grained soil overlaid by a f i nergrained vegetative layer.In this analysis,the cover was made up of a 1400 mm thick soil C overlying 300 mm thick soil D.The analysis was conducted using the climatic data of Philadelphia and Juneau.
Water content of soils near the soil C-D interface is given in Fig.9.Sometimes water content of soils above the interface exceeded the f i eld capacity of soil C in Philadelphia,e.g.from the 70th day to the 120th day.However,water content of soil D remained almost unchanged throughout the year(Fig.9a).The reason lays in the contrast in unsaturated hydraulic conductivities between soil C and soil D,which formed a capillary break that limiteddownwardwatermovement.Thecalculatedannual percolation of the capillary barrier cover in Philadelphia was only 0.16 mm.In contrast,the annual percolation of the 1400 mm thick monolithic cover in Fig.8c was 12 mm.It can be concluded that performance of a capillary barrier cover is much better than that of a monolithic cover in this climate condition.
In Juneau,water content of soil C above the interface often exceeded f i eld capacity and even approached saturation in spring and winter,as shown in Fig.9b.The capillary barrier effect disappeared and a lot of water moved downward into soil D,and thus water content of soil D increased apparently.This correspondingly caused an annual percolation of 24 mm.There was still 7.4 mm percolation when calculating soil C with a thickness of 1700 mm. Increasing the thickness of the f i ner textured layer postponed the saturation of the interface,but could not avoid saturation,and hence percolation.Too much precipitation in low-temperature season makes such a cover that cannot be used in this location.

Fig.8.Cumulative evapotranspirations,water content of bottom soils and cumulative percolations for the 1400 mm cover C in the three sites.
3.6.A new-type cover and the performance
The new-type cover consists of a geosynthetic clay liner(GCL) overlaid by a f i ne-grained vegetative layer(called GCL-ET cover hereafter).This cover can hold more water for subsequent evapotranspiration because of the low penetrability of GCL.A 1200 mm thick soil B was used as the vegetative layer in the numerical model.Thickness of the GCL was 5 mm and the saturated hydraulic conductivity was 1.0×10⁻⁸cm/s(Roesler et al., 2002).Performance of the new cover was compared with a 1200 mm thick monolithic cover B(short as monolithic cover hereafter).

Fig.9.Water content near soil C-D interface in capillary barriers.

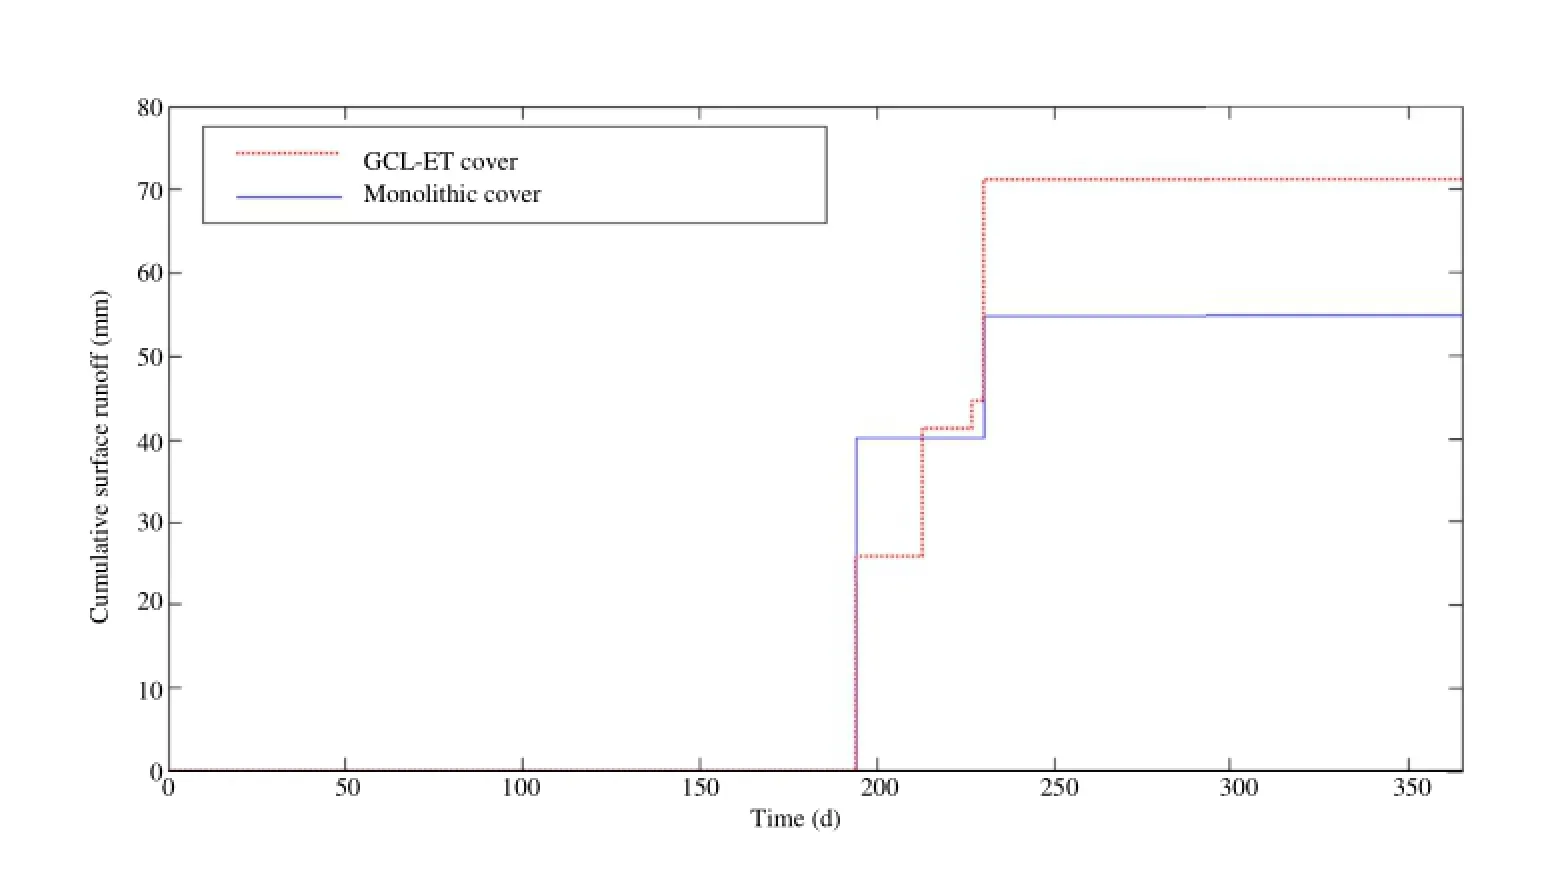
Fig.10.Cumulative surface runoff of the two covers.

Fig.11.The calculated evapotranspiration of the two covers.

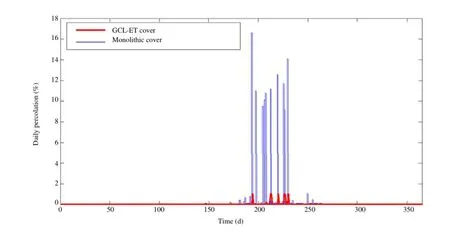
Fig.12.Percolations through the two covers in a year.
In order to conf i rm the performance of the new cover,more humid weather data were used.Climatic data of Suzhou in 1987 were selected for the precipitation amounted to 1500 mm in that year.The rainy season coincided with the hot season in Suzhou,and there was 953.3 mm rainfall from June to September in 1987.The maximum 7-day precipitationwas 390 mm and happened from the 192th to the 198th day.LAI was assumed to be 3 and other parameters were kept unchanged.
Surface runoff of the monolithic cover occurred on the 194th and 230th day,as illustrated in Fig.10.The annual surface runoff was 54.8 mm.Surface runoff of the GCL-ET cover occurred on the 194th,213th,227th and 230th days,with a total amount of 71.1 mm.In rainy season,water could not f l ow downward immediately through the GCL,so the cover soil became saturated and could not hold more water.As a result,there came more surface runoff from the GCL-ET cover than from the monolithic cover.
The daily and cumulative evapotranspirations of the two covers are given in Fig.11.The variation trends were much alike,but evapotranspiration of the GCL-ET cover was a little more than that of the monolithic cover.Evapotranspiration of the monolithic cover was 1340 mm,and evapotranspiration of the GCL-ET cover amounted to 1440 mm,i.e.100 mm more than the former.The amount of evapotranspiration was decided not only by the energy, but also by the available water in soils.Evidently,the GCL-ET cover could hold more water during rainfall event,and thus the subsequent evapotranspiration was larger.
Daily percolation of the two covers is shownin Fig.12.Therewas little percolation before the intense rainfall period.After the 194th day,a relatively large amount of water f l owed through the cover after the saturation of soils in the monolithic cover.The annual percolation of the monolithic cover was 134 mm.Low permeability of the GCL reduced the f l ow rate,and at the same time,made the GCL-ET cover hold more water,which was released by evapotranspiration subsequently.The annual percolation of the GCL-ET cover was only 7.6 mm,i.e.0.5%of the annual precipitation.Performance of the GCL-ET cover was better than that of the monolithic cover.The GCL-ET cover can effectively reduce percolation and is suitable for the study area.
4.Conclusions
Parametric analyses on ET covers in humid areas were carried out in this paper.Main conclusions are drawn as follows.
(1)Percolation usually decreases with an increasing cover thickness,except when an improper cover soil is used.
(2)The bigger the storage capacity(θfc-θwp)of the cover soil is, the less the percolation will be.
(3)Percolation usually decreases with an increasing LAI,but the trend becomes unclear when LAI exceeds 3.
(4)Climate condition has a great inf l uence on performance of ET covers.ETcovers are more effective in areas where rainy season coincides with hot season.
(5)A capillary barrier ET cover is more eff i cient than a monolithic cover,although it may be unsuitable for some area where lots of precipitation happens in low-temperature season.
(6)A GCL-ET cover performs better than a monolithic cover.It can hold more water for subsequent evapotranspiration because of low GCL penetrability.
Conf l ict of interest
We wish to con fi rm that there are no known con fl icts of interest associated with this publication and there has been no signi fi cant fi nancial support for this work that could have in fl uenced its outcome.
Acknowledgements
This research was funded by the National Natural Science Foundation of China(51178260),Open Project of MOE Key Laboratory of Soft Soil and Geoenvironmental Engineering,Zhejiang University(2011P02).
Albright WH,Benson CH,Gee GW,Roesler AC,Abichou T,Apiwantragoon P,et al. Field water balance of landf i ll f i nal covers.Journal of Environmental Quality 2004;33:2317-32.
Benson C,Abichou T,Albright W,Gee G,Roesler A.Field evaluation of alternative earthen fi nal covers.International Journal of Phytoremediation 2001;3(1):105-27.
Bohnhoff GL,Ogorzalek AS,Benson CH,Shackelford CD,Apiwantragoon P.Field data and water-balance predictions for a monolithic cover in a semiarid climate. Journal of Geotechnical and Geoenvironmental Engineering,ASCE 2009;135(3): 333-48.
Dwyer SF.Water balance measurements and computer simulations of land fi ll covers.New Mexico:University of New Mexico;2003.
Environmental Protection Agency(EPA),US.Evapotranspiration land fi ll cover systems fact sheet.US:Environmental Protection Agency(EPA);2003.EPA 542-F-03-015,http://cluin.org/products/altcovers.
Gross BA.Water balance evaluations for monitored evapotranspirative cover systems at three sites in the semi-arid and arid Southwest U.S..PhD Thesis.Austin: University of Texas at Austin;2005.
Hillel D.Environmental soil physics.New York:Academic Press;1998.
Kavazanjian EJ,Beth AG,Tarik HH.Unsaturated fl ow fl ux assessment for evapotranspiration cover compliance.In:The 4th International conference on unsaturated soils,ASCE.Reston,VA:American Society of Civil Engineers(ASCE); 2006.pp.634-45.
Roesler AC,Benson CH,Albright WH.Field hydrology and model predictions for fi nal covers in the alternative cover assessment program-2002.Madison:University of Wisconsin-Madison;2002.Geo Engineering Report No.02-08.
Van Genuchten MT.A closed-form equation for predicting the hydraulic conductivity of unsaturated soils.Soil Science Society of America Journal 1980;44(5): 892-8.
Waugh WJ,Mushovic PS,Kleinrath AW.Lysimeter tests for an ET cover design at Monticello,Utah.In:The4thinternationalconferenceonunsaturatedsoils,ASCE. Reston,VA:American Society of Civil Engineers(ASCE);2006.pp.801-12.
Zornberg JG,Lafountain L,Caldwell JA.Analysis and design of evapotranspirative coverforhazardouswasteland fi ll.JournalofGeotechnicalandGeoenvironmental Engineering 2003;129(5):427-38.

Dr.Wenjie Zhangis working as an associate professor in Department of Civil Engineering at Shanghai University,China.He is a member of the Professional Committee of Geoenvironmental Engineering,the China Civil Engineering Society and the International Society for Soil Mechanics and Geotechnical Engineering.His research interests cover waste disposal,unsaturated fl ow,preferential fl ow and contaminant transport in porous media,etc.He has published more than twenty technical papers.
*Corresponding author.Tel.:+86 13611886341.
E-mail addresses:zhwjlyl@163.com,WJZhang2008@gmail.com(W.Zhang). Peer review under responsibility of Institute of Rock and Soil Mechanics,Chinese Academy of Sciences.
Humid areas
Parametric analyses
Performance
 Journal of Rock Mechanics and Geotechnical Engineering2014年4期
- Journal of Rock Mechanics and Geotechnical Engineering的其它文章
- Fracture initiation and propagation in intact rock-A review
- A review of discrete modeling techniques for fracturing processes in discontinuous rock masses
- A review on the performance of conventional and energy-absorbing rockbolts
- Improved shape hardening function for bounding surface model for cohesive soils
- New artif i cial neural networks for true triaxial stress state analysis and demonstration of intermediate principal stress effects on intact rock strength
- Modeling stress wave propagation in rocks by distinct lattice spring model
