Pressure fluctuation signal analysis of pump based on ensemble empirical mode decomposition method
Hong PAN*, Min-sheng BU
1. College of Energy and Electrical Engineering, Hohai University, Nanjing 210098, P. R. China
2. College of Mechanical and Electrical Engineering, Hohai University, Changzhou 213022, P. R. China
Pressure fluctuation signal analysis of pump based on ensemble empirical mode decomposition method
Hong PAN*1, Min-sheng BU2
1. College of Energy and Electrical Engineering, Hohai University, Nanjing 210098, P. R. China
2. College of Mechanical and Electrical Engineering, Hohai University, Changzhou 213022, P. R. China
Pressure fluctuations, which are inevitable in the operation of pumps, have a strong non-stationary characteristic and contain a great deal of important information representing the operation conditions. With an axial-flow pump as an example, a new method for time-frequency analysis based on the ensemble empirical mode decomposition (EEMD) method is proposed for research on the characteristics of pressure fluctuations. First, the pressure fluctuation signals are preprocessed with the empirical mode decomposition (EMD) method, and intrinsic mode functions (IMFs) are extracted. Second, the EEMD method is used to extract more precise decomposition results, and the number of iterations is determined according to the number of IMFs produced by the EMD method. Third, correlation coefficients between IMFs produced by the EMD and EEMD methods and the original signal are calculated, and the most sensitive IMFs are chosen to analyze the frequency spectrum. Finally, the operation conditions of the pump are identified with the frequency features. The results show that, compared with the EMD method, the EEMD method can improve the time-frequency resolution and extract main vibration components from pressure fluctuation signals.
pressure fluctuation; ensemble empirical mode decomposition; intrinsic mode function; correlation coefficient
1 Introduction
Pressure fluctuations, which are inevitable in the operation of pumps, have a strong non-stationary characteristic and contain a great deal of important information representing the operation conditions (Shen et al. 2000; Yuan et al. 2009). Therefore, monitoring and analysis of pressure fluctuations are essential for ensuring the stable and safe operation of hydropower units. In order to perform further analysis, some conventional signal processing methods have been introduced to extract the features of pressure fluctuation signals, including fast Fourier transform (FFT), short-time Fourier transform (STFT), and wavelet transform (WT) (Al-Badour et al. 2011). However, these methods are not self-adaptive signal processingmethods by nature and are not suitable for non-stationary signals.
In recent years, a new signal processing method, the empirical mode decomposition (EMD) method, has been proposed to analyze non-stationary signals (Huang et al. 1998; Flandrin et al. 2004; Feng and Chu 2005; Donghoh and Hee-Seok 2009). The EMD method can decompose the original signal into a number of intrinsic mode functions (IMFs) which represent the natural oscillatory mode embedded in the signal. Furthermore, the frequency components involved in each IMF not only relate to the sampling frequency, but also change with the original signal. Therefore, the EMD method is a self-adaptive signal processing method and has been widely used in the analysis of vibration signals. However, it has a shortcoming, which is the mode mixing problem. Mode mixing can be defined in two ways: a single IMF contains the oscillatory modes with different scales, or the same frequency resides in different IMFs. In order to solve the mode mixing problem, the ensemble empirical mode decomposition (EEMD) method was developed (Wu and Huang 2009; Lei et al. 2011; De Ridder et al. 2011). In this study, with an axial-flow pump as an example, the EEMD method was used to extract the time-frequency features of pressure fluctuation, and the results were compared with those of the EMD method.
In section 2 of this paper, the EMD method is briefly reviewed. In section 3, the EEMD method and its comparison with the EMD method are described in order to show the advantages of EEMD in signal purification and shaft orbit reconstruction. In section 4, the EEMD method is used to analyze the pressure fluctuation captured from an axial-flow pump, and the results of EEMD and EMD are compared to show the advantages of EEMD in detecting the pressure fluctuation. Finally, the experimental results are summarized.
2 EMD method
The EMD method is based on the simple assumption that any complicated multi-component signal can be decomposed into different simple intrinsic modes of oscillations (Tanaka and Mandic 2007). Each mode should be independent of the others and satisfy the following conditions:
(1) Across the whole data set, the number of extrema and the number of zero crossings must either be equal or differ at most by one.
(2) At any point, the mean value of the upper envelope and lower envelope is zero.
With these conditions, any signal s(t) can be decomposed through the following steps:
(1) Identification of the local extrema and generation of the the upper and lower envelopes by interpolation of the local minima and maxima, respectively.
(2) Calculation of the mean of the upper and lower envelopes, m1(t).
(3) Calculation of the difference between s(t) and m1(t), that is:

If h1(t) is an IMF, then h1(t) is the first IMF of s(t). Otherwise, h1(t) will betreated as a new s(t) and the process above will be repeated until h1(t) is an IMF. The sifting process can be described as

where k is the number of iterations. The final h1k(t) is redefined as c1(t), which is the first IMF. In absolute terms, c1(t) is the high-frequency component of the signal.
(4) Separation of c1(t) froms(t), and definition of the difference as

here r1(t) should be treated as a new s(t). Repeating the process above, c2(t), c3(t), … ,cn(t) are obtained, where cn(t) is the nth IMF of s(t). Then, we have

Step (4) can be stopped when rn(t) is a monotonic function.
(5) Finally, formulation of the original signal as

c1(t), c2(t), … ,cn(t) contain different frequency bands ranging from high to low, which are defined as IMF1,IMF2,…, IMFn , while rn(t) represents the central tendency of the signal.
Thus, the EMD method provides a complete and orthogonal decomposition of the inspected signal without missing information or introducing any additional information. However, the major disadvantage of EMD is the mode mixing problem. This is a result of signal intermittency. To illustrate the mode mixing problem existing in EMD, a simulation signal is considered in this section. x(t) is a sine wave of 8 Hz attached by small impulses. EMD decomposed x(t) into three IMFs, and the performance of EMD is shown in Fig. 1. Mode mixing problems occurred in IMF1 and IMF2, and IMF1 simultaneously contained the sine wave and the impulse. IMF3 was the false component.

Fig. 1 EMD of simulation signal x(t)
3 EEMD method
EEMD was developed to solve the mode mixing problem existing in EMD. It is a noise-added data analysis (NADA) method, which is a method based on the insight from studies of the statistical properties of white noise, showing that the decomposed different-scale components of the signal should be automatically projected onto the corresponding scales of white noise in the background when the added white noise is uniformly distributed across the whole time-frequency domain (Li and Ji 2009; Huang et al. 2011). Using EEMD, the white noise in each iteration is different, while the noise can be canceled out by extracting the ensemble mean of IMFs. Then, the final results are the ensemble mean of IMFs.
The EEMD algorithm can be described as follows:
(1) The number of the ensemble M and the ratio of the standard deviation of white noise to the standard deviation of the original signal Nstdare initialized, and the number of trials m is set to 1.
(2) The mth trial for the signal added with the white noise is implemented.
(a) The white noise is added to the original signal s(t), that is

where nm(t) is the mth added white noise, and sm(t) is the noise-added signal of the mth trial.
(b) The signal sm(t) is decomposed into l IMFs cim(i =1, 2,… , l; m =1, 2,… ,M) with the E MD method, where cimis the ith IMFs of the mth trial.
(c) If m < M, then m = m + 1 and steps (a) and (b) are repeated until m = M, with different white noises each time.
(3) The ensemble mean of M trials for the ith IMF, Ci, is calculated, that is

(4) Ci(i =1, 2,…,l) is considered the final ith IMF.
M was suggested to be 100 by Wu and Huang (2009), and Nstdranges from 0.01 to 0.4.
To demonstrate the EEMD performance in overcoming the mode mixing problem, the simulation signal in Fig. 1 was decomposed again with the EEMD method, where M = 100 and Nstd= 0.01. The results are shown in Fig. 2. It can be concluded that the sine wave and impulse components of the original signal are clearly separated. IMF1 represents the impulse component and IMF2 represents the sine wave. Therefore, the EEMD method is capable of solving the mode mixing problem and extracting the more precise decomposition results.

Fig. 2 EEMD of simulation signal x(t)
4 Application of two methods to pressure fluctuation analysis
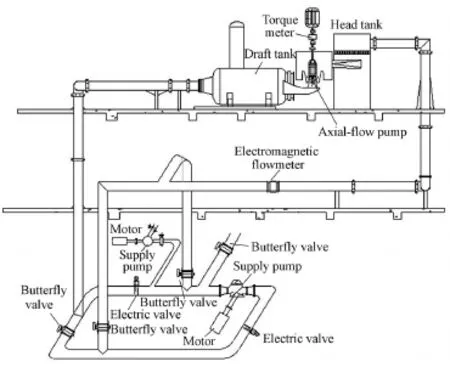
The test facility is illustrated schematically in Fig. 3. The test bed consisted of two motors, two electric valves, four butterfly valves, a head tank, a draft tank, two supply pumps, and a test pump. Various impellers and diffusers could be installed in the test section to test their steady state performance. The instantaneous flow rate was measured with an electromagnetic flowmeter installed in the pipeline. The pressure fluctuations were measured with pressure transducers. The instantaneous torque and rotational speed were measured with a torque meter.

Fig. 3 Schematic view of test system
The experimental data of pressure fluctuations were captured from an axial-flow pump. The pressure transducers were installed in the vicinity of the impeller inlet, the impeller outlet, and the outlet conduit. The number of blades was three. The rotational speed of the electric motor was 1 250 r/min. The advanced data acquisition and analysis system EN900 supported by the ENVADA Company in Beijing was used to collect the signal. The sampling frequency was 256 times the rotational frequency, and 1 024 points were collected every time. Taking the pressure fluctuation signal in the vicinity of the impeller outlet as an example, the time domain waveform is shown in Fig. 4.

Fig. 4 Time domain waveform of pressure fluctuation
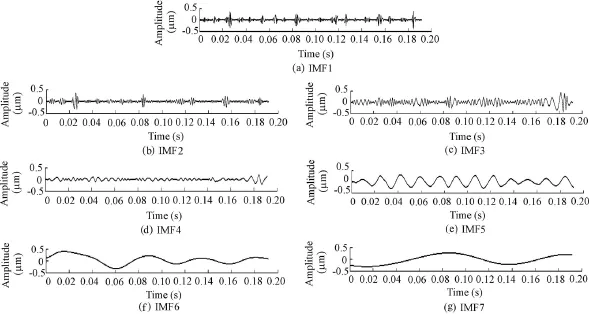
The EMD and EEMD methods were employed to decompose the pressure fluctuation signal into seven IMFs from high frequency to low frequency, as shown in Fig. 5 and Fig. 6. M = 100 and Nstd= 0.01 for the EEMD method.

Fig. 5 Decomposition results of pressure fluctuation signal with EMD method

Fig. 6 Decomposition results of pressure fluctuation signal with EEMD method
The most sensitive IMFs can be chosen according to the correlation coefficients between IMFs produced by the EMD and EEMD methods and the original signal (Hu and Yang 2007). The correlation coefficients were calculated and are listed in Table 1. According to the results of Table 1, IMF5, IMF6, and IMF7, produced by the EMD method, are the most sensitive IMFs, while IMF4, IMF5, IMF6, and IMF7, produced by the EEMD method, are the most sensitive IMFs.

Table 1 Correlation coefficients between IMFs produced by EMD and EEMD methods and original signal
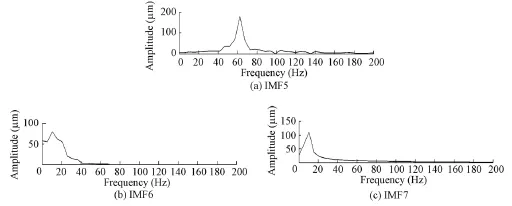
Spectrum analysis was then applied to the most sensitive IMFs and the results are shown in Fig. 7 and Fig. 8. With the EMD method, 62.5 Hz and 10.4 Hz were extracted clearly. As mentioned before, the rotational speed was 1 250 r/min, so the rotational frequency f0was 20.83 Hz. As shown in Fig. 7, the frequencies of IMF5, IMF6, and IMF7 were 3f0, 0.5f0, and 0.5f0, respectively. The frequency 3f0results from the influence of the number of impellers, which was three, while the frequency 0.5f0is the result of the irregular movements of turbulence. Ho wever, the rotationalfrequency f0cannot be extracted separately. In addition, IMF6 and IMF7 represent the same frequency component. In order to extract more precise decomposition results, EEMD was preformed. As shown in Fig. 8, the frequencies of IMF4, IMF5, IMF6, and IMF7 were 3f0, f0, 0.5f0, and 0.25f0, respectively. It can be concluded that not only the rotational frequency (f0) but also the new frequency (0 .25f0) can be identified clearly. The frequency 0.25f0is also the result of the irregular movements of turbulence. The movements become stronger when the flow is reduced to a certain degree. Therefore, the decomposition results of the pressure fluctuation based on the EEMD method are much better than those based on the EMD method.

Fig. 7 Spectrum analysis of IMFs produced by EMD method

Fig. 8 Spectrum analysis of IMFs produced by EEMD method
From the experiment, it can be found that the EEMD method can effectively resolve the mode mixing problem existing in the EMD method and achieve more precise decomposition results than the EMD method. However, there are some problems that need to be resolved before EEMD operation, such as parameter settings and IMF post-processing. The values of the ensemble number and the ratio of the standard deviation of white noise to the standard deviation of the original signal have a large influence on the accuracy of EEMD. Until now, there has not been a specific principle to provide guidance for the choice of the parameters. Before wide application of EEMD can be achieved, there are a lot of problems that need to be studied further.
5 Conclusions
In this paper, the EEMD method is introduced and applied to analysis of the frequency characteristics of pressure fluctuations. In order to select the number of IMFs, the EMD method was used first. Then the signal was decomposed by the EEMD method with the number of IMFs determined by the EMD method. This approach avoids interference from other false components and is essential for selection of sensitive IMFs. It overcomes the mode mixing problems that occurs with the EMD method. Furthermore, EEMD provides a better decomposition performance for the lower frequency components. The experimental results indicate that the EEMD method is effective for multi-component signals. However, there are still some problems that need to be studied further to improve the stability and validity of the EEMD method.
Al-Badour, F., and Sunar, M., and Cheded, L. 2011. Vibration analysis of rotating machinery using time-frequency analysis and wavelet techniques. Mechanical Systems and Signal Processing, 25, 2083-2101. [doi:10.1016/j.ymssp.2011.01.017]
De Ridder, S., Neyt, X., Pattyn, N., and Migeotte, P. F. 2011. Comparison between EEMD, wavelet and FIR denoising: Influence on event detection in impedance cardiography. Proceedings of 33rd Annual International Conference of the IEEE Engineering in Medicine and Biology Society, 806-809. Boston: Institute of Electrical and Electronics Engineers. [doi:10.1109/IEMBS.2011.6090184]
Donghoh, K., and Hee-Seok, O. 2009. EMD: A package for empirical mode decomposition and Hilbert spectrum. The R Journal, 1(1), 40-46.
Feng, Z. P., and Chu, F. L. 2005. Transient hydraulic pressure fluctuation signal analysis of hydroturbine based on Hilbert-huang transform. Proceedings of the CSEE, 25(10), 111-115. (in Chinese). [doi:0258-8013(2005)10-0111-05]
Flandrin, P., Rilling, G., and Gonçalvès, P. 2004. Empirical mode decomposition as a filter bank. IEEE Signal Processing Letters, 11(2), 112-114. [doi:10.1109/LSP.2003.821662]
Hu, J. S., and Yang, S. X. 2007. Study on the autocorrelation-based vibration signal EMD decomposition method in rotation machinery. Journal of Mechanical Strength, 29(3), 376-379. (in Chinese) [doi: 10.3321/j.issn:1001-9669.2007.03.005]
Huang, J., Hu, X. G., and Geng, X. 2011. An intelligent fault diagnosis method of high voltage circuit breaker based on improved EMD energy entropy and multi-class support vector machine. Electric Power SystemsResearch, 81(2), 400-407. [doi:10.1016/j.epsr.2010.10.029]
Huang, N. E., Shen, Z., Long, S. R., Wu, M. C., Shih, H. H., Zeng, Q., Yen, N. C., Tung, C. C., and Liu, H. H. 1998. The empirical mode decomposition and the Hilbert spectrum for nonlinear and non-stationary time series analysis. Proceedings of the Royal Society A: Mathematical, Physical and Engineering Sciences, 454(3), 903-995. [doi:10.1098/rspa.1998.0193]
Lei, Y. G., He, Z. J., and Zi, Y. Y. 2011. EEMD method and WNN for fault diagnosis of locomotive roller bearings. Expert Systems with Applications, 38(6), 7334-7341. [doi:10.1016/j.eswa.2010.12.095]
Li, L., and Ji, H. B. 2009. Signal feature extraction based on an improved EMD method. Measurement, 42(5), 796-803. [doi:10.1016/j.measurement.2009.01.001]
Shen, D., Chu, F. T., and Chen, S. 2000. Diagnosis and identification of vibration accident for hydrogenerator unit. Journal of Hydrodynamics, 15(1), 129-133. (in Chinese)
Tanaka, T., and Mandic, D. P. 2007. Complex empirical mode decomposition. IEEE Signal Processing Letters, 14(2), 101-104. [doi:10.1109/LSP.2006.882107]
Wu, Z. H., and Huang, N. E. 2009. Ensemble empirical mode decomposition: A noise-assisted data analysis method. Advances in Adaptive Data Analysis, 1(1), 1-41. [doi:10.1142/S1793536909000047]
Yuan, S. Q., Ni, Y. Y., Pan, Z. Y., and Yuan, J. P. 2009. Unsteady turbulent simulation and pressure fluctuation analysis for centrifugal pumps. Chinese Journal of Mechanical Engineering, 22(1), 64-70. [doi:10.3901/ CJME.2009.01.064]
(Edited by Yan LEI)
This work was supported by the National Natural Science Foundation of China (Grant No. 51076041), the Fundamental Research Funds for the Central Universities (Grant No. 2010B25114), and the Natural Science Foundation of Hohai University (Grant No. 2009422111).
*Corresponding author (e-mail: hongpan@hhu.edu.cn)
Received Dec. 16, 2012; accepted Mar. 1, 2013
 Water Science and Engineering2014年2期
- Water Science and Engineering的其它文章
- Shear velocity criterion for incipient motion of sediment
- A method of determining nonlinear large strain consolidation parameters of dredged clays
- Effect of upward seepage on bedload transport rate
- Numerical modeling of flow in continuous bends from Daliushu to Shapotou in Yellow River
- Effects of hydraulic retention time, temperature, and effluent recycling on efficiency of anaerobic filter in treating rural domestic wastewater
- Detention basins as best management practices for water quality control in an arid region
