Mathematical model for flood routing based on cellular automaton
Xin CAI*, Yi LI, Xing-wen GUO Wei WU
1. State Key Laboratory of Hydrology-Water Resources and Hydraulic Engineering, Hohai University, Nanjing 210098, P. R. China
2. College of Mechanics and Materials, Hohai University, Nanjing 210098, P. R. China
3. College of Water Conservancy and Hydropower Engineering, Hohai University, Nanjing 210098, P. R. China
4. Nanjing Municipal Bureau of Water Resources, Nanjing 210008, P. R. China
Mathematical model for flood routing based on cellular automaton
Xin CAI*1,2,3, Yi LI1,2,4, Xing-wen GUO2, Wei WU4
1. State Key Laboratory of Hydrology-Water Resources and Hydraulic Engineering, Hohai University, Nanjing 210098, P. R. China
2. College of Mechanics and Materials, Hohai University, Nanjing 210098, P. R. China
3. College of Water Conservancy and Hydropower Engineering, Hohai University, Nanjing 210098, P. R. China
4. Nanjing Municipal Bureau of Water Resources, Nanjing 210008, P. R. China
Increasing frequency and severity of flooding have caused tremendous damage in China, requiring more essential countermeasures to alleviate the damage. In this study, the dynamic simulation property of a cellular automaton was used to make further progress in flood routing. In consideration of terrain’s influence on flood routing, we regarded the terrain elevation as an auxiliary attribute of a two-dimensional cellular automaton in path selection for flood routing and developed a mathematical model based on a cellular automaton. A numerical case of propagation of an outburst flood in an area of the lower Yangtze River was analyzed with both the fixed-step and variable-step models. The results show that the flood does not spread simultaneously in all directions, but flows into the lower place first, and that the submerged area grows quickly at the beginning, but slowly later on. The final submerged areas obtained from the two different models are consistent, and the flood volume balance test shows that the flood volume meets the requirement of the total volume balance. The analysis of the case shows that the proposed model can be a valuable tool for flood routing.
cellular automaton; flood routing; mathematical model
1 Introduction
Flooding, one of the worst types of natural disasters in China, causes huge damage. Flood waves caused by dikes breaking produce a deadly impact force, which seriously threatens people’s lives and property. As an important non-engineering measure, flood routing can provide a strong scientific reference for disaster warning and flood control decisions. Many effective methods have been used for flood routing in China and abroad (Huang 2005; Begnudelli and Sanders 2007; Chen et al. 2008; Viviroli et al. 2009; Liang 2010; Dottori and Todini 2011; Li et al. 2012; Seyoum et al. 2012). Two kinds of models are used widely: hydrologic models and hydraulic models. Hydrologic models include the storage calculationmodel, Muskingum model, lag and route model, and characteristic river-length method. These are calculation methods for solving the water balance and slot leakage equation. There are five main types of hydraulic models: the finite difference method, characteristics method, finite element method, finite volume method, and boundary element method. These are discrete numerical models for solving the governing equation of flood waves. They use differential methods to solve the equation by dividing the simulation domain and discretizing the governing equation, scientifically demonstrating the basic conditions of flood routing, including the flow rate, water depth, and location.
With economic development and technological improvement, flood routing in low-dimensional space is no longer suitable for modern dike project management. Thus, three-dimensional (3D) visual flood routing is a significant tool. Over recent years, scholars have conducted plenty of further research on flood simulation. Ghazali and Kamsin (2008) described a study aimed at simulating a flash flood event using 3D computer graphics and fluid simulation techniques. Landström et al. (2011) performed computer simulation for environmental risk management on meshes of heterogeneous elements. Pistrika (2010) improved the insight in economic estimation of flood-induced damage by analyzing the direct flood damage to built-up areas and agricultural areas. Ying and Wang (2010) carried out a case study of chute flow using a two-dimensional (2D) shallow-water model, in which the governing equations were solved on unstructured triangular grids using a finite volume method. However, there are also some problems. For example, the bulk method does not take the flow velocity and the flow exchange between grids into account, and it cannot reflect the spatiotemporal characteristics of floods in an effective manner. Thus, the issue of how to improve existing models or to construct a new model is a problem that still needs to be solved.
The cellular automaton method, built in a discrete and finite-state cellular space (Chopard and Droz 2003), is a kind of method for mathematical modeling. This model follows certain rules and can simulate the system evolution process by dividing time and space. Because of the discretization of its analog functions and its flexible rules for evolution, the cellular automaton method is favored by scholars. It has been successfully applied to pollution dispersion modeling, traffic flow simulation, and urban growth simulation. In view of the spatiotemporal characteristics in flood routing and the discretization of analog functions in a cellular automaton, the method is considered suitable for flood routing. In this study, a mathematical model for flood routing was built based on the theory of the cellular automaton. The model functions were analyzed based on its application to a case study. Capabilities and limitations of the mathematical model are discussed and some conclusions are drawn.
2 Cellular automaton model
In the 1950s, Von Neumann proposed the cellular automaton model for solving organism self-replication behavior (Chopard and Droz 2003). Generally, a cellular automaton is composed of cellular space, cellular neighborhood space, cellular state space, and a cellular evolution rule, with basic properties of discretization, homogeneity, parallelism, andlocalization, as well as higher dimensions. All the discrete cells form cellular space. The cellular neighborhood space around each cell is comprised of cells according to a certain rule. Each cell can have limited types of states, with only one state at one moment. The state of a center cell is determined by states of its neighboring cells at the previous moment. The cellular evolution rule is defined as the standard for cellular state transition. The cellular automaton composition can be described as

where CAis the cellular automaton, Ldis the cellular space, S is the cellular state space, N is the cellular neighborhood space, and f is the cellular evolution rule.
Theoretically, the cellula r automaton can have arbitrary dimensions. However, low-dimensional cellular automatons, especially the two-dimensional cellular automaton, have received more attention from scholars. Due to the impact of terrain, floods do not spread around uniformly, but flow to the low-elevation space first. Thus, the topography of a region is of great importance, and the 2D condition is insufficient for flood routing when using the cellular automaton model. Considering the topography of the study region, Chen et al. (2009) proposed the concept of a 2.5-dimensional cellular automaton when he studied the crowd evacuation model. By introducing an affiliated attribute into the 2D cellular automaton model, one can describe the cellular state in the 3D space indirectly. Based on this concept, we used an improved cellular automaton model for flood routing in a case study of a dike breach. The schematic diagram of a cellular automaton is shown in Fig. 1.
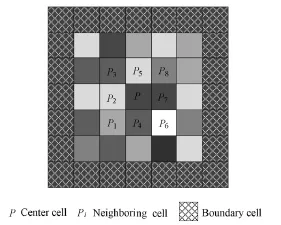
Fig. 1 Schematic diagram of improved 2D cellular automaton
In Fig. 1, P is a center cell, and P1through P8are the neighboring cells of the center cell. In the improved 2D cellular automaton model, cells have different elevations. It is assumed that the neighboring cells are sorted in the following descending order from the highest elevation to the lowest elevation,with a shade of color from light to dark: P6, P2, P5, P8, P4, P3, P1, and P7. Thus, floods will flowfrom the center cell P into cell P7first.
3 Cellular automaton model for flood routing
3.1 Cellular space and neighborhood space
In the cellular automaton model for flood routing, the cellular space is formed by theterrain elevation element of the study area. After the necessary processing of digital elevation data for the study area, we can divide the study area into some grid elements. Each element has four grid points and represents a cell. The cells in the cellular neighborhood space are collected according to the Moore rule, which means that every eight cells around the center cell form its neighborhood space.
3.2 Cellular state and evolution rule
3.2.1 Cellular state and property
There are two states in the cellular space: 0 and 1. 0 stands for the unsubmerged area, and 1 stands for the submerged area. Each cell, e.g., cell i, is characterized by its position, (Xi, Yi); the terrain property, G (a, b, c, d, e), where a, b, c, d, and e refer to the main stream, branch, road, vacant land, and building, respectively; the terrain elevation, zi; the flood depth at moment t, hi,t; the water surface elevation at moment t, Zi,t, with Zi,t=zi+hi,t; and the flood coefficient at moment t, mi,t, which is related to the terrain property.
3.2.2 Cellular evolution rule
When a dike breaks, the flood at the breach spreads into the peripheral neighborhood. Considering the terrain property, the flood will not flow into every cell of the neighborhood. Only when the elevation of a neighboring cell is lower than that of the center cell can the flood flow into the neighboring cell. At one step of calculation, if hi,t> 0, the cell i is submerged, and its state is 1, or else it will be 0. Then the state of cell i at moment t+1 can be expressed as

where fis the state transition function of the cellular automaton; and Si,tand Sj,tare the states of cell i and its neighboring cell jat moment t, respectively.
3.3 Flood discharge calculation
In flood routing, there is a flow exchange between cells. It is assumed that the submerged flow conditions approximate the situation of the weir flow. Thus, the flow exchange can be calculated with the weir flow formula. Because the grid shape is quadrilateral and each cell has a fixed terrain elevation, the broad-crested weir formula can be used to calculate the flow exchange between cells in this model. The broad-crested weir formula can be described as

where ΔQi,j,t+1is the flow exchange between cells i and j at moment t+1, Biis the edge length of cell i, g is the acceleration of gravity , and ΔHi,j,tis the water head difference between cells i and j at moment t.
3.4 Boundary treatment
Theoretically, the cellular space is infinite. In the actual simulation, however, thecomputer cannot handle problems with infinite domains. Thus, the cellular space must be a limited scale and there are some boundary problems. Generally, two methods are used to deal with the boundary problems: one is adopting a different evolution rule for the boundary cells and reducing the neighboring cell number of the boundary cells. Another is using the same evolution rule for the boundary cells and extending the boundary cells. In this study, the former method was used. That is, the cell at the corner had three neighboring cells, while other boundary cells had five neighboring cells for each, and each of the internal cells had eight neighboring cells.
3.5 Flood routing
Fig. 2 shows the frame diagram of flood routing based on the cellular automaton. The main steps of the simulation are as follows:
(1) Processing the Shuttle Radar Topography Mission-Digital Elevation Model (SRTMDEM) data and flood data of the study area;
(2) Confirming the breach area and the first submerged cell;
(3) Selecting every neighboring cell j of a submerged cell i, and examining whether they are submerged or not;
(4) Confirming the submerged cells and calculating the number of submerged cells (k);
(5) Repeating the calculation by going to step (3).
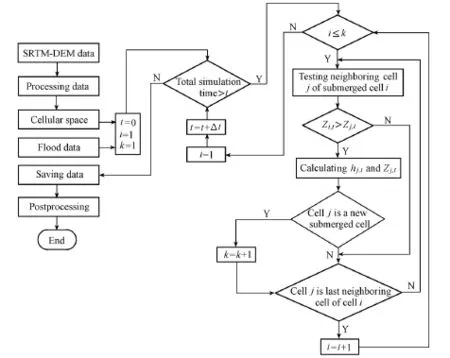
Fig. 2 Frame diagram of flood routing
4 Simulation and discussion
4.1 Study area and simulation method
In this study, we took one area of the lower Yangtze River (with the longitude from 118°E to 119°E, and the latitude from 31°N to 32°N) as the simulation domain and divided it into 120 1×120 1 cells. Each cell was 78.0 m ×92.0 m. The lowest elevation was −10 m and the highest was 434 m. The cellular space (Fig. 3(b)) was produced from DEM data shown in Fig. 3(a), in which the elevations from high to low correspond to the shades from light to dark. We use a green curve to demonstrate the Yangtze River in Fig. 3(b).

Fig. 3 DEM and cellular space of study area
The time history of the flood at the dike breach is shown in Fig. 4 (Ma 2004). In the simulation, we assumed that the flood only flowed through the breach. There were two terrain properties in the cellular space, a (main stream) and d (vacant land). The flood coefficient had a fixed value, which was 0.34. The total simulation time was 22 hours.
Two time step models, i.e., the fixed-step and variable-step models, were used in flood routing in this study.
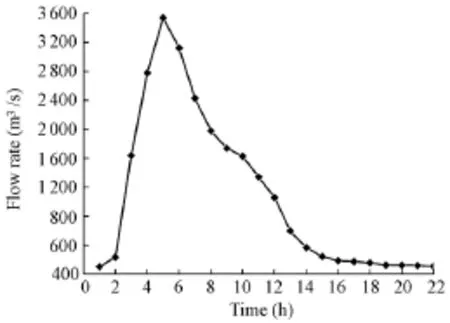
Fig. 4 Time history of flood (Ma 2004)
In the variable-step model, the time step Δt was determined as

B is the side length of a breach cell, v is the flow velocity through the cell, Q is the water volume through the cell, Z is the water level at the cell, and z is the terrain elevation at the cell.
In a fixed-step model, the time step is determined as the average value of those in thevariable-step model. In this case it was approximately three seconds.
In the actual process, the flood at the breach was affected by the development process of the breach. The research shows that the time duration for the dike breaking was less than three hours, and that the profile of the breach was trapezoidal (Chen et al. 2008). Thus, we assumed that the shape of the breach was rectangular in the first three hours and trapezoidal later in the study period.
4.2 Simulation results analysis
Using the improved 2D cellular automaton model described above, a software program was compiled for flood routing. Some results were obtained, as shown in Fig. 5 through Fig. 7, where the red range indicates the submerged area.
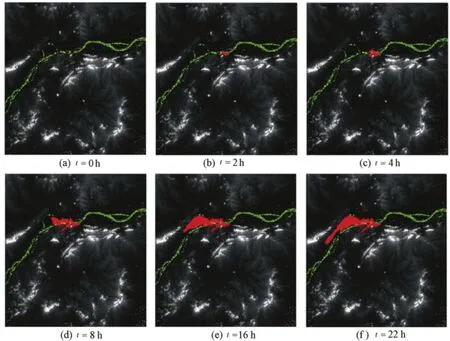
Fig.5 Flood routing with fixed-step model

Fig. 6 Time history of submerged cellular number for two time step models

Fig. 7 Final submerged area at simulation time of 22 h obtained from two time step models
4.2.1 Results analysis
(1) Fig. 5 shows that the flood water does not flow outward uniformly from the dike breach but follows paths conditionally. Near the breach, those cells with higher terrain elevations are not submerged, while others are submerged, which is consistent with the actual situation.
(2) Fig. 6 shows that the time history of the submerged cell number of the fixed-step model is different from that of the variable-step model. In the fixed-step model, a constant time step of three seconds was adopted to calculate the flood water in the submerged cell spreading into neighboring cells. However, in the variable-step model, the computing time step was determined by the changing rate of flood water from the breach. The greater the changing rate is, the smaller the computing time step will be. In the early stage of the simulation, the computing time step in the variable-step model is shorter than that in the fixed-step model, and the submerged cell number from the variable-step model increases more quickly than that from the fixed-step model over the same computing time. The trend in the later stage is opposite to that in the early stage.
(3) Fig. 6 also shows that both of the two time step models demonstrate a similar overall trend in the variation of flood volume from the breach. The submerged area from the two time step models increases quickly in the early stage and slowly in the later stage, which is consistent with the time history of flood shown in Fig. (4). The final submerged area (Fig. 7) shows that both of the flooded areas are basically the same: the final submerged cell numbers are 16 120 for the fixed-step model and 16 182 for the variable-step model, with a difference coefficient of 0.4%.
(4) The total flood volume at the breach obtained from Fig. 4 is 8.520 8 × 10⁷m3. According to the simulation results, the total flood volume in the submerged area is 8.520 6 × 10⁷m3. The difference coefficient is 0.002 6%. The flood volume meets the total volume balance requirement.
(5) These results indicate that both of the two time step models can be used for flood routing, and the cellular automaton model based on the two time step models is effective and feasible to a certain extent.
4.2.2 Error analysis
In this study, we made some assumptions and simplified some simulation conditions which might cause errors. We assumed that the submerged flow conditions approximated the situation of the weir flow, and the weir flow formula was used to calculate the exchanged flow between cells. The cell water level was not high during the rapid growth of the submerged area. At this time, the weir flow formula can reflect the state of water flow reasonably. In contrast, the cell water level increases rapidly during the slow growth of the submerged area. At this time, the condition of water exchange between cells is complex. Using the weir flow formula to reflect the state of water flow will produce errors.
5 Conclusions
A mathematical model for flood routing is proposed based on the cellular automaton. It was applied to simulating the propagation of an outburst flood in an area of the lower Yangtze River. The main conclusions are as follows:
(1) By adding a subsidiary property of a cell, that is, the terrain elevation, we can use the cellular automaton method for flood routing in an effective manner. Using the broad-crested weir formula, we can calculate the flow exchange between cells.
(2) The proposed model can well reflect the situation and spatiotemporal characteristics of flooding. It meets the requirements of the flood volume balance, and the calculation results of the fixed-step model and the variable-step model are consistent. The proposed model will be valuable in flood-control emergency planning and flood-warning systems.
(3) The main aspects that need further consideration are the accuracy of the geographical terrain data, cell size, changes of the flood speed in different directions, ground-level structures, and rescue measures. The theory and implementation of flood routing are important issues that require further research and discussion.
Begnudelli, L., and Sanders, B. F. 2007. Simulation of the St. Francis dam-break flood. Journal of Engineering Mechanics, 133(11), 1200-1212. [doi:10.1061/(ASCE)0733-9399(2007)133:11(1200)]
Chen, J. C., Zhan, W. J., and Jiang, L. J. 2009. A crowd evacuation model based on 2.5-dimension cellular automaton. Journal of Engineering Graphics, 30(5), 170-176. (in Chinese) [doi:10.3969/j.jssn.1003-0158. 2009.05.030]
Chen, S. S., Zhong, Q. M., and Tao, J. J. 2008. Development in embankment dam break simulation and water flow simulation. Advances in Water Science, 19(6), 903-910. (in Chinese) [doi:10.3321/j.jssn:1001-6791. 2008.06.022]
Chopard, B., and Droz, M. 2003. Cellular Automaton Modeling of Physical Systems. Beijing: Tsinghua University Press. (in Chinese)
Dottori, F., and Todini, E. 2011. Developments of a flood inundation model based on the cellular automaton approach: Testing different methods to improve model performance. Physics and Chemistry of the Earth, Parts A/B/C, 36 (7-8), 266-280. [doi:10.1016/j.pce.2011.02.004]
Ghazali, J. N., and Kamsin, A. 2008. A real time simulation of flood hazard. Proceedings of 5th International Conference on Computer Graphics, Imaging and Visualisation (CGIV): Modern Techniques andApplications, 393-397. Penang: IEEE. [doi:10.1109/CGIV.2008.29]
Huang, Y. 2005. Appropriate Modeling for Integrated Flood Risk Assessment. Ph. D. Dissertation. Enschede: The University of Twente.
Landström, C., Whatmore, S. J., and Lane, S. N. 2011. Virtual engineering: Computer simulation modelling for flood risk management in England. Science and Technology Studies, 24(2), 3-22.
Li, Y., Gong, J. H., Zhu, J., Ye, L., Song, Y. Q., and Yue, Y. J. 2012. Efficient dam break flood simulation methods for developing a preliminary evacuation plan after the Wenchuan Earthquake. Natural Hazards and Earth System Sciences, 12, 97-106. [doi:10.5194/nhess-12-97-2012]
Liang, Q. H. 2010. Flood simulation using a well-balanced shallow flow model. Journal of Hydraulic Engineering, 136(9), 669-675. [doi:10.1061/(ASCE)HY.1943-7900.0000219]
Ma, R. R. 2004. Risk Analysis Method of Earth-rockfill Dams and Its Application. Beijng: Science Press. (in Chinese)
Pistrika, A. 2010. Flood damage estimation based on flood simulation scenarios and a GIS platform. European Water, 30, 3-11.
Seyoum, S., Vojinovic, Z., Price, R., and Weesakul, S. 2012. Coupled 1D and Noninertia 2D flood inundation model for simulation of urban flooding. Journal of Hydraulic Engineering, 138(1), 23-34. [doi:10.1061/ (ASCE)HY.1943-7900.0000485]
Viviroli, D., Mittelbach, H., Gurtz, J., and Weingartner, R. 2009. Continuous simulation for flood estimation in ungauged mesoscale catchments of Switzerland, Part II: Parameter regionalisation and flood estimation results. Journal of Hydrology, 377(1-2), 208-225. [doi:10.1016/j.jhydrol.2009.08.022]
Ying, X. Y., and Wang, S. S. Y. 2010. Evaluation of 2D shallow-water model for spillway flow with a complex geometry. Journal of Hydraulic Research, 48(2), 265-268. [doi:10.1080/00221681003704178]
(Edited by Ye SHI)
This work was supported by the Key Project in the National Science and Technology Pillar Program During the Twelfth Five-year Plan Period (Grant No. 2012BAB03B02), the Key Project in Jiangsu Water Science and Technology (Grant No. 2009054), and the Open Fund of the Research Center on Levee Safety and Disasters Prevention, Ministry of Water Resources (Grant No. 201104).
*Corresponding author (e-mail: xcai@hhu.edu.cn)
Received Nov. 5, 2012; accepted Jun. 24, 2013
 Water Science and Engineering2014年2期
- Water Science and Engineering的其它文章
- Risk assessment of water security in Haihe River Basin during drought periods based on D-S evidence theory
- Hydrological simulation approaches for BMPs and LID practices in highly urbanized area and development of hydrological performance indicator system
- Detention basins as best management practices for water quality control in an arid region
- Effects of hydraulic retention time, temperature, and effluent recycling on efficiency of anaerobic filter in treating rural domestic wastewater
- Numerical modeling of flow in continuous bends from Daliushu to Shapotou in Yellow River
- Effect of upward seepage on bedload transport rate
