Detecting Circles Using a Two-Stage Approach
Wen-Yen Wu
Detecting Circles Using a Two-Stage Approach
Wen-Yen Wu
—We propose a two-stage method for detecting circular objects in this paper. In the first stage, curves are divided as linear segments or nonlinear segments. A least square estimator is used to find the estimated centers and radii of the nonlinear segments in the second stage. The found centers and radii are then evaluated to see if there exist circles in the nonlinear segments. Both of the broken and occluded circular objects are evaluated for the proposed method. From the experimental results, it is seen that the proposed method is efficient.
Index Terms—Circle detection, curve segmentation, error estimation, fitting.
1. Introduction
Recognizing industrial parts is an important task in many applications. Industrial parts with a round shape are seen everywhere. They need to be measured and inspected during the manufacturing or assembling processes. Many methods have been proposed to detect circles in the past years. Most algorithms of them are based on Hough transform (HT) or its variants[1]-[5]. The HT based methods usually use a 3D accumulator array to map thex-ycoordinates of the pixels to the corresponding parameter space. A circle with center (xc,yc) and radiusrwill be detected if it is a peak in the parameter space. It is known that for an image containing noise, it suffers from some problems, such as 1) An algorithm for peak-finding in the 3D accumulator is implicit and complex; 2) An inappropriate structure of accumulator fails to detect such a circle; 3) The precision of the center is low; 4) Large storage is required for the 3D accumulator; 5) Much operating time is taken. Therefore, many HT algorithms tend to solve the above problems by using different data structures or identifying strategies. However, the HT algorithms are restricted to the pixel accuracy. It is not enough for a machine vision system that requires sub-pixel accuracy.
Since the drawbacks of the HT methods, some non-HT algorithms have been proposed. Chen and Lin[6]used the orthogonal circular detector to estimate the parameters of circles. It consists of five 9×9 masks based on a truncated basis system set. The coordinates of edge pixels are determined to sub-pixel accuracy, therefore the estimates of circle parameters are also of sub-pixel accuracy. Wojcik[7]used a graph to represent objects as nodes, and then assigned weights to nodes based on the properties of the objects. A template matching technique is used to recognize the circular objects.
Some other methods use the geometric properties of circles to detect the circular objects[8]-[11]. Chen and Lee[8]proposed a circular object detection and location technique by using the geometric properties of a circle to find some pixels on a circle and then fit these pixels to obtain the center and radius of the detected circular object. Although it is simple, the calculations of this method are still somewhat complex. Ho and Chen[9]used a global geometric symmetry to develop a circle detector. The candidates of centers are first located. All feature points are grouped into several sub-images. The candidate centers were then evaluated to find the centers. The proposed method is useful but the testing image seems too simple. Wu and Yu[10]used the geometric properties of circles to identify the points on a circle. The possible circular points are then applied to a fitting process to find the parameters of the circle. The method is simple and it is effective. However, it is not robust for the partially occluded circles. Yu and Bajaj[11]proposed a method of detecting circles in electron micrographs. The distance transform and the Voronoi diagram are used for the detection of critical features and the accurate location of particles from the images. This method is useful for detecting circles, but it is complex in developing the diagram and transform.
In this paper, we propose a two-stage method to detect circles. It is a simple and efficient technique. In the first stage, the curves are divided as linear or nonlinear segments. A least square estimator is then applied to the nonlinear segments individually to find the possible pairs of centers and radii in the second stage. The found center and radius are evaluated to see if they are good enough by their fitting error. The experimental results show that the proposed method can detect broken and partially occluded circles effectively. Further, it is robust for noisy images. The proposed method is presented in Section 2. The experimental results are illustrated in Section 3. Discussion and conclusion are made in the final section.
2. Circle Detection Method
The proposed circle detection method consists of two stages. In the first stage, the curve is divided into linear segments and nonlinear segments. We use a dominant pointdetection to find the significant points in a curve. The curve is partitioned into several segments. In the second stage, a circle fitting process is used to find the possible circles for the nonlinear segments. A circle is detected for a nonlinear segment with small fitting errors.
2.1Curve Segmentation Stage
Dominant points are considered as representative features for the object contours, because they reserve the features of the digitized curve of the images. They are commonly identified as the points with a local maximum curvature[12].
The set ofnconsecutive points is denoted as a digital curveC. That is,

wherenis the number of points,Piis theith point with coordinate (xi,yi), and pointsPi-1andPi+1are neighbors of pointPi(modulon).
The points on straight line cannot be considered as the dominant points. The linear points can be removed by tracking the chain codes. The break points are the candidates of dominant points. It will reduce the computation time both in determination of the support region and curvature estimation, if only the set of break points are considered as the possible dominant points.
In this paper, we use the adaptive bending value to determine the region of support for each point on the curve[12]. The bending value is defined as (see Fig. 1).

Suppose that there arembreak points on the curve. The valuekidenotes the length of regions of support for theith break point.It can be determined by the following procedure:
Algorithm 1. Determination of region of support
Step 1. Letk=1.
Step 2. Ifbi,k+1>bi,kthenki=kand stops.
Step 3. Increasingkby 1 and go to Step 2.
The region of support of theith break point,Bi, is the set of points defined by

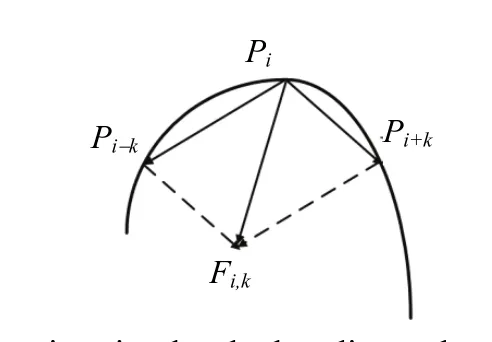
Fig. 1. Curvature estimation by the bending value.
Once the region of support for each break point has been determined, the estimated curvature can be obtained by the following smoothing bending value:

The next step is to identify the dominant points. It is necessary to suppress those break points with bending values less than a preset threshold ε.In addition, a dominant point should have a local maximum bending value. For two neighboring break points, the point with smaller length region of support is removed. Further, if two consecutive points has the same curvature and the same length of support region, the later one is discard.
Five conditions of suppressing the break points from the set of candidates of dominant points are summarized as follows.
Condition A.bi<ε
Condition B.bi< bj, forj=i-1 ori+1
Condition C.bi=bi-1andki<ki-1
Condition D.bi=bi+1andki<ki+1
Condition E.bi=bi+1andki=ki+1
The survived break points with the local maximum over its region of support are denoted as the dominant points. Therefore, we can locate of the dominant points by the following rule.
Rule.If one of the conditions A to E is satisfied, then the break point is removed from the set of candidates of dominant points.
Overall, the method for dominant point detection is summarized as follows.
Step 1: Extract the break points from Freeman’s chain codes.
Step 2: Determine the region of support for each break point by Algorithm 1.
Step 3: Compute the smoothing bending values for all of the break points by (4).
Step 4: Identify the dominant points by the rule.
The curve is partitioned into several segments after performing the above dominant point detection procedure. A rule is followed to classify them into linear segments and nonlinear segments. In this paper, the average distance is used as a criterion to assess the distortions caused by the approximated line segment, as seen in Fig. 2. It is defined as

wherediis the distance fromPito the approximated line segment.
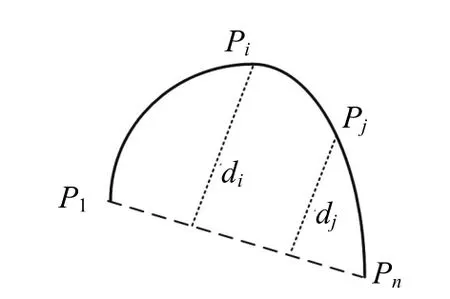
Fig. 2. Computation of average distance of a segment.
The smaller the average distance is, the better linearity is. A segment with a small average distance is considered as a linear segment. Otherwise, it will be considered as a nonlinear segment. The nonlinear segments will be the candidates of circles. They will be further processed to see if there are circles in the next circle fitting stage.
2.2Circle Fitting Stage
Once the nonlinear segments have been identified, it needs to determine if they are circular curves or not. The Thomas and Chan’s approach[13]is used to estimate the center (xc,yc) and radiusrfor each individual segment. For a set ofnpixels, (xi,yi) fori=1, 2, …,n, the center and radius can be estimated as
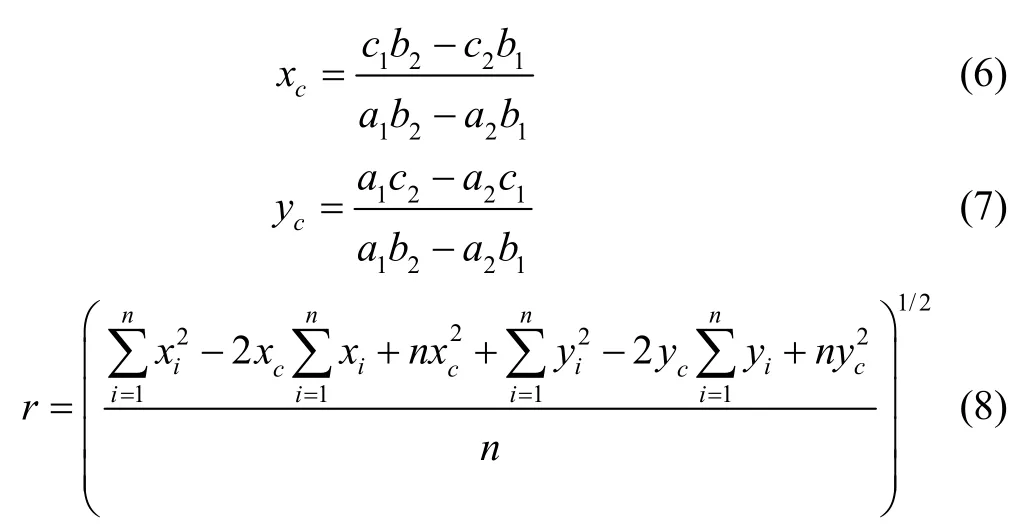
where
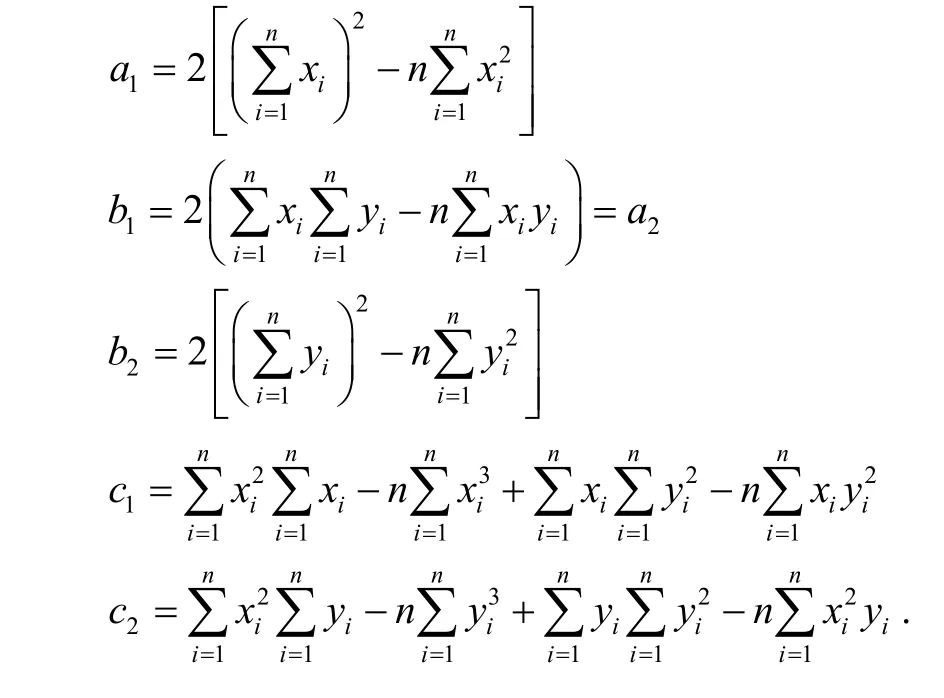
For each nonlinear segment, a set ofcan be found by using (5) to (7). In Fig. 3, suppose thatbe the estimated point of (xi,yi). We can find the distances between original points and their corresponding estimated points.
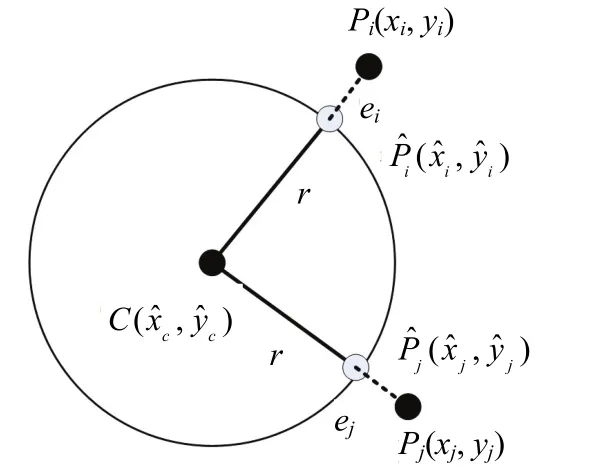
Fig. 3. Original points and estimated points for a circle with a set of center and radius.

where

is the distance between the original point and the estimated point.
If the fitting error of a nonlinear segment is less than a preset value, a circle is detected. Overall the proposed circle detection method can be summarized as follows.
Step 1: Partition a curve into several segments by using a dominant detection method.
Step 2: Classify the segments into linear segments and nonlinear segments.
Step 3: Perform the circle fitting procedure for each nonlinear segment.
Step 4: Detect the circles for the nonlinear segments with small fitting errors.
3. Experimental Results
In order to verify the proposed method, it has been tested on 100 images. Fig. 4 shows one example of the testing images. Each of the synthetic images includes several objects that are the perfect, broken, and occluded circular objects with random radius varying from 3 to 50 pixels. It is seen that the proposed method can detect the circles correctly. All the circles can be detected, and there is no false alarm.
Further, in order to access the ability of the proposed method under a noisy condition, two additional experiments have been conducted. Repeat the first experiment by adding noise the testing images with a signal to noise ratio (S/N) 20 dB and 40 dB, respectively. The experimental results show that the proposed method can correctly detect the circular objects of the images with noise. Again, there is no false alarm in the testing images.

Fig. 4. Example of testing image with several types of circular objects.
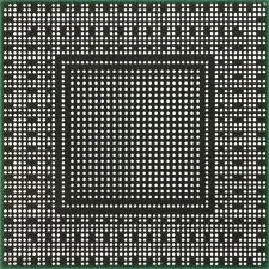
Fig. 5. One example of BGA image consists of circles.
Another testing image is shown in Fig. 5. The image consists of circles in BGA’s 2D projection view. The radius of the circles is about 3 pixels. The proposed method can detect all of the circles in this type of images. The mean of estimated radii is 3.04, and the standard deviation is 0.02. The estimation error is small and it has a small standard deviation. It is seen that the proposed circle detection method can detect the circles effectively.
4. Conclusions
A two-stage approach for circular object detection and location is proposed. Instead of transforming pixels into its parameter space by the HT approaches, a curve is first partitioned into linear segments and nonlinear segments. The second stage is a circle fitting process to find possible circles. The proposed method has the advantages of high speed and high accuracy, requiring rather small storage. The experimental results also indicate that the proposed is effective in detecting circular objects.
[1] D. H. Ballard, “Generalizing the Hough transform to detect arbitrary shapes,” Pattern Recognition, vol. 13, no. 2, pp. 111-122, 1981.
[2] D. Ioannou, W. Huda, and A. F. Laine, “Circle recognition through a 2D Hough transformation and radius histogramming,” Image and Vision Computing, vol. 17, no. 1, pp. 15-26, 1999.
[3] L. Jiang, “Efficient randomized Hough transform for circle detection using novel probability sampling and feature points,” Optik-Int. J. Light Electron Opt., vol. 123, no. 20, pp. 1834-1840, 2012.
[4] S. C. Pei and J. H. Horng, “Circular arc detection based on Hough transform,” Pattern Recognition Letters, vol. 16, no. 6, pp. 615-625, 1995.
[5] H. K. Yuen, J. Princen, J. Illingworth, and J. Kittler,“Comparative study of Hough transformation methods for circle finding,” Image and Vision Computing, vol. 8, no. 1, pp. 71-77, 1990.
[6] F. L. Chen and S. W. Lin, “Subpixel estimation of circle parameters using orthogonal circular detector,” Computer Vision and Image Understanding, vol. 78, no. 2, pp. 206-221, 2000.
[7] Z. M. Wojcik, “Quick recognition of circular objects in a black-white picture,” Pattern Recognition Letters, vol. 8, no. 4, pp. 277-288, 1988.
[8] L. H. Chen and K. L. Lee, “A new method for circular object detection and location,” Pattern Recognition Letters, vol. 11, no. 10, pp. 691-697, 1990.
[9] C. T. Ho and L. H. Chen, “A fast ellipse/circle detector using geometric symmetry,” Pattern Recognition, vol. 28, no. 1, pp. 117-124, 1995.
[10] W.-Y. Wu and W.-B. Yu, “Subpixel detection of circular objects using geometric property,” in Proc. of Int. Conf. on Image, Signal and Vision Computing, Singapore, 2009, pp. 236-240.
[11] Z. Yu and C. Bajaj, “Detecting circular and rectangular particles based on geometric feature detection in electron micro-graphs,” Journal of Structural Biology, vol. 145, no. 1-2, pp. 168-180, 2004.
[12] W.-Y. Wu, “Dominant point detection using adaptive bending value,” Image and Vision Computing, vol. 21, no. 6, pp. 517-525, 2003.
[13] S. M. Thomas and Y. T. Chan, “A simple approach for the estimation of circular arc center and its radii,” Computer Vision, Graphics, and Image Processing, vol. 45, no. 3, pp. 362-370, 1989.

Wen-Yen Wuwas born in Taiwan in 1966. He received his B.S. degree in mathematical sciences from National Chengchi University, Taipei in 1988, and M.S. and Ph.D. degrees both in industrial engineering from National Tsing Hua University, Hsinchu in 1990 and 1993, respectively. He has been a professor in industrial management with I-Shou University, Kaohsiung since 2001. His research interests include automated inspection, machine vision, fuzzy set theory, pattern recognition, and anthropometric applications. Dr. Wu is a member of the Phi Tau Phi, the Chinese IPPR Society, the Chinese Institute of Industrial Engineers, the Ergonomics Society of Taiwan, the Chinese Fuzzy Systems Association, and the Chinese Institute of Automation Engineers.
Manuscript received December 11, 2013; revised March 12, 2014. This work was supported by the I-Shou University under Grant No. ISU 102-05-01.
W.-Y. Wu is with the Department of Industrial Management, I-Shou University, Kaohsing 84001 (e-mail: wywu@isu.edu.tw).
Digital Object Identifier: 10.3969/j.issn.1674-862X.2014.03.014
 Journal of Electronic Science and Technology2014年3期
- Journal of Electronic Science and Technology的其它文章
- Guest Editorial Special Section on Energy-Efficient Technologies
- Guest Editorial TTA Special Section on Terahertz Materials and Devices
- Object Tracking Using a Particle Filter with SURF Feature
- Numerical Solution for Fractional Partial Differential Equation with Bernstein Polynomials
- Role of Gate in Triode-Structure for Carbon Nanotube Cold Cathode
- A High Efficiency Fully Integrated OOK Transmitter for WBAN
