JPA Prize in 2012

JPA Prize Medal
The six top cited papers awarded the 2012 JPA Prize were as follows:
1. Akhilesh Vikram Singh*, Lila K. Nath, Nihar R. Pani. Development and validation of analytical method for the estimation of lamivudine in rabbit plasma.
Journal of Pharmaceutical Analysis, 2011,1(4):251-257.
2. E. Gerace*, A. Salomone, G. Abbadessa, S. Racca, M. Vincenti. Rapid determination of anti-estrogens by gas chromatography/mass spectrometry in urine: Method validation and application to real samples.
Journal of Pharmaceutical Analysis, 2012,2(1):1-11.

Figure 4 Selected-ion chromatograms of extracted urine samples obtained from patients treated with (B) letrozole. For letrozole the metabolites, not the original drug, are detected. Left: urine spiked reference standard; center: blank urine; right: real urine samples.
3. Hu Yu, Hui Mu*, Ying-Mei Hu. Determination of fl uoroquinolones, sulfonamides, and tetracyclines multiresidues simultaneously in porcine tissue by MSPD and HPLC-DAD.
Journal of Pharmaceutical Analysis, 2012,2(1):76-81.
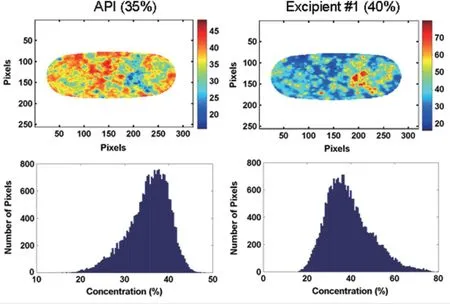
4. Anna Palou, Jordi Cruz, Marcelo Blanco, Jaume Tomàs, Joaquín de los Ríos, Manel Alcalà*. Determination of drug, excipients and coating distribution in pharmaceutical tablets using NIR-CI.
Journal of Pharmaceutical Analysis, 2012,2(2):90-97.

Figure 4 Concentration distribution maps and histograms for API and excipients for side A of a core calculated by PLS. In parenthesis is shown the nominal concentration (% w/w) of each component.
5. Rajeev Jain*, Rajeev Kumar Yadav. Voltammetric behavior of sedative drug midazolam at glassy carbon electrode in solubilized systems.
Journal of Pharmaceutical Analysis, 2012,2(2):123-129.

Figure 5 (A) Differential pulse voltammograms of midazolam at various concentrations (i) 150 μg/mL, (ii) 300 μg/mL, (iii) 450 μg/mL, (iv) 600 μg/mL, (v) 750 μg/mL and (vi) 900 μg/mL. (B) Inset picture represents linearity curve of peak 1 at different concentrations. (C) Inset picture represents linearity curve of peak 2 at different concentrations. (D) Inset picture represents linearity curve of peak 3 at different concentrations.
6. Hua-Jin Zeng, Ran Yang, Bing Liu, Li-Fang Lei, Jian-Jun Li, Ling-Bo Qu*. Simple and sensitive determination of sparfl oxacin in pharmaceuticals and biological samples by immunoassay.
Journal of Pharmaceutical Analysis, 2012,2(3):214-219.
 Journal of Pharmaceutical Analysis2013年2期
- Journal of Pharmaceutical Analysis的其它文章
- Application of analytical instruments in pharmaceutical analysis
- Reversed-phase fused-core HPLC modeling of peptides
- Establishment of inherent stability of pramipexole and development of validated stability indicating LC-UV and LC-MS method
- Determination of cefcapene acid by LC-MS and their application to a pharmacokinetic study in healthy Chinese volunteers
- New simple spectrophotometric method for determination of the binary mixtures (atorvastatin calcium and ezetimibe;candesartan cilexetil and hydrochlorothiazide) in tablets
- Liquid chromatography tandem mass spectrometry method for the estimation of lamotrigine in human plasma:Application to a pharmacokinetic study
