New simple spectrophotometric method for determination of the binary mixtures (atorvastatin calcium and ezetimibe;candesartan cilexetil and hydrochlorothiazide) in tablets
Tarek S. Belal, Hoda G. Daaees, Magdi M. Adel-Khalek,Mohamed S. Mahrous, Mona M. Khamis
aPharmaceutical Analytical Chemistry Department,Faculty of Pharmacy,University of Alexandria,Elmessalah 21521,Alexandria,Egypt
bPharmaceutical Chemistry Department, Faculty of Pharmacy, University of Alexandria, Elmessalah 21521, Alexandria, Egypt
1. Introduction
One of the main challenges facing analytical chemists is the spectrophotometric determination of two or more compounds in the same sample without preliminary separation.The generation of absorbance ratio spectra has been the basis of several analytical procedures for the simultaneous spectrophotometric determination of compounds in binary and ternary mixtures. First, binary mixtures were resolved using the ratio-spectra derivative method [1,2]. Then, this method was modified and extended for the determination of ternary mixtures. Examples of these modified versions are the derivative ratio spectra zero-crossing method [3,4], the double divisor ratio spectra derivative method [5] and the successive derivative ratio spectra method [6]. Furthermore, the ratio spectra were exploited for the development of other mathematical methods for resolution of binary and ternary mixtures such as the mean centering of ratio spectra method[7]and the ratio subtraction method [8]. In most of these methods, at least two mathematical processes (e.g., division followed by derivative curve generation) are needed in order to get the measurable amplitude that is correlated to the concentration of only one compound without interference from the others in the mixture. Obviously, some methods need more sophisticated mathematical treatment to unambiguously determine the target compound in presence of interferences [8].
Atorvastatin calcium (ATV), a 3-hydroxy-3-methylglutaryl coenzyme A (HMG-CoA) reductase inhibitor, is a lipid regulating drug used to reduce LDL-cholesterol, apolipoprotein B and triglycerides, and to increase HDL-cholesterol in the treatment of hyperlipidaemias. It is also used for prophylaxis of cardiovascular events in patients with multiple risk factors including diabetes mellitus [9]. Ezetimibe (EZE) is an inhibitor of intestinal absorption of cholesterol and plant sterols. It is used to reduce total cholesterol, LDL-cholesterol and apolipoprotein B in the management of hyperlipidaemias[9]. The assay of the antihyperlipidemic combination of ATV and EZE was the subject of several analytical reports. These reports recommended the use of capillary electrophoresis [10],high performance thin layer chromatography (HPTLC)[11-13] and several high performance liquid chromatography(HPLC) with UV detection methods [14-17]. The simultaneous spectrophotometric determination of ATV and EZE was carried out using the H-point standard additions method[18], the ratio-spectra derivative method [18], the dual wavelength method [19,20] and the mean centering of ratio spectra[20]. Moreover, difference spectrophotometry (ΔA method)was applied for the determination of EZE in presence of the co-existing drug ATV [18].
Candesartan cilexetil (CAN) is an angiotensin II receptor antagonist. It is used in the management of hypertension and may also be used in heart failure in patients with impaired left ventricular systolic function[9].Hydrochlorothiazide(HCT)is a moderately potent diuretic.It exerts its effect by reducing the re-absorption of electrolytes from the renal tubules, thereby increasing the excretion of sodium and chloride ions, and consequently of water. HCT is used in the treatment of hypertension either alone or with other antihypertensives. It is also used to treat oedema associated with heart failure and with renal and hepatic disorders [9]. The simultaneous determination of CAN and HCT in their binary combination was addressed in several analytical reports.These reports proposed capillary electrophoresis [21], HPTLC [22-24] and HPLC-UV detection methods[25,26].An HPLC coupled with photodiode array detector method was developed for the simultaneous analysis of CAN and HCT in human plasma and dosage forms [27]. On the other hand, spectrophotometric methods used for the assay of this antihypertensive mixture include difference spectrophotometry[24],derivative spectrophotometry [28,29], the ratio-spectra derivative method [28] and the Q-absorbance method [30].
In this study, a new ratio spectra peak to peak measurement method was described for the determination of these two binary mixtures without prior separation. The method employs only one step (dividing the mixture spectra by a standard divisor spectrum), followed by peak to peak measurement in the produced ratio spectra. The method eliminates the derivative step, and does not require searching for zero-crossing points or any sophisticated mathematical or chemometric treatment of data. The developed method was validated and successfully applied for the assay of these drug combinations in their commercial tablets.
2. Theoretical background
Consider a mixture of two compounds X and Y. The absorption spectrum of the mixture - measured in 1 cm path length - is defined by the equation:

where AMis the absorbance of the mixture, εXand εYare the molar absorptivities of X and Y and CXand CYare the concentrations of X and Y, respectively. If the absorbance of the mixture is divided by the absorbance of a standard solution of X (AbsorbanceAX°=εX×CX°), the following equation results:

The ratio CX/CX° is a constant value which can be eliminated by taking the difference in absorbance ratio amplitudes between two wavelengths λ1and λ2(peak to peak measurement):
Eq. (3) illustrates that the difference amplitude in the mixture absorbance ratio between two wavelengths λ1and λ2(can be called peak to peak, peak to trough or maximum to minimum measurement) is equal to the same difference amplitude for compound Y after canceling the constant interference due to compound X. In the proposed method,the concentration of compound Y (CY) is proportional to the peak to peak amplitudes in its absorbance ratio spectra. A calibration graph is obtained by recording and storing the spectra of solutions of different concentrations of pure Y,and the spectrum of a solution of pure X (the divisor X°). The stored spectra of the solutions of pure Y are divided by the standard spectrum of the divisor (X°). In the generated ratio spectra, the peak to peak amplitudes between the selected wavelengths λ1and λ2are measured and plotted against CYto obtain the calibration graph. By using the calibration graph,the concentration of compound Y in the mixture is determined after similar treatment for the mixture solution. The concentration of X in the mixture is determined by analogous procedure.
3. Experimental
3.1. Apparatus
Helios a UV-VIS spectrophotometer (Unicam, Cambridge,UK)connected to a PC equipped with Vision 32 Software was used. Absorbance measurements were recorded in a pair of 10 mm matched quartz cells. The scan speed was set at 1200 nm/min and the band width was fixed at 2 nm.
3.2. Materials
ATV and CAN were kindly supplied by Pharonia Pharmaceuticals Co. (Alexandria, Egypt), HCT was a gift from Pharco Pharmaceuticals Co. (Alexandria, Egypt) and EZE was kindly provided by Adwia Pharmaceuticals Co. (Cairo,Egypt). Methanol and sodium hydroxide used were of analytical grade. Distilled water was used throughout the work.Atoreza®tablets(BN.1131996)labeled to contain 10 mg EZE and 10.85 mg ATV are manufactured by Marcyrl Pharmaceutical industries,Egypt.Atacand Plus®tablets(BN.110276D1)labeled to contain 16 mg CAN and 12.5 mg HCT are manufactured by AstraZeneca,Egypt under license of AstraZeneca,Sweden. Both pharmaceutical preparations were purchased from the local market.
3.3. General procedure
For mixture 1, stock solutions of EZE 500 μg/mL and ATV 500 μg/mL were prepared in methanol. Portions of both solutions were separately diluted with methanol to attain the concentration ranges specified in Table 1. The absorption spectra of the prepared standard solutions were recorded in the range of 200-340 nm against methanol. For the determination of ATV, the recorded absorption spectra were divided,wavelength by wavelength, by the spectrum of a standard solution of EZE 10 μg/mL in methanol. The peak to trough amplitudes in the obtained ATV ratio spectra between 231 and 276 nm were measured and plotted versus the corresponding concentration.Similarly,a standard spectrum of ATV 10 μg/mL was used as a divisor in the determination of EZE and the peak to trough measurements between 231 and 276 nm were recorded.
For mixture 2, stock solutions of CAN 500 μg/mL and HCT 500 μg/mL were prepared in methanol. For the construction of the calibration curves; aliquots of both solutions,covering the concentration ranges mentioned in Table 1, were transferred into 2 separate sets of 10 mL volumetric flasks.The volume in each flask was adjusted to 1 mL with methanol then diluted to the mark with 0.1 M sodium hydroxide solution. The absorption spectra of the prepared standard solutions were recorded in the range of 200-340 nm against solvent blank. For generation of CAN ratio spectra, a standard spectrum of HCT 7.5 μg/mL was set as the divisor,and the peak to trough measurements between 251 and 277 nm were used for construction of the calibration graph.As for HCT calibration, the absorption spectra were divided by CAN 7.5 μg/mL standard spectrum then the peak to trough amplitudes between 251 and 276 nm were measured and plotted versus the corresponding concentration.
3.4. Assay of commercial tablets
3.4.1. Mixture 1 (ATV-EZE)
Ten Atoreza®tablets were weighed, powdered and mixed. An accurately weighed portion of the powdered tablets equivalent to 25 mg EZE was transferred into a 50 mL volumetric flask and extracted in 30 mL methanol with the aid of a vortex mixer.The mixture was completed to volume with the same solvent and filtered to produce tablets-extract solution containing EZE500 μg/mL and ATV 540 μg/mL. Portions of the extract were treated as previously described under general procedure.
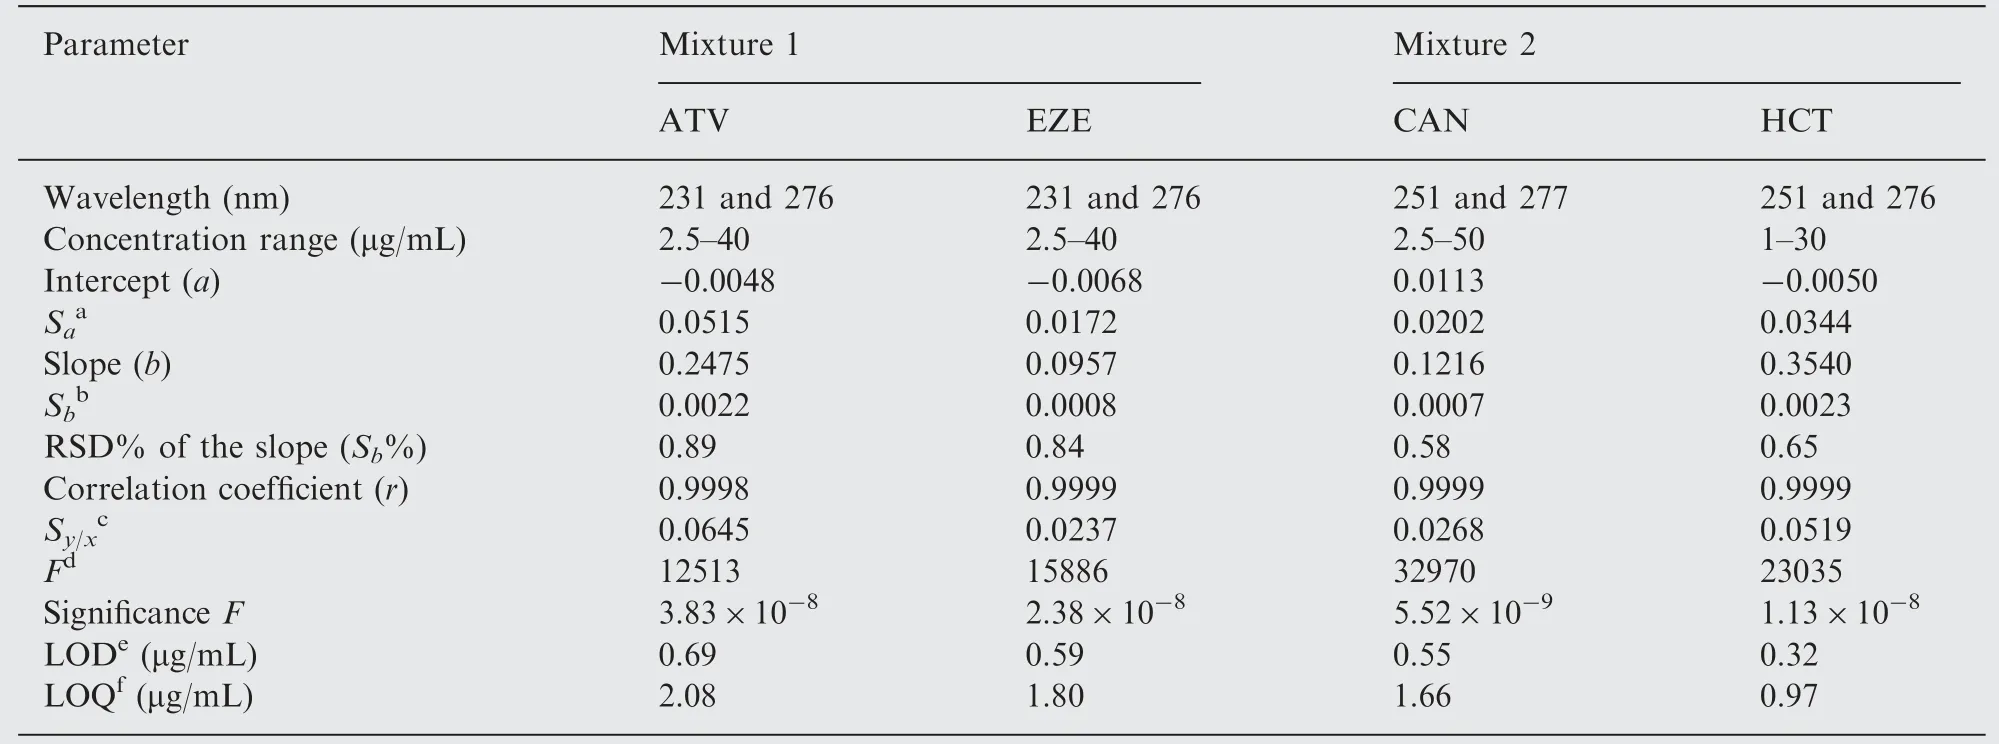
Table 1 Regression and analytical parameters for the determination of the two drug combinations using the proposed spectrophotometric method.
3.4.2. Mixture 2 (CAN-HCT)
Ten Atacand Plus®were weighted, finely powdered and mixed. A quantity of the powdered tablets equivalent to 25 mg HCT was transferred into a 50 mL volumetric flask and the aforementioned extraction procedure was followed.The produced tablets-extract solution is labeled to contain HCT 500 μg/mL and CAN 640 μg/mL. Aliquots of the prepared extract were treated as previously described.
4. Results and discussion
4.1. Spectral characteristics and optimization of the measurements
4.1.1. Mixture 1 (ATV-EZE)
The absorption spectra of ATV and EZE show a strong overlap which hinders the use of conventional UV spectrophotometry for their simultaneous determination in a binary mixture (Fig.1). To overcome the mutual interference of each compound in the determination of the other,a simple one-step correction procedure based on the absorbance ratio spectra was developed. Regarding method optimization; the effect of the diluting solvent on the intensity of measurements was investigated. Aqueous solvents including water, 0.1 M sodium hydroxide (NaOH) and 0.1 M hydrochloric acid (HCl) were excluded either due to EZE insolubility or its β-lactam ring instability [31], and accordingly methanol was used for dilution. A study was carried out to examine the effect of divisor concentration on the ratio spectra of ATV and EZE.When the concentration of divisor is increased or decreased,the resulting absorbance ratio values proportionally decrease or increase, respectively; however, the positions of the peaks and troughs remain unaffected by changing the divisor concentration. Divisor concentration was tested in the range of 5-15 μg/mL.A concentration of 10 μg/mL of either ATV or EZE produced the best results in terms of signal-to-noise ratio,sensitivity, accuracy and repeatability of measurements.
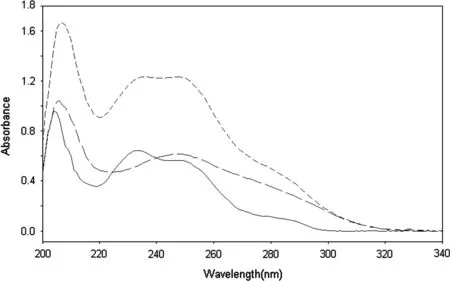
Fig.1 Absorption spectra of ATV 15 μg/mL(---),EZE 15 μg/mL(——)and a mixture of ATV 15 μg/mL and EZE 15 μg/mL(----).

Fig.2 (A) Ratio spectra of ATV (7.5, 10, 15, 20, 30, 40 μg/mL).(B) Ratio spectra of ATV 20 μg/mL and a mixture containing ATV 20 μg/mL and EZE 20 μg/mL. Divisor used was 10 μg/mL EZE.
The ratio spectra of different ATV standards at increasing concentrations in methanol, obtained by dividing each by the spectrum of 10 μg/mL EZE in the same solvent are illustrated in Fig.2A. The peak to trough amplitudes between 231 and 276 nm on the generated ratio spectra are proportional to ATV concentration. Fig.2B shows the ratio spectra of a standard solution of ATV and a mixture solution containing the same concentration of ATV. The difference between the 2 spectra is the constant interference value (the term CX/CX° in Eq.(2)).This interference was eliminated in Salinas method[1]by recording the first derivative of the mixture ratio spectrum.Alternatively, the constant interference can be eliminated by measurement of the absorbance ratio difference between two selected wavelengths λ1and λ2. Ideally, these selected wavelengths should correspond to the peak and the trough in the ratio spectrum in order to achieve the highest sensitivity.Fig.2B shows that the peak to trough amplitude in the mixture spectrum is equal to that in standard ATV spectrum;therefore ATV can be quantified in the mixture without interference from EZE. For the determination of EZE, an analogous procedure was followed. Fig.3A shows the ratio spectra of different standards of EZE using 10 μg/mL ATV as divisor. The peak to trough amplitudes between 231 and 276 nm on the produced ratio spectra were measured and found proportional to EZE concentration. Fig.3B presents the ratio spectra of a standard solution of EZE and a mixture solution containing the same concentration of the drug. It is evident that the measured peak to trough amplitude in the mixture spectrum is equal to that in standard EZE spectrum.
4.1.2. Mixture 2 (CAN-HCT)
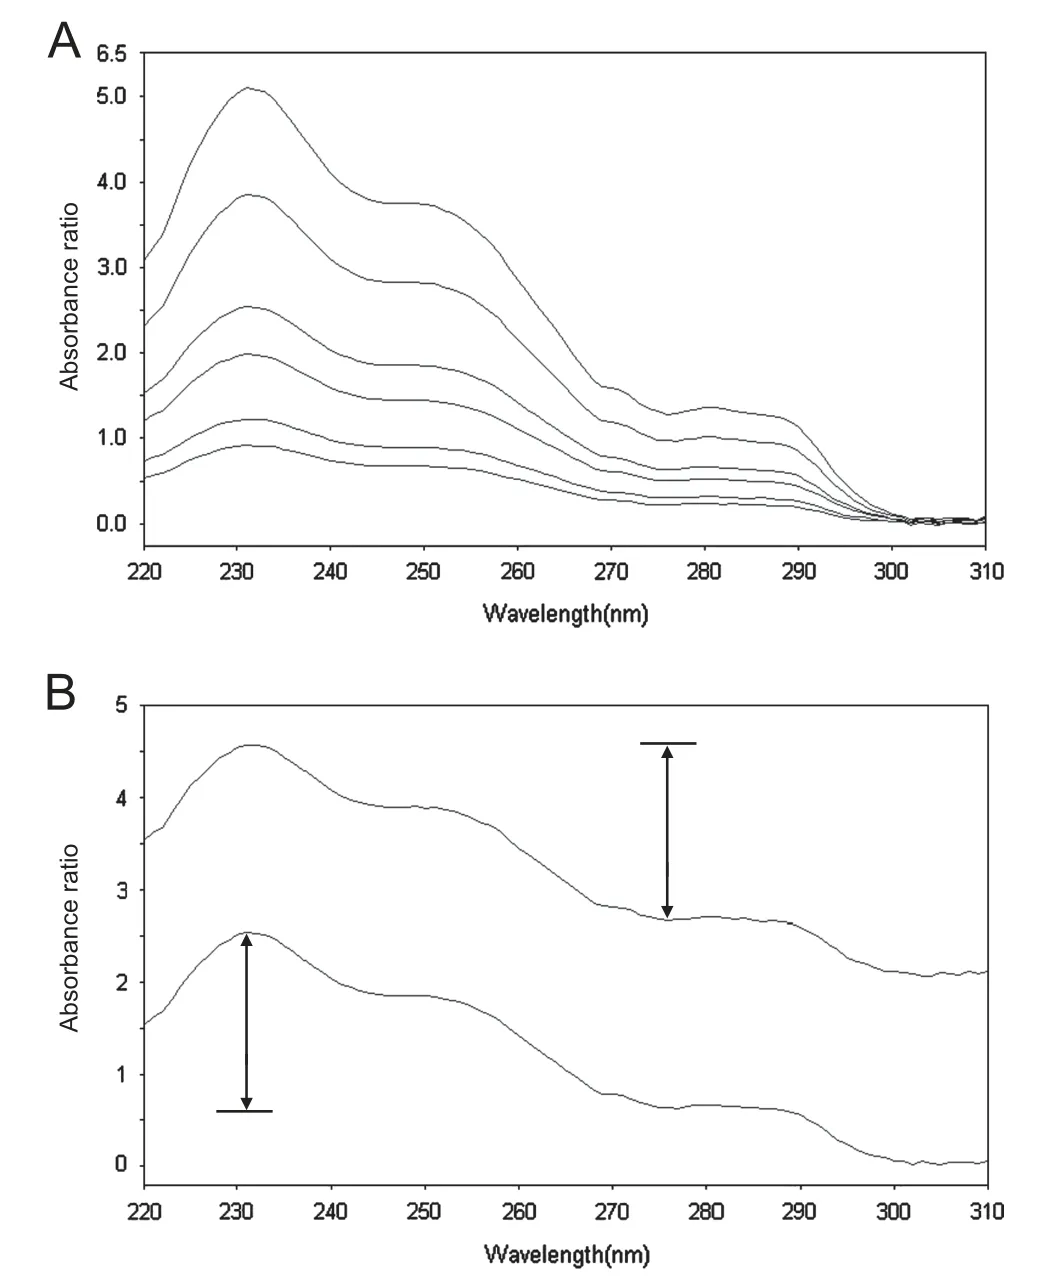
Fig.3 (A) Ratio spectra of EZE (7.5, 10, 15, 20, 30, 40 μg/mL).(B)Ratio spectra of EZE 20 μg/mL and a mixture containing EZE 20 μg/mL and ATV 20 μg/mL. Divisor used was 10 μg/mL ATV.

Fig.4 Absorption spectra of CAN 20 μg/mL (- - -), HCT 20 μg/mL (——) and a mixture of CAN 20 μg/mL and HCT 20 μg/mL (- - - -).
CAN and HCT mixture is another example where the two drugs exhibit overlapping spectra as shown in Fig.4. Therefore, their spectrophotometric simultaneous determination necessitates the mathematical treatment of the data so as to resolve such a mixture. That was fruitfully achieved via the application of the same principle adopted in mixture 1. Concerning the choice of the diluting solvent; water and 0.1 M HCl were excluded due to CAN insolubility. 0.1 M NaOH was favored over methanol as the former exhibited higher absorptivities, in addition to, more precise and accurate measurements. The divisor concentration was also studied in the range of 5-15 μg/mL and optimized at 7.5 μg/mL for both drugs.

Fig.5 (A) Ratio spectra of CAN (5, 10, 20, 30, 40, 50 μg/mL).(B) Ratio spectra of CAN 20 μg/mL and a mixture containing CAN 20 μg/mL and HCT 20 μg/mL. Divisor used was 7.5 μg/mL HCT.
The ratio spectra obtained from the division of CAN absorption spectra by a standard spectrum of HCT showed a peak at 251 nm and a trough at 277 nm (Fig.5A). The peak to trough measurements between 251 and 277 nm were used for the construction of CAN calibration equation. Fig.5B shows that the peak to trough amplitudes for a standard CAN and a parallel mixture are identical; therefore CAN can be quantified in the mixture without interference from the coexisting drug HCT.Similarly by using CAN as the divisor,the peak to trough amplitudes at 251-276 nm were selected for HCT determination (Fig.6A).Fig.6B shows the ratio spectra of a standard solution of HCT and a mixture solution containing the same concentration of the drug. Obviously,the measured peak to trough amplitude in the mixture ratio spectrum is equal to that of the standard.
4.2. Validation of the proposed spectrophotometric method
4.2.1. Linearity and ranges
The linearity of the proposed method was evaluated through the analysis of six serial concentrations of each drug.The produced response was plotted as a function of the corresponding concentration and the calibration equation was calculated using the least squares regression method.Table 1 summarizes the regression and statistical parameters of the studied drugs. As seen, the regression analysis verifies the good linearity of the method as indicated by the close to unity correlation coefficient (r) values. Moreover, the low values of the standard deviation of the intercept(Sa),standard deviation of the slope (Sb) and standard deviation of the residuals (Sy/x) suggest the good linearity of the developed method and the negligible scatter of the points around the fitted regression lines. Additionally, the linearity could be appraised through the calculation of the RSD% of the slope(Sb%) as the values obtained were less than 1%. The analysis of variance test for the regression lines reveals that, for equal degrees of freedom,an increase in the variance ratio(F values)means an increase in the mean of squares due to regression and a decrease in the mean of squares due to residuals. The greater the mean of squares is due to regression, the steeper the regression line is.The smaller the mean of squares is due to residuals,the less the scatter of experimental points around the regression line is. Consequently, regression lines with high F values (low significance F) are much better than those with lower ones. Good regression lines show high values for both r and F statistical parameters [32].

Fig.6 (A) Ratio spectra of HCT (2.5, 5, 10, 15, 20, 30 μg/mL).(B) Ratio spectra of HCT 20 μg/mL and a mixture containing HCT 20 μg/mL and CAN 20 μg/mL, Divisor used was 7.5 μg/mL CAN.
4.2.2. Limits of detection and quantification
Limits of detection (LOD) and quantification (LOQ) were calculated according to the ICH guidelines [33]. LOD was defined as 3.3Sa/b and LOQ was computed as 10Sa/b, where Sais the standard deviation of the intercept and b is the slope of the calibration curve. The sensitivity of the proposed method can be confirmed by the low LOD and LOQ values obtained (Table 1).
4.2.3. Precision and accuracy
According to the ICH guidelines [33], the within-day repeatability of the proposed method was assessed through the analysis of 3 concentration levels prepared in triplicates.Correspondingly, the between-day precision was studied on the same levels over 3 consecutive days. Table 2 contains the values of percentage relative standard deviation (RSD%)which did not exceed 1.7% for both mixtures indicating the acceptable level of precision of the proposed method. The adequate recovered concentrations in addition to the low values of percentage relative error (Er%) gathered in Table 2 also confirm the accuracy of the developed method.
4.2.4. Stability of solutions
Stock solutions of the studied drugs were found stable at 4°C for a period of not less than 2 weeks. Also, stability of theprepared standard solutions in methanol (for Mixture 1) and in 0.1 M NaOH (for Mixture 2) was verified by keeping them at room temperature for 4 h, and no significant spectrophotometric changes were noticed.
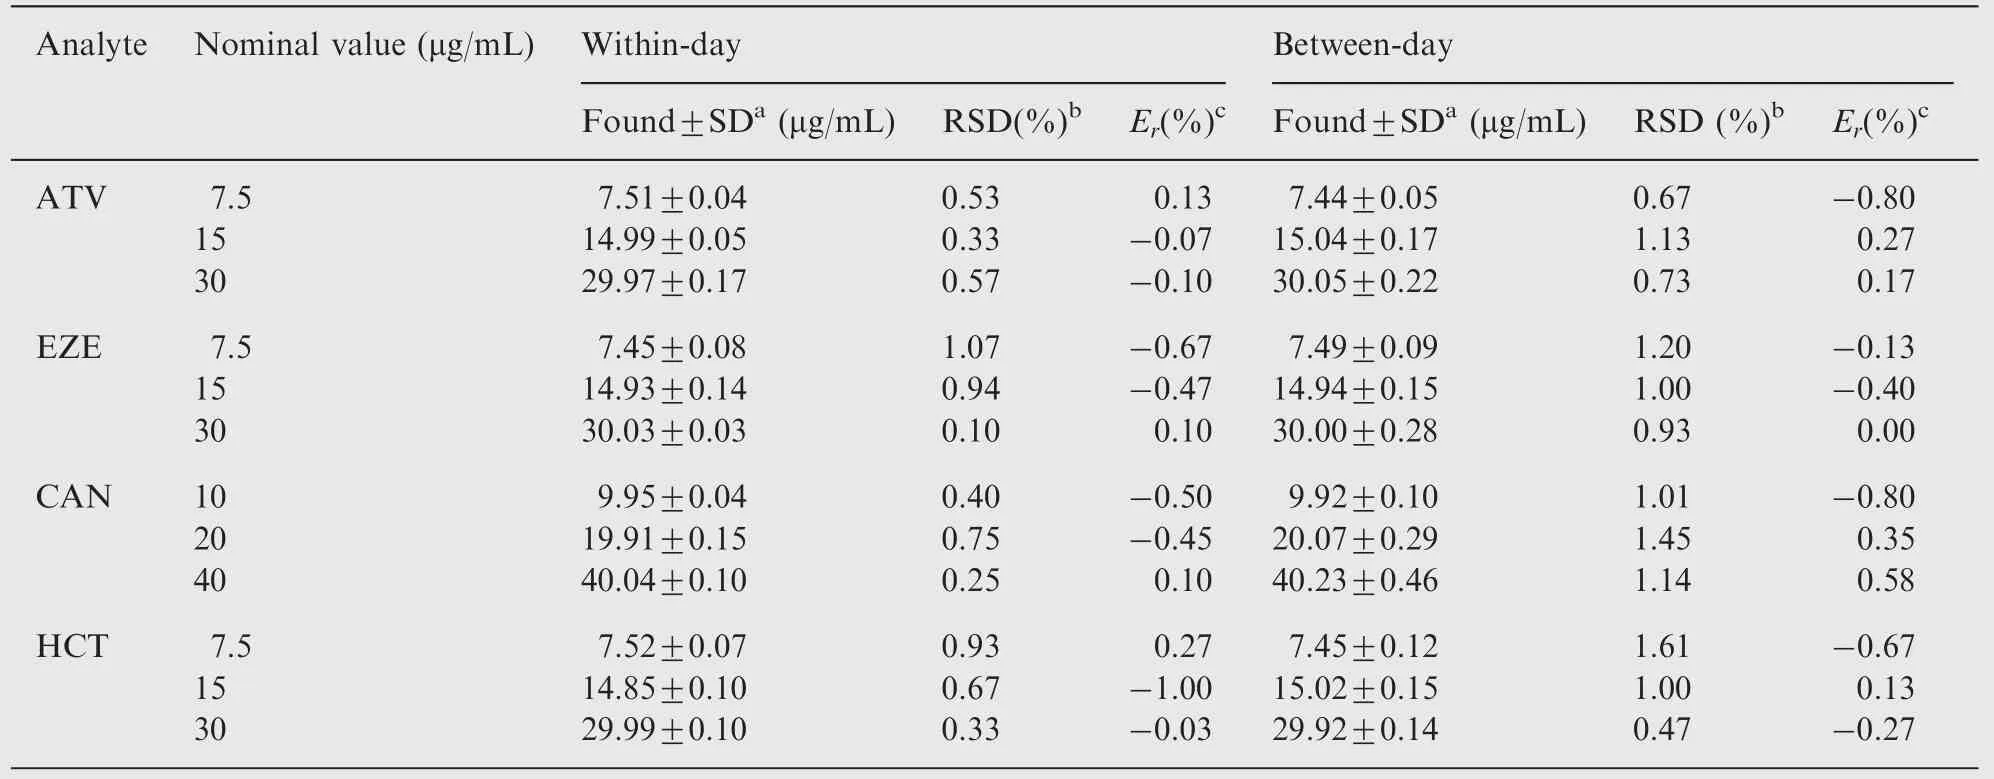
Table 2 Precision and accuracy for the determination of the four drugs in bulk form using the proposed spectrophotometric method.
4.3. Applications of the proposed method
4.3.1. Analysis of laboratory-prepared synthetic mixtures
In order to further assess the applicability of the proposed method for the determination of the selected drugs in their binary solutions, synthetic mixtures were prepared. These mixtures contained different ratios of each drug pair; both above and below their normal ratios in tablets.The acceptable recovered concentrations, values of RSD(%) and Er(%)compiled in Tables 3 and 4 for ATV-EZE and CAN-HCT mixtures, respectively, confirm the accuracy and precision of the method, and demonstrate its analytical power to resolve and quantify the investigated drugs when present in different proportions.
4.3.2. Analysis of commercial tablets
The proposed method was successfully applied to the analysis of both mixtures in their pharmaceutical preparations.Results obtained were precise and in good agreement with the labeled claim as concluded from the satisfactory values of%recovery and RSD(%) gathered in Table 5. An HPLC-UV [15] and anHPLC-DAD [27] reference methods were applied to the analysis of Atoreza®and Atacand Plus®tablets extract solutions, respectively. Statistical comparison of the results was achieved through Student's t-test for accuracy and variance ratio F-test for precision and revealed no significant differences between the proposed and reference HPLC methods at the 95% confidence level (Table 5). Furthermore,standard addition technique was also applied by adding the pure drugs to aliquots of the tablets extracts, and recovery of each drug was then calculated by comparing the drug response with the increment response attained after addition of the standard. Recoveries and RSD(%) values obtained by application of the standard addition technique are shown in Table 6. The good recoveries obtained using both external standard and standard addition methods (Tables 5 and 6)suggest that there was no interference from the co-formulated inactive ingredients. It is evident from these results that the proposed method is applicable to the assay of both drug combinations with minimum sample preparation and satisfactory levels of accuracy and precision.

Table 3 Determination of ATV-EZE laboratory-prepared mixtures using the proposed spectrophotometric method.

Table 4 Determination of CAN-HCT laboratory-prepared mixtures using the proposed spectrophotometric method.

Table 5 Analysis of ATV-EZE mixture in Atoreza® tablets and CAN-HCT mixture in Atacand Plus® tablets by the proposed spectrophotometric method and the reference method.

Table 6 Application of standard addition technique for analysis of ATV-EZE mixture in Atoreza® tablets and CAN-HCT mixture in Atacand Plus® tablets.
4.4. Comparison with other spectrophotometric methods
The new spectrophotometric method is adequate for the routine quality control analysis of the cited compounds in their commercial preparations.It could be also extended to the analysis of other fixed-dose combination products containing drugs with interfering spectra. In addition, it is advantageous over other spectrophotometric techniques employing mathematical transformation of the absorption data for binary mixture resolution. In this simple method, one compound could be determined through the peak to peak or peak to trough measurements at two selected wavelengths in this compound ratio spectra. Via this approach, the interference due to the other coexisting compound is converted into a constant through division and subsequently deleted through subtraction.
Compared to derivative spectrophotometry, this method avoids searching for the appropriate wavelength in the derivative spectrum of the compound under analysis corresponding to a zero-crossing point for the interfering compound. Some binary mixtures require the use of higher derivative orders (3rd or 4th) to find suitable points for determination of one compound without interference from the other. Unlike derivative ratio, the proposed method lacks the additional step of the derivative curve generation.It is also much simpler than the ratio subtraction method as it does not include the sequential order of manipulations viz. division,constant subtraction and multiplication. Moreover, it can be used for the quantification of both drugs concurrently rather than the need for an additional method for the extended component. Difference spectrophotometry (ΔA method)seems to be a simple technique for analysis of one compound in presence of another based on the zero order spectra;however, it requires the preparation of each sample in two different solvent media; a time, chemicals and solvents consuming problem that is absent in the current method.Finally, the proposed method does not include the tedious search for two wavelengths where the interfering compound shows the same absorptivity as in dual wavelength method.
5. Conclusion
A novel, simple, rapid and sensitive method is proposed for the analysis of two binary mixtures with overlapping spectra. The method involves the generation of absorbance ratio spectra followed by measurement of the peak to trough amplitudes.The proposed method does not require any sophisticated mathematical treatment for the absorption data, and it exhibits several advantages over other spectrophotometric methods for resolution of binary mixtures.ATV and EZE in the first mixture as well as CAN and HCT in the second one were well resolved and quantified without prior separation through simple mathematical treatment. The applicability of the developed method was evaluated through the determination of both drug combinations in several laboratory-prepared mixtures and in pharmaceutical tablets with good accuracy and precision. Therefore, the presented methodology is adequate for the routine quality control analysis of these fixed-dose combinations.
[1] F. Salinas, J.J. Berzas Nevado, A.E. Mansilla, A new spectrophotometric method for quantitative multicomponent analysis.Resolution of mixtures of salicylic and salicyluric acids, Talanta 37 (3) (1990) 347-351.
[2] N. Erk, Simultaneous determination of dorzolamide HCL and timolol maleate in eye drops by two different spectroscopic methods, J. Pharm. Biomed. Anal. 28 (2) (2002) 391-397.
[3] F.A. El-Yazbi, H.H. Hammud, S.A. Assi, Derivative-ratio spectrophotometric method for the determination of ternary mixture of aspirin, paracetamol and salicylic acid, Spectrochim.Acta, Part A 68 (2) (2007) 275-278.
[4] M.H.Abdel-Hay,A.A.Gazy,E.M.Hassan,et al.,Derivative and derivative ratio spectrophotometric analysis of antihypertensive ternary mixture of amiloride hydrochloride, hydrochlorothiazide and timolol maleate, J. Chin. Chem. Soc. 55 (5) (2008) 971-978.
[5] C.K. Markopoulou, E.T. Malliou, J.E. Koundourellis, Content uniformity and dissolution tests of triplicate mixtures by a double divisor-ratio spectra derivative method, Farmaco 60 (9) (2005)755-762.
[6] A. Afkhami, M. Bahram, Successive ratio-derivative spectra as a new spectrophotometric method for the analysis of ternary mixtures, Spectrochim. Acta, Part A 61 (5) (2005) 869-877.
[7] A. Afkhami, M. Bahram, Mean centering of ratio spectra as a new spectrophotometric method for the analysis of binary and ternary mixtures, Talanta 66 (3) (2005) 712-720.
[8] M.R. El-Ghobashy, N.F. Abo-Talib, Spectrophotometric methods for the simultaneous determination of binary mixture of metronidazole and diloxanide furoate without prior separation,J. Adv. Res. 1 (4) (2010) 323-329.
[9] S.C. Sweetman, thirty-sixth ed., Martindale-The Complete Drug Reference, 1, The Pharmaceutical Press, London, UK, 2009,pp.1218-1219, 1238-1239, 1284-1285, 1307-1310.
[10] M.M. AlShehri, A validated capillary electrophoresis method for simultaneous determination of ezetimibe and atorvastatin in pharmaceutical formulations, Saudi Pharm. J. 20 (2) (2012) 143-148.
[11] B.G.Chaudhari,N.M. Patel, P.B. Shah,et al., Development and validation of a HPTLC method for the simultaneous estimation of atorvastatin calcium and ezetimibe, Indian J. Pharm. Sci. 68(6) (2006) 793-796.
[12] R. Aiyalu, K. Mani, HPTLC method development, validation,and stress degradation studies for atorvastatin and ezetimibe in multicomponent tablet dosage form, Med. Chem. Res. 21 (7)(2012) 1297-1301.
[13] C.R. MacWana, A.J. Patel, V.M. Parmar, et al., Simultaneous HPTLC analysis of atorvastatin calcium, ezetimibe, and fenofibrate in tablet, J. Liq. Chromatogr. Related Technol. 35 (4)(2012) 524-532.
[14] S.S. Qutab, S.N. Razzaq, I.U. Khan, et al., Simultaneous determination of atorvastatin calcium and ezetimibe in pharmaceutical formulations by liquid chromatography, J. Food Drug Anal. 15 (2) (2007) 139-144.
[15] B.G. Chaudhari, N. Patel, P.B. Shah, et al., Stability-indicating reversed-phase liquid chromatographic method for simultaneous determination of atorvastatin and ezetimibe from their combination drug products, J. AOAC Int. 90 (6) (2007) 1539-1546.
[16] U. Seshachalam, C.B. Kothapally, HPLC analysis for simultaneous determination of atorvastatin and ezetimibe in pharmaceutical formulations, J. Liq. Chromatogr. Related Technol. 31(5) (2008) 714-721.
[17] A. Patel, C. MaCwana, V. Parmar, et al., Simultaneous determination of atorvastatin calcium, ezetimibe, and fenofibrate in a tablet formulation by HPLC, J. AOAC Int. 95 (2) (2012) 419-423.
[18] H.M. Maher, R.M. Youssef, E.M. Hassan, et al., Enhanced spectrophotometric determination of two antihyperlipidemic mixtures containing ezetimibe in pharmaceutical preparations,Drug Test. Anal. 3 (2) (2011) 97-105.
[19] R.G. Baldha, V.B. Patel, M. Bapna, Simultaneous spectrophotometric determination of atorvastatin calcium and ezetimibe in tablet dosage form,Int.J.Chem.Tech.Res.1(2)(2009)233-236.
[20] N.S. Abdelwahab, B.A. EL-Zeiny, S.I. Tohamy, Two spectrophotometric methods for simultaneous determination of some antihyperlipidemic drugs, J. Pharm. Anal. 2 (4) (2012) 279-284.
[21] S. Hillaert, W. Van Den Bossche, Simultaneous determination of hydrochlorothiazide and several angiotensin-II-receptor antagonists by capillary electrophoresis, J. Pharm. Biomed. Anal. 31 (2) (2003)329-339.
[22] B.H. Mehta, S.B. Morge, HPTLC-densitometric analysis of candesartan cilexetil and hydrochlorothiazide in tablets,J. Planar. Chromatogr. Mod. TLC 21 (3) (2008) 173-176.
[23] M. Stolarczyk, M. Anna, J. Krzek, Chromatographic and densitometric analysis of hydrochlorothiazide, walsartan, candesartan, and enalapril in selected complex hypotensive drugs, J.Liq. Chromatogr. Related Technol. 31 (13) (2008) 1892-1902.
[24] R.M. Youssef, H.M. Maher, E.M. Hassan, et al., Development and validation of HPTLC and spectrophotometric methods for simultaneous determination of candesartan cilexetil and hydrochlorothiazide in pharmaceutical preparation,Int.J.Appl.Chem.6 (2) (2010) 233-246.
[25] S.S. Qutab, S.N. Razzaq, M. Ashfaq, et al., Simple and sensitive LC-UV method for simultaneous analysis of hydrochlorothiazide and candesartan cilexetil in pharmaceutical formulations, Acta Chromatogr. 19 (2007) 119-129.
[26] K.Balamuralikrishna,B.Syamasundar,Development and validation of high performance liquid chromatographic method for the simultaneous estimation of candesartan cilexetil and hydrochlorothiazide in combined tablet dosage form, Pharma. Chem. 2 (6) (2010) 231-237.
[27] N. Erk, Simultaneous analysis of candesartan cilexetil and hydrochlorothiazide in human plasma and dosage forms using HPLC with a photodiode array detector, J. Liq. Chromatogr.Related Technol. 26 (15) (2003) 2581-2591.
[28] N. Erk, Application of first derivative UV-spectrophotometry and ratio derivative spectrophotometry for the simultaneous determination of candesartan cilexetil and hydrochlorothiazide,Pharmazie 58 (11) (2003) 796-800.
[29] M. Stolarczyk, A. Maslanka, J. Krzek, et al., Application of derivative spectrophotometry for determination of enalapril,hydrochlorothiazide and valsartan in complex pharmaceutical preparations, Acta Pol. Pharm. 65 (3) (2008) 275-281.
[30] J. Patel, J.B. Dave, C.N. Patel, et al., Q-analysis spectrophotometric methods for estimation of candesartan cilexetil and hydrochlorothiazide in tablet dosage form, J. Chem. Pharm.Res. 2 (3) (2010) 10-14.
[31] S.Singh,B.Singh,R.Bahuguna,et al.,Stress degradation studies on ezetimibe and development of a validated stability-indicating HPLC assay, J. Pharm. Biomed. Anal. 41 (3) (2006) 1037-1040.
[32] P. Armitage, G. Berry, Statistical Methods in Medical Research,third ed., Blackwell, Oxford, UK, 1994, pp. 283-285.
[33] ICH, Q2 (R1), Validation of analytical procedures: text and methodology, in: International Conference on Harmonisation,Geneva, November 2005, 〈http://www.ich.org/fileadmin/Public_Web_Site/ICH_Products/Guidelines/Quality/Q2_R1/Step4/Q2_R1__Guideline.pdf〉, (accessed 1 May, 2012).
 Journal of Pharmaceutical Analysis2013年2期
- Journal of Pharmaceutical Analysis的其它文章
- Analysis of spironolactone residues in industrial wastewater and in drug formulations by cathodic stripping voltammetry
- Anodic voltammetric determination of gemifloxacin using screen-printed carbon electrode
- Electrochemical study and application on rutin at chitosan/graphene films modified glassy carbon electrode
- Liquid chromatography tandem mass spectrometry method for the estimation of lamotrigine in human plasma:Application to a pharmacokinetic study
- Determination of cefcapene acid by LC-MS and their application to a pharmacokinetic study in healthy Chinese volunteers
- Establishment of inherent stability of pramipexole and development of validated stability indicating LC-UV and LC-MS method
