
Liquid chromatography tandem mass spectrometry method for the estimation of lamotrigine in human plasma:Application to a pharmacokinetic study
2013-12-23 06:15:16SantoshGhatolVatsalVithlaniSanjayGuruleArshadKhurooTausifMonifPankajPartani
Santosh Ghatol, Vatsal Vithlani, Sanjay Gurule, Arshad Khuroo, Tausif Monif,Pankaj Partani
Department of Clinical Pharmacology and Pharmacokinetics, Ranbaxy Research Laboratories, Plot: GP-V, Sec-18, HSIIDC,Gurgaon 122015, Haryana, India
1. Introduction
Lamotrigine[3,5-diamino-6-(2,3-dichlorophenyl)-1,2,4-triazine;(Fig.1)], a phenyl-traizine derivative, an effective antiepileptic agent, has been used widely in the treatment of epilepsy and bipolar disorders [1]. It exhibits excellent oral bioavailability with first-order linear pharmacokinetics and has a mean plasma half-life of approximately 24 h. Lamotrigine is a lipophilic weak base with plasma protein binding of ~55%. It gets extensively metabolized in human liver via hepatic glucuronidation by uridine 5′-diphosphate-glucuronosyl transferase (UGT1A4) [2].

Fig.1 Chemical structure of lamotrigine and lamotrigine-13C3, d3.
Over the years, a variety of analytical methods were reported for the determination of lamotrigine in biological samples. These include radioimmunoassay [3], high performance liquid chromatography (HPLC) methods with ultraviolet detection [4-21], capillary electrophoresis [22], gas chromatography-mass spectrometry (GC-MS) [23], electrospray ionization-mass spectrometry (ESI-MS) [24,25]. These conventional quantitative HPLC methods with classical ultraviolet or capillary electrophoresis detection provide insufficient sensitivity,longer chromatographic run time and a labor intensive work-up procedure which nowadays are less favored in industries to support clinical studies.
Among the currently available bio-analytical techniques,liquid chromatography coupled with tandem mass spectrometry (LC-MS/MS) has been emerged as the preeminent analytical tool for quantification of small molecular weight drugs in biological matrix. Very few methods employing LCMS/MS have been published for the determination of lamotrigine in human plasma [26-28]. Shah et al. [27] reported a methodology that has limit of quantification of 25 ng/mL achieved while utilizing multiplexing technique.More recently,Hotha et al. [28] reported a method for quantification of lamotrigine in human plasma using liquid-liquid extraction technique.
The main objective of this study was to develop a fast,sensitive and robust method to quantify lamotrigine using isotopically labeled internal standard (ISTD), in order to extend its application to assess the bioequivalence of two lamotrigine 50 mg tablet formulations in healthy volunteers.
2. Experimental
2.1. Chemicals and materials
Working standards of lamotrigine (99.0%) and lamotrigine-13C3, d3 (99.2%) for use as an internal standard (ISTD)were procured from Vivan Life Sciences, India and TLC Pharma Chem., Canada, respectively. Ammonium formate of LC-MS grade was obtained from FLUKA (Sigma-Aldrich,Steinheim, USA). Acetonitrile and methanol of HPLC grade were obtained from Spectrochem (Mumbai, India) and Fisher Scientific (Mumbai, India), respectively. Cleanert PEP-H,30 mg/mL, solid phase cartridges were obtained from Agela technologies (Tianjin, China). All aqueous solutions and buffers were prepared using water that was purified using Milli-Q®Gradient A10®(Millipore, Moscheim Cedex,France). Different individual lots of K3EDTA (ethylene diamine tetra acetic acid tri potassium salt) human plasma,which were used to prepare calibration standards and quality control (QC) samples, were obtained from Yash Laboratories(Mumbai, India).
2.2. Preparation of stock solution, standard and quality control samples
Stock solutions of lamotrigine and lamotrigine-13C3, d3(1000 μg/mL) were prepared in methanol, stored in refrigerator between 1 and 10°C, and protected from light until use.Working solutions of lamotrigine (ranging from 0.25 to 61.32 μg/mL) were prepared by serial dilution of the stock solution in methanol-water (50:50, v/v). A 200 μL aliquot of each working solution was added to pooled blank K3EDTA plasma to yield spiked calibration standards at eight different concentrations ranging from 5.02 to 1226.47 ng/mL. Simultaneously quality control (QC) samples for determination of accuracy and precision in K3EDTA plasma at four concentrations (5.03, 12.52, 391.28 and 978.20 ng/mL) were prepared in the similar manner as that of calibration standards. Calibration curve plasma standards and quality control samples were stored at around -20°C until assayed or used for validating the analytical method. The amount of stock solution in all spiked samples was kept at 2% of the total sample volume to minimize any systemic errors between the real samples and spiked samples.
The ISTD working solution (500.00 ng/mL) for routine use was prepared by diluting the lamotrigine-13C3, d3 stock solution in methanol-water (50:50, v/v).
2.3. Sample preparation
Plasma samples stored at around -20°C were thawed on the day of extraction at room temperature followed by vortexing to ensure homogeneity. An eppendorf pipette was used to aliquot 0.300 mL of spiked plasma samples into polypropylene tubes(13 mm×50 mm).To each tube then added 0.050 mL of internal standard working solution (500.00 ng/mL, lamotrigine-13C3, d3 in methanol-water, 50:50, v/v) with the use of multistepper and vortexed approximately for 30 s. To these tubes 0.400 mL of water was then added, and vortexed again approximately for 30 s. The total sample was then loaded using an eppendorf pipette on SPE cartridge and centrifuged at 1500 rpm for 1 min. Before that the Cleanert PEP-H cartridge was conditioned with 0.500 mL of methanol followed by 0.500 mL of water.After loading of the samples,the cartridge was washed once with 1 mL of 20%methanol-water mixture followed by 1 mL of water. Finally, the analyte and ISTD were eluted with 1 mL of methanol. The extracted samples were evaporated to dryness using a Zymark Turbo-Vap LV evaporator (Caliper, Hopkinton, MA, USA) and reconstituted with 0.400 mL of the mobile phase. Using an eppendorf pipette the reconstituted samples were transferred to autosampler vials. 10 μL was injected into the LC-MS/MS system for analysis.
2.4. LC/ESI-MS/MS instrumentation and analytical conditions
The liquid chromatography separation was performed using a Shimadzu scientific instruments(Shimadzu Corporation;Kyoto,Japan) consisted of two LC-20AD delivery pumps, an on-line DGU-20A3 prominence solvent degasser,an SIL-HTc Shimadzu autosampler and a CBM-20A prominence column oven. Liquid chromatographic separations were achieved using Chromolith®SpeedROD; RP-18e column (50-4.6 mm) (Merck Scientific,USA).An injection volume of 10 μL was used for each analysis.Mobile phase consisted of acetonitrile: 5±0.1 mM ammonium formate solution (90:10, v/v). The flow rate of the mobile phase was set at 0.500 mL/min. The column and autosampler were maintained at 35±1°C and 10±1°C, respectively.
Samples were analyzed with an API-3000 triple quadrupole mass spectrometer(MDS Sciex®;Toronto,Canada)equipped with an electrospray ionization source operating in positive ion mode. Nitrogen was used as the nebulizer, auxillary,collision and curtain gas. Analytes were detected by tandem mass spectrometry using multiple reaction monitoring(MRM)of precursor-product ion transitions with 200 ms dwell time,at m/z 256.1/211.3 for lamotrigine and m/z 262.1/217.2 for lamotrigine-13C3, d3.
The instrument response was optimized by syringe pump infusion of lamotrigine and lamotrigine-13C3,d3 in the mobile phase by constant flow (10 μL/min) into the stream of the mobile phase eluting from the LC column. The main working source/gas parameters of the mass spectrometer were optimized and maintained as follow: collision activated dissociation(CAD)gas,10;curtain gas,8;nebulizer gas,12;turbo ion spray (IS) voltage, 2000 V; source temperature, 450°C. The compound parameters like, declustering potential (DP),entrance potential (EP), focusing potential (FP), collision energy (CE), and collision cell exit potential (CXP) were optimized and set at 48, 10, 150, 37 and 14 V respectively,for lamotrigine and lamotrigine-13C3, d3.
Calibration curves were constructed by calculating the analyte to ISTD peak area ratio (y) against analyte concentrations (x). Data acquisition and processing were performed using Analyst version 1.4.1 software (MDS Sciex®; Toronto,Canada).
2.5. Method validation
A full method validation was performed according to guidelines set by the USFDA [29]. The validation of this procedure was performed in order to evaluate the method in terms of selectivity, sensitivity, linearity of response, accuracy, precision, recovery, matrix effect, and stability of analyte during both short-term sample processing and long-term storage.
2.5.1. Selectivity
The selectivity of the method towards endogenous plasma matrix components and concomitant medications was assessed in eight lots of blank human plasma (six K3EDTA, one lipemic and one haemolysed). They were processed and analyzed using the proposed extraction protocol and the set chromatographic conditions for lamotrigine at the lower limit of quantitation (LLOQ) level.
2.5.2. Linearity and LLOQ
The linearity of the method was determined by analysis of standard plots associated with an eight point standard calibration curve. Calibration curves from accepted three precision and accuracy batches were used to establish linearity.Peak area ratios of analyte/ISTD obtained from MRM were utilized for the construction of calibration curves; using weighted (1/x2) linear least squares regression of the plasma concentrations and the measured peak area ratios. Backcalculations were made from these curves to determine the concentration of lamotrigine in each calibration standards and the resulting calculated parameters were used to determine concentrations of analyte in quality control or unknown samples. The correlation coefficient r>0.98 was desirable for all the calibration curves. The lowest standard on the calibration curve was to be accepted as the LLOQ, if the analyte response was at least five times more than that of drug free(blank) extracted plasma. In addition, the analyte peak of LLOQ sample should be identifiable, discrete, and reproducible with accuracy within ±20.0% and a precision ≤20.0%.The deviation of standards other than LLOQ from the nominal concentration should not be more than ±15.0%.
2.5.3. Accuracy and precision
Intra-and inter-day accuracies were expressed as a percentage of deviation from the respective nominal value and the precision of the assay was measured by the percent coefficient of variation(%CV)at concentrations.Intra-day precision and accuracy were assessed by analyzing six replicates of the quality control samples at four levels during a single analytical run. The inter-day precision and accuracy were assessed by analyzing 18 replicates of the quality control samples at each level through three precision and accuracy batches runs on 2 consecutive validation days. The deviation at each concentration level from the nominal concentration was expected to be within ±15.0% except lower limit of quality control(LLOQC), for which it should not be more than 20.0%.Similarly, the mean accuracy should not deviate by ±15.0%except for the LLOQC where it can be ±20.0% of the nominal concentration.
2.5.4. Recovery
The relative extraction recoveries for the analyte and ISTD at low,middle and high QC concentration levels were determined by measuring the mean peak area response of six replicates of extracted quality control samples against the mean peak area response of six replicates each of three neat solutions containing analyte and a neat solution containing ISTD at concentrations equivalent to those obtained in the final extracted concentration for the analyte and ISTD in the quality control samples.
2.5.5. Matrix effect and matrix factor
Matrix effect was assayed at two concentration levels(LLOQC and HQC). Six different blank plasma lots (4 normal, 1 haemolysed, 1 lipemic), free of any significant interference at the RT of analyte and ISTD, were selected and spiked with the working solutions of LLOQC and HQC.Spiked samples from each plasma lot were processed in duplicate and quantitated against freshly spiked calibration curve. The matrix effect is validated to be nullified if the accuracy and precision do not deviate by ±15.0% for HQC and ±20.0% for LLOQC of the nominal concentration.
The matrix factor is defined as the peak area response in the presence of matrix ions versus the peak area response in the absence of matrix ions. Since this method involved terminal drying step, biological matrix samples were prepared by reconstituting the post-extracted blank plasma samples with three neat solutions containing lamotrigine and lamotrigine-13C3, d3 at concentration representing the final extracted concentration for the analyte (low, medium and high quality control concentration) and ISTD. The control samples were the same neat solutions prepared in the mobile phase. Matrix factor was evaluated using six different blank plasma lots (4 normal, 1 haemolysed, 1 lipemic) and determined by measuring the respective mean peak area response and mean analyte/ISTD peak area ratio (ISTD normalized MF) of biological matrix sample against the mean peak area response and mean analyte/ISTD peak area ratio of neat solutions.
2.5.6. Stability
The absolute stability of lamotrigine in plasma was assessed by analyzing four replicates of QC samples at low and high concentrations of 12.52 and 978.20 ng/mL during the sample storage and processing procedures. Bench-top stability was assessed in ice cold water bath for ~7 h, which exceeds the residence time of the sample processing procedures. The freeze-thaw stability was evaluated after undergoing three freeze (at around -20°C)-thaw (ice cold water bath) cycles.Long-term stability was assessed after storage of the test samples at around -20°C for 48 days. The autosampler storage stability was determined by storing the reconstituted QC samples for ~57 h under autosampler condition (maintained at 10°C) before being analyzed. All stability exercises were performed against freshly spiked calibration standards processed along with freshly spiked four replicates of QC samples at low and high concentrations which act as comparison samples for determining the percentage absolute stability of lamotrigine during the sample storage and processing procedures. The analyte was considered stable in plasma at each concentration if the mean calculated concentration of stability samples does not deviate by ±15.0% of the mean calculated concentration of comparison quality control samples.
The working solutions and stock solutions of lamotrigine and ISTD were also evaluated for their stability at room temperature for 9 h and at refrigerator temperature(between 1 and 10°C) for 23 days, respectively.
2.6. Method application
An open label, balanced, randomized, two-treatment, twoperiod, two-sequence, single-dose, crossover design was used for the assessment of pharmacokinetics and bioequivalence.Thirty-two healthy adult male volunteers who gave written informed consent took part in this study. The study was approved by Ethics Committee of Institutional Review Board at Majeedia Hospital (New Delhi, India). After an overnight fast of at least 10 h,all subjects were given a single oral dose of lamotrigine extended release 50 mg tablet of Ranbaxy and Lamictal®XRTMextended release tablets 50 mg (containing lamotrigine 50 mg)of GlaxoSmithKline during each period of the study. Blood samples were collected before and at 2, 4, 6,8, 10, 12, 14, 16, 18, 20, 22, 24, 26, 28, 30, 33, 36, 48, 72, 96,120, 144 and 168 h post-dose in each period. The plasma was immediately separated by centrifugation and stored frozen at around -20°C until analysis.
3. Results and discussion
3.1. Optimization of the mass spectrometric condition
Lamotrigine has amino functionality in its chemical structure;certainly the mass spectrometric detection in positive ion mode was evaluated using both electrospray ionization (ESI) as well as atmospheric pressure chemical ionization (APCI). The signal intensity obtained in the positive mode with ESI interface is much higher than that of APCI. The Q1 ESI spectra were dominated by the protonated quasimolecular ion[M+H]+at m/z 256.1 for lamotrigine and 262.1 for lamotrigine-13C3, d3 with no other additive and fragments ions were present (data not shown). The Q1 mass spectra of lamotrigine shows the isotopic mass distribution pattern upto [M+5H]+due to the presence of two chlorine atoms. This might lead to an interference with the transition of isotopic labeled internal standard with labeling less than four or equivalent; in view of that we have selected lamotrigine-13C, d3 as an internal standard. Fig.2 shows the product ion spectra of lamotrigine and lamotrigine-13C3, d3. The MS/MS parameters, including the declustering potential (DP), focusing potential (FP),collision cell exit potential (CXP), gases (NEB, CAD) and collision energy (CE), were optimized to identify the most stable and intense product ion for the analyte and ISTD. The product ions at m/z 211.3 for lamotrigine and at m/z 217.2 for lamotrigine-13C3,d3,corresponding to the cleavage of triazine moiety of the molecule, were observed with higher abundance and greater stability.
During the method development different additives of varying strength were added to the mobile phase, so as to obtain higher abundance of protonated parent ion of analyte and ISTD. Use of ammonium formate solution of strength 5±0.1 mM in the mobile phase enhances the occurrence of[M+H]+and eventually results in an improvement in area response for both the analyte and ISTD.
3.2. Optimization of chromatographic condition

Fig.2 The product ion spectra of lamotrigine (A) and lamotrigine-13C3, d3 (B).
A number of reversed-phase columns, such as Ascentis-C18,Hypersil-C18, Zorbax SB-CN, Chromolith®SpeedROD and Phenomenex Luna, were tested to obtain optimal selectivity,efficiency, suitable retention time and symmetric peak shape for the analyte and ISTD. In industrial research cutting of the separation time is always in focus in order to attain the high throughput. The Chromolith®SpeedROD column(50-4.6 mm i.d.) was selected since it provided good peak shape and better sensitivity with greater signal to noise(S/N)ratio.The chromolith columns are composed of porous silica rods with~2 μm micropores, which facilitates fast mass transfers and results in minimizing the total analytical run time to <3.0 min.The mobile phase consisting of 5±0.1 mM ammonium formate and acetonitrile gave higher signal intensity. Acetonitrile was chosen as organic phase over methanol as it revealed a higher mass spectrometric response and with minimal background noise.Change in percentage of acetonitrile in the mobile phase was found to have profound influence on retention time and peak shape.Thus a mobile phase consisting of acetonitrile:5±0.1 mM ammonium formate solution (90:10, v/v) was used in the experiment. Under these conditions, lamotrigine and lamotrigine-13C3, d3 elute at retention time of approximately 1.50 min as shown in Fig.3.
3.3. Sample preparation optimization
Sample clean-up was focused on solid phase extraction since this technique mostly provides the cleanest sample compared to protein precipitation or liquid-liquid extraction. In a previous study Waters Oasis HLB cartridges were successfully used to extract analyte from human plasma with absolute recovery of more than 95% [27]. During initial stages of the method development, three reversed-phase type solid phase polymeric supports (Waters Oasis HLB; Agilents Bond Elut Plexa; and Agelas Cleanert PEP-H) were tested for the extraction of analyte and ISTD from human plasma. All the three polymeric supports nearly produced comparable results.In this work we have utilized Cleanert PEP-H cartridges for isolation of analyte and ISTD from the plasma samples with minor modification from the previously reported method.Furthermore, the use of a stable isotopically labeled internal standard compensated for any possible matrix effect and improved robustness of this method over the previously reported work.The extraction procedure described here offers a rapid way to isolate analyte as well as ISTD from plasma matrix.
3.4. Method validation
3.4.1. Selectivity
Selectivity is the ability of an analytical method to differentiate and quantify the analyte in the presence of other components in the sample. Selectivity was ascertained in different batches of human plasma by comparing the chromatograms of blank plasma samples with the corresponding spiked LLOQ plasma samples. Fig.3 shows the typical chromatograms of a double blank, blank spiked with ISTD, a spiked plasma sample with lamotrigine at LLOQ and upper limit of quantitation(ULOQ)level. As can be seen no interference peak from endogenous compounds was observed at the retention time of the analyte and ISTD.
3.4.2. Linearity and sensitivity
The method was validated using the above criteria and found that plasma calibration standard curve containing lamotrigine was linear over the concentration range of 5.02-1226.47 ng/mL.The intercept with the y-axis was not significantly different from zero.A typical regression equation was y=0.0359x+0.0331 with a correlation coefficient(r)of 0.9987,where y represents the peak area ratio of lamotrigine to that of ISTD and x represents the plasma concentration of lamotrigine.
Although the method was only validated to 5.02 ng/mL, to match clinical sensitivity requirements, at which the obtained values were within ±6.0% of the spiked values and the intraand inter-day coefficients of variation were <3.0% (Table 1).The lower limit of detection (based on a signal:noise ratio,S/N=3) was less than 0.1 ng/mL. Preliminary evaluations showed that an LLOQ(S/N=10)of less than 0.2 ng/mL could easily be achieved. Nevertheless, LLOQ of 5.02 ng/mL was chosen in order to estimate lamotrigine in plasma samples until 168 h.

Fig.3 Representative chromatograms in human plasma:(A)double plasma blank;(B)plasma blank with ISTD;(C)LLOQ,5.02 ng/mL;and (D) ULOQ 1226.47 ng/mL. Lamotrigine (left panels, A-D) and its ISTD-lamotrigine-13C3, d3 (right panels, A-D).

Table 1 Accuracy and precision of the method for the estimation of lamotrigine in human plasma.
3.4.3. Precision and accuracy
Precision and accuracy of the method were determined by analyzing quality control samples at four concentrations within the calibration curve range to validate reproducibility.Table 1 summarizes the inter- and intra-day precision and accuracy values for quality control samples. The CV values of both intra- and inter-day results were below 1.6% and 2.4%,respectively. Intra- and inter-day accuracies were less than±6.0% at all analyte concentrations. These results above indicate that the present method has good accuracy, precision and reproducibility.
3.4.4. Recovery
At three QC concentration levels 12.52, 391.28 and 978.20 ng/mL the relative extraction recovery (mean±SD) for lamotrigine was 73.2±4.5%,78.0±9.5% and 80.2±1.0%, respectively.The mean recovery for the internal standard lamotrigine-13C3, d3 at the concentration employed was 65.1±7.7%.The result indicates that the extraction efficiency for lamotrigine using solid phase extraction was satisfactory,consistent and was not concentration dependent.
3.4.5. Matrix effect and matrix factor
Matrix effect, ion suppression or enhancement, due to the coeluting endogenous component of sample matrix along with the analyte or internal standard may affect the chromatography and accuracy of analytical method when developing LC-MS/MS assay. So, to ensure the selectivity of method, matrix effect as well as matrix factor on the presented method was evaluated following the procedures described above.Results of the exercise are summarized in Table 2.Results obtained therein indicate that no additional variations in plasma concentration due to the use of different plasma lots were observed. Hence the concentration of the analyte obtained from clinical study samples should therefore be considered as reliable.
The matrix ionization suppression or enhancement of the analyte and ISTD was assessed by measuring the matrix factor at three QC concentration levels. The mean absolute matrix factor at the low, medium and high QC concentrations from six lots of plasma samples was 0.82, 0.86, and 0.85, respectively (Table 2). The CVs of absolute matrix factor and ISTD normalized matrix factor from six lots of plasma samples were<2.4%. These results showed that ion suppression or enhancement from the plasma matrix was negligible under the current conditions.

Table 2 Matrix effect and matrix factor for lamotrigine in six different lots of human plasma.
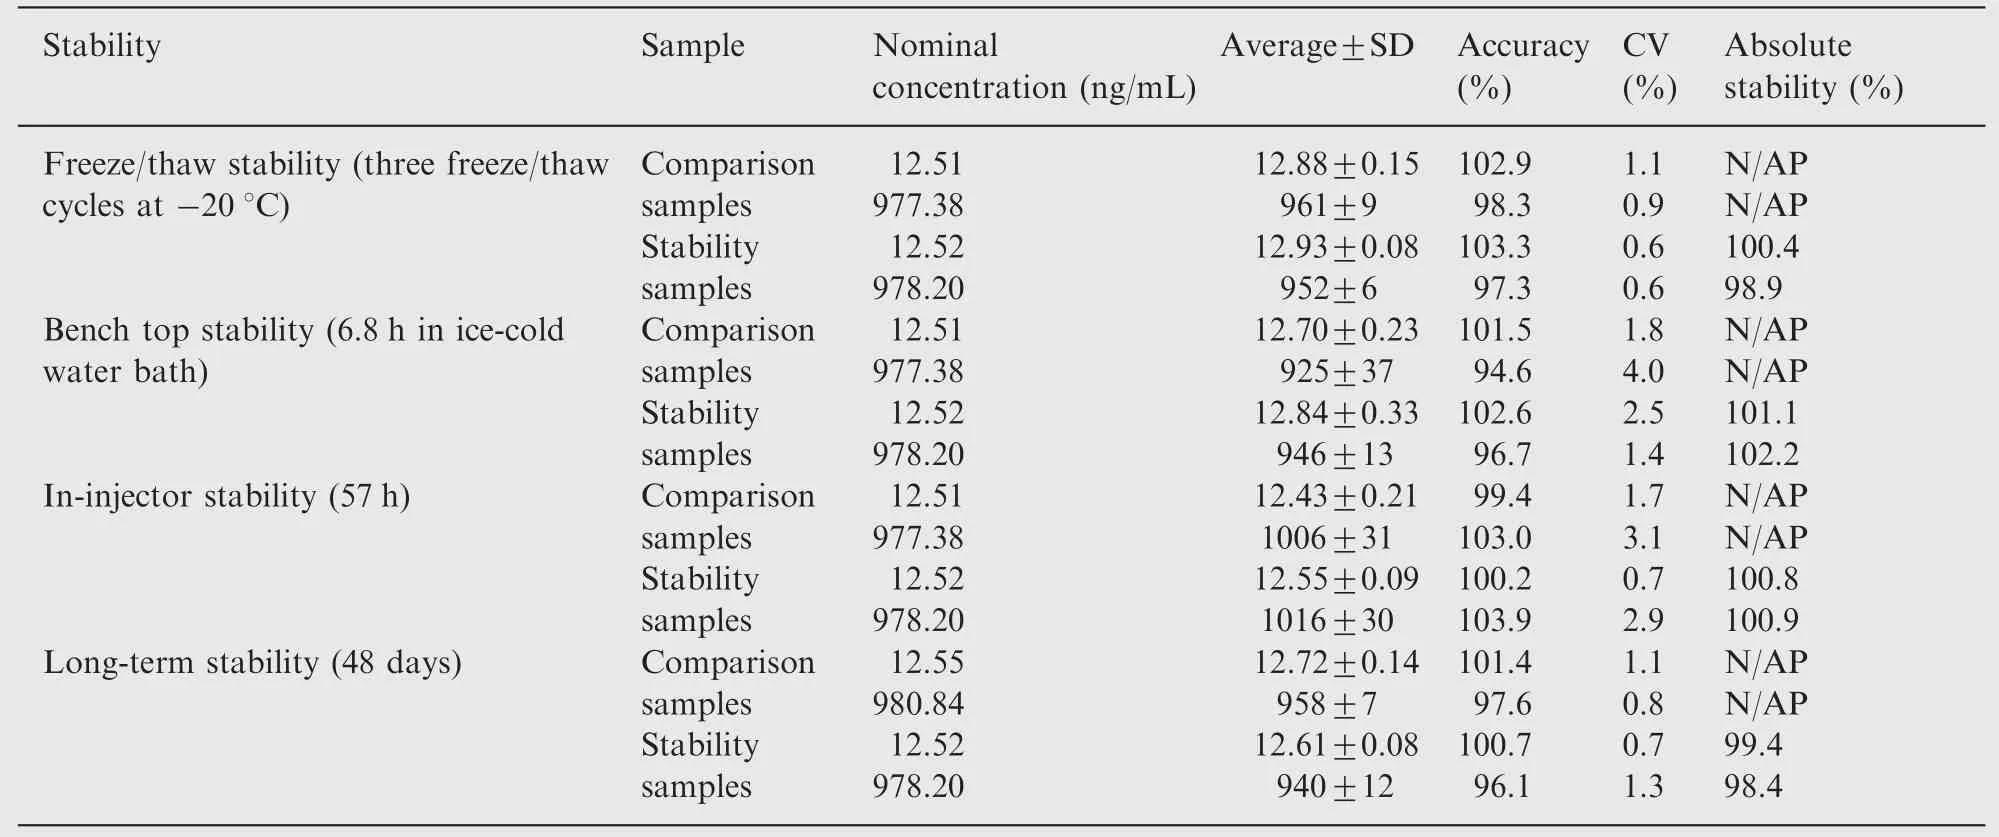
Table 3 Stability data for lamotrigine in human plasma under various conditions (n=4).
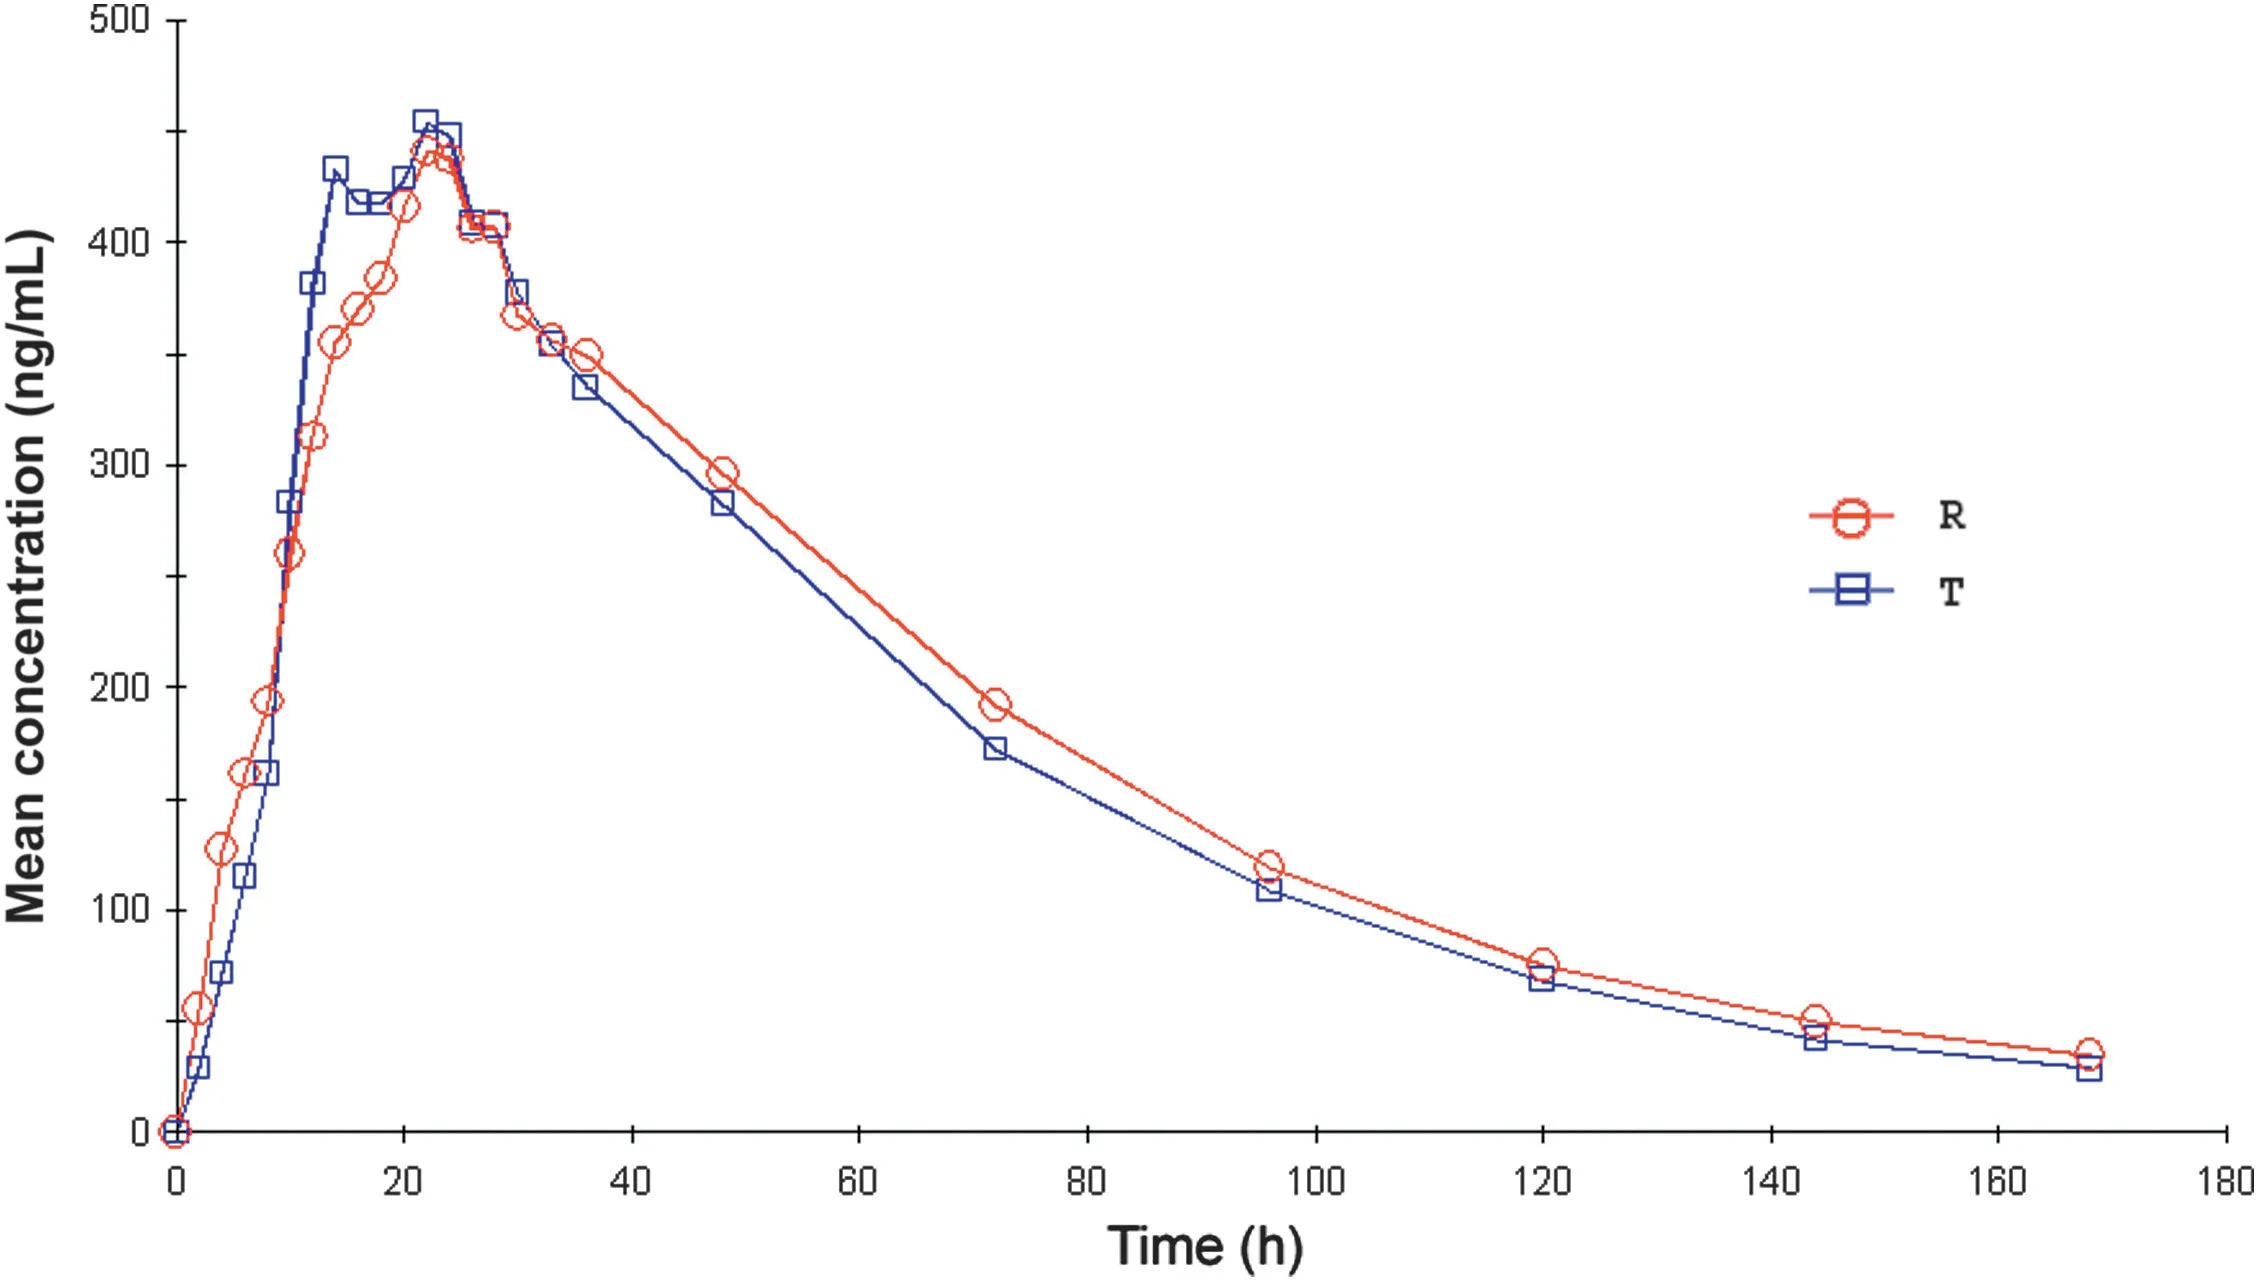
Fig.4 The linear mean plasma concentration versus time profile of lamotrigine in plasma.R stands for reference formulation, T stands for test formulation.

Table 4 Pharmacokinetic parameters (mean±SD) of lamotrigine, after the administration of an oral dose of 50 mg test or reference formulations to healthy Indian male volunteers.
3.4.6. Stability studies
The absolute stability of lamotrigine was investigated at two concentration levels of QC samples (low and high) to cover expected conditions during analysis,storage and processing of all samples, which include the stability data from various stability exercise like in-injector, bench-top, freeze/thaw and long-term stability tests. The stability results summarized in Table 3 showed that lamotrigine spiked into human plasma was stable for at least 6.8 h in ice-cold water bath, for at least 57 h in the mobile phase at 10°C under autosampler storage condition, for 48 days at around -20°C and during three freeze-thaw cycles. The stock solutions of lamotrigine and ISTD were found stable at refrigerator temperature(between 1 and 10°C) for 23 days and the working solutions of lamotrigine and ISTD were found stable for about 9 h at room temperature.
3.4.7. Method application
This developed method was applied to a pharmacokinetic study of lamotrigine in 32 healthy adult male volunteers following oral administration of 50 mg of lamotrigine tablet.The mean concentration-time profile of lamotrigine in these volunteers is shown in Fig.4 and the mean estimated pharmacokinetic parameters derived from the plasma concentration profiles are summarized in Table 4.
4. Conclusions
A rapid, sensitive and selective LC-MS/MS method for the quantitation of lamotrigine in human plasma was developed and validated.The assay was linear from 5.02 to 1226.47 ng/mL.The lowest standard generated typical signal to noise ratios around 200.Solid phase extraction methodology was adopted in plasma sample preparation, which provides consistent extraction recovery with minimal endogenous interference and matrix effect.Lamotrigine was found stable during storage, processing, and analysis in human plasma samples. The results indicate the method to be sensitive,selective,accurate and reproducible.The applicability of the method was demonstrated in a bioequivalence study of lamotrigine in healthy male volunteers.
[1] A.A. Miller, P. Wheatley, D.A. Sawyer, et al., Pharmacological studies on lamotrigine, a novel potential antiepileptic drug:I. Anticonvulsant profile in mice and rats, Epilepsia 27 (1986)483-489.
[2] A.F.Cohen,G.S.Land,D.D.Breimer,et al.,Lamotrigine,a new anticonvulsant: pharmacokinetics in normal humans, Clin. Pharmacol. Ther. 42 (1987) 535-541.
[3] R.A.Biddlecombe,K.L.Dean,C.D.Smith,et al.,Validation of a radioimmunoassay for the determination of human plasma concentrations of lamotrigine, J. Pharm. Biomed. Anal. 8(1990) 691-694.
[4] M.W. Sinz, R.P. Remmel, Analysis of lamotrigine and lamotrigine 2-N-glucuronide in guinea pig blood and urine by reservedphase ion-pairing liquid chromatography, J. Chromatogr. 571(1991) 217-230.
[5] S. Yamashita, K. Furuno, H. Kawasaki, et al., Simple and rapid analysis of lamotrigine, a novel antiepileptic, in human serum by high-performance liquid chromatography using a solid-phase extraction technique, J. Chromatogr. B 670 (1995) 354-357.
[6] B.C. Sallustio, R.G. Morris, High-performance liquid chromatography quantitation of plasma lamotrigine concentrations: application measuring trough concentrations in patients with epilepsy,Ther. Drug Monit. 19 (1997) 688-693.
[7] G.L. Lensmeyer, B.E. Gidal, D.A. Wiebe, Optimized highperformance liquid chromatographic method for determination of lamotrigine in serum with concomitant determination of phenytoin, carbamazepine, and carbamazepine epoxide, Ther.Drug Monit. 19 (1997) 292-300.
[8] A.Bartoli,R.Marchiselli,G.Gatti,A rapid and specific assay for the determination of lamotrigine in human plasma by normalphase HPLC, Ther. Drug Monit. 19 (1997) 100-107.
[9] D. Londero, P.L. Greco, New micromethod for the determination of lamotrigine in human plasma by high-performance liquid chromatography, J. Chromatogr. B 691 (1997) 139-144.
[10] K.M. Matar, P.J. Nicholls, S.A. Bawazir, et al., A rapid liquid chromatographic method for the determination of lamotrigine in plasma, J. Pharm. Biomed. Anal. 17 (1998) 525-531.
[11] S. Ren, M.L. Scheuer, W. Zheng, Determination of lamotrigine in biologic materials by a simple and rapid liquid chromatographic method, Ther. Drug Monit. 20 (1998) 209-214.
[12] P. Angelis-Stoforidisa, D.J. Morgan, T.J. O'Briena, et al., Determination of lamotrigine in human plasma by high-performance liquid chromatography, J. Chromatogr. B 727 (1999) 113-118.
[13] E. Vidal, C. Pascual, L. Pou, Determination of lamotrigine in human serum by liquid chromatography, J. Chromatogr. B 736(1999) 295-298.
[14] M. Torra, M. Rodamilans, S. Arroyo, et al., Optimized procedure for lamotrigine analysis in serum by high-performance liquid chromatography without interferences from other frequently coadministered anticonvulsants, Ther. Drug Monit. 22 (2000)621-625.
[15] N.R. Barbosa, A.F. Midio, Validated high-performance liquid chromatographic method for the determination of lamotrigine in human plasma, J. Chromatogr. B 741 (2000) 289-293.
[16] M.M.Castel-Brancoa,A.M.Almeidaa,A.C.Falca,et al.,Lamotrigine analysis in blood and brain by high-performance liquid chromatography, J. Chromatogr. B 755 (2001) 119-127.
[17] D. Croci, A. Salmaggi, U. de Grazia, et al., New highperformance liquid chromatographic method for plasma/serum analysis of lamotrigine, Ther. Drug Monit. 23 (2001) 665-668.
[18] M. Contin, M. Balboni, E. Callegati, et al., Simultaneous liquid chromatographic determination of lamotrigine, oxcarbazepine monohydroxy derivative and felbamate in plasma of patients with epilepsy, J. Chromatogr. B 828 (2005) 113-117.
[19] K.M. Patil, S.L. Bodhankar, Simultaneous determination of lamotrigine, phenobarbitone, carbamazepine and phenytoin in human serum by high-performance liquid chromatography,J. Pharm. Biomed. Anal. 39 (2005) 181-186.
[20] T.A. Vermeij, P.M. Edelbroek, Robust isocratic high performance liquid chromatographic method for simultaneous determination of seven antiepileptic drugs including lamotrigine,oxcarbazepine and zonisamide in serum after solid-phase extraction, J. Chromatogr. B 857 (2007) 40-46.
[21] C. Greiner, E. Haen, Development of a simple column-switching high-performance liquid chromatography (HPLC) method for rapid and simultaneous routine serum monitoring of lamotrigine,oxcarbazepine and 10-monohydroxycarbazepine (MHD),J. Chromatogr. B 854 (2007) 338-344.
[22] R. Theurillat, M. Kuhn, W.J. Thormann, Therapeutic drug monitoring of lamotrigine using capillary electrophoresis: evaluation of assay performance and quality assurance over a 4-year period in the routine arena, J. Chromatogr. A 979 (2002) 353-368.
[23] A. Dasgupta, A.P. Hart, Lamotrigine analysis in plasma by gas chromatography-mass spectrometry after conversion to a tert.-butyldimethylsilyl derivative, J. Chromatogr. B 693 (1997) 101-107.
[24] J.Zheng,M.W.Jann,Y.Y.Hon,et al.,Development of capillary zone electrophoresis-electrospray ionization-mass spectrometry for the determination of lamotrigine in human plasma, Electrophoresis 25 (2004) 2033-2043.
[25] O. Beck, I. Ohman, H.K. Nordgren, Determination of lamotrigine and its metabolites in human plasma by liquid chromatographymass spectrometry, Ther. Drug Monit. 28 (2006) 603-607.
[26] W.Lee,J.H.Kim,H.S.Kim,et al.,Determination of lamotrigine in human serum by high-performance liquid chromatographytandem mass spectrometry, Neurol. Sci. 31 (2010) 717-720.
[27] H.J. Shah, G. Subbaiah, D.M. Patel, et al., Rapid quantification of lamotrigine in human plasma by two LC systems connected with tandem MS, J. Chromatogr. Sci. 48 (2010) 375-381.
[28] K.K.Hotha,S.S.Kumar,V.Bharathi,et al.,Rapid and sensitive LC-MS/MS method for quantification of lamotrigine in human plasma: application to a human pharmacokinetic study, Biomed.Chromatogr. 26 (2012) 491-496.
[29] Guidance for Industry: Bioanalytical Method Validation, US Department of Health and Human Services, Food and Drug Administration, Center for Drug Evaluation and Research, Rockville, MD, 2001, Available from: 〈http://www.fda.gov/CVM〉.
 Journal of Pharmaceutical Analysis2013年2期
- Journal of Pharmaceutical Analysis的其它文章
- Analysis of spironolactone residues in industrial wastewater and in drug formulations by cathodic stripping voltammetry
- Anodic voltammetric determination of gemifloxacin using screen-printed carbon electrode
- Electrochemical study and application on rutin at chitosan/graphene films modified glassy carbon electrode
- New simple spectrophotometric method for determination of the binary mixtures (atorvastatin calcium and ezetimibe;candesartan cilexetil and hydrochlorothiazide) in tablets
- Determination of cefcapene acid by LC-MS and their application to a pharmacokinetic study in healthy Chinese volunteers
- Establishment of inherent stability of pramipexole and development of validated stability indicating LC-UV and LC-MS method