
Anodic voltammetric determination of gemifloxacin using screen-printed carbon electrode
2013-12-23 06:15:24AdElgwdRdiAmirKhfgyAmirElshokyHtemElmezyen
Ad-Elgwd Rdi, Amir Khfgy, Amir El-shoky, Htem El-mezyen
aDepartment of Chemistry, Faculty of Science, Dumyat University; 34517 Dumyat, Egypt
bDepartment of Chemistry, Faculty of Science, Helwan University, 11795 Helwan, Egypt
1. Introduction
Fluoroquinolones have emerged as one of the most important classes of antibiotics in the past decade [1-3]. Gemifloxacin(GFX), 7-[(4Z)-3-(aminomethyl)4-methoxyimino-pyrrolidin-1-yl]-1-cyclopropyl-6-fluoro4-oxo-1,8-naphthyridine-3-carboxylic acid methanesulfonate (Scheme 1), is a new fluoroquinolone antibacterial compound with enhanced affinity for bacterial topoisomerase IV, with a broad spectrum of activity against Gram-positive and Gram-negative bacteria, and has been developed to treat pneumonia or bronchitis[4-6].GFX is being approved by the US Food and Drug Administration for treatment of the upper respiratory tract infections [7].
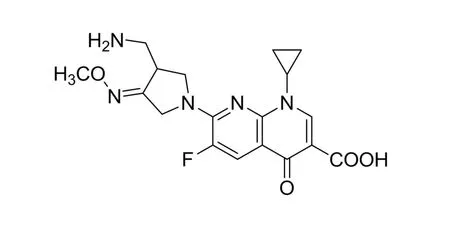
Scheme 1 Chemical structure of gemifloxacin.
Literature revealed that few analytical methods have been reported for the estimation of GFX. They include highperformance liquid chromatography-tandem mass spectrometry (LC-MS-MS) [8], microchip electrophoresis [9,10], chiral high-performance liquid chromatography [11-13] and chiral counter-current chromatography [14]. The spectrophotometric methods have been reported for GFX determination [15-23]. A fluorometric method[24]for determination of GFX in plasma has been described.The determination of GFX is not yet described in any pharmacopoeias.Therefore,a simple and accurate method is required for its determination in pharmaceutical formulations.
The electroanalytical techniques have proven to be useful for selective and sensitive quantitation of many drugs owing to their excellent specificity, sensitivity, speed of analysis and relative low cost, and, therefore, have been used to determine the active pharmaceutical ingredients in bulk, dosage forms,and biological matrices [25-27]. The electrochemical behavior of the drugs can also give insights into their metabolic pathway or their in vivo redox processes or pharmacological activities [28]. Voltammetric determination based on the electrochemical reduction of GFX in solubilized systems at multi-walled carbon nanotubes modified screen-printed carbon electrode has been reported [29].
The development of screen-printing techniques for fabrication of versatile, inexpensive and disposable electrodes has been a boon to electroanalytical chemistry for various applications.Screen-printed electrodes are planar devices, based on different layers of inks printed on a plastic, glass or ceramic substrate.Many ink-type substrates have been used for sensor construction, where the most successful ones have included carbon and the noble metals as Au, Pt, Ag, etc. The main advantage of this kind of electrode system lies in its modest cost, potential portability, simplicity of operation, reliability, and the small instrumental arrangement containing the working electrode,auxiliary and reference electrodes. Therefore, the effective performance of screen-printed electrodes has gained consideration in environmental,biomedical and occupational hygiene monitoring and all the major fields of analytical chemistry [30,31].
In the present study,the voltammetric behavior of GFX on screen-printed carbon electrodes using cyclic and differentialpulse voltammetry was reported. The study also described the optimization, validation and application of screen-printed carbon electrodes for determination of GFX in pharmaceutical tablet formulation.
2. Experimental
2.1. Apparatus
Voltammetric measurements were carried out using CHI610C Electrochemical Analyzer controlled by CHI Version 9.09 software (CH Instruments, USA). A three-electrode configuration was composed of a working screen-printed carbon electrode(3.1 mm diameter),printed from a carbon-based ink;a silver-silver chloride pseudo-reference electrode made from a silver-based ink;and the auxiliary electrode from a carbon ink.All pH-metric measurements were made on a CG 808 (Schott Gerate, Germany) digital pH-meter with glass combination electrode, which was previously standardized with buffers of known pHs. The UV spectra were performed by a Perkin-Elmer UV-vis double beam spectrophotometer equipped with a PC for data processing UV WinLab-ver 2.80.03 (Perkin-Elmer, USA). The spectra were recorded over the wavelength range from 200 to 350 nm at a scan speed of 240 nm/min.Aquartz cell with a 1.0 cm path length was used.Fluorescence spectra were taken on a fluorospectrophotometer Model:6285(Jenway,UK).The spectra were recorded over the wavelength range from 200 to 650 nm at a scan speed of 1000 nm/min.
2.2. Reagents and solutions
All chemicals were of analytical reagent grade and used without further purification. Tris-HCl buffer solutions (0.1 M) were used as the supporting electrolytes in all experiments. GFX standard and Factive®tablets, each containing GFX mesylate equivalent to 320 mg of GFX, were supplied by LG Life Sciences, Ltd. (Seoul, South Korea). Milli-Q water was used for preparing all solutions used in this study. Stock solutions were protected from light and stored at 4°C.
2.3. Procedure
Aliquots of 200 μL of the supporting electrolyte solution and sample solution containing increased concentration of GFX were dropped onto the surface of the sensor,and the voltammograms initiated in the positive direction were recorded directly without any accumulation time.
2.3.1. Procedure for Factive®tablets
The proposed method was tested to determine GFX in pharmaceutical formulation, commercialized tablets Factive®,using the following procedure: five tablets were weighed and powdered. The average mass per tablet was determined.A quantity of the powder, equivalent to 320 mg of GFX, was transferred accurately to 1.0 mL of 0.1 M Tris-HCl (pH 7.0)and dissolved ultrasonic bath for 5 min.An aliquot of the clear supernatant liquor was then transferred to a volumetric flask containing buffer working solution to yield a final concentration of 10.0 μM GFX. The DP voltammograms were then recorded; the content of the drug in tablets was determined by the standard addition method. The same solutions were also analyzed by the spectral reference methods. All measurements were carried out at ambient temperature.
3. Results and discussions

Fig.1 Differential pulse voltammograms for 1.0 μM gemifloxacin in Tris buffer solutions of different pH values, at screenprinted carbon electrode. Scan rate, 10 mV/s; pulse amplitude,50 mV and pulse width, 30 ms.
The pH of the solution had significant effects on the anodic peak current response and peak potential of GFX. The effect of pH on the anodic oxidation of GFX was investigated over a pH range between 2.0 and 11.0. Exemplary differential-pulse voltammograms of 1.0 μM GFX recorded at screen-printed carbon electrodes in 0.1 M Tris-HCl working solution at different pH values are presented in Fig.1. In acidic(pH=2.0-4.0) or alkaline media (pH=8.0-11.0) no signal of the analyte was observed.In contrast,in the pH range 5.0-7.0,the voltammetric oxidation response of GFX was well-defined.Oxidation peak shifted to less positive potentials with the increase of the pH, indicating that protons participated in the current-limiting electrode process. Since the best-defined and maximum peak was obtained at pH 7.0, this pH value was maintained during further optimization and determination of the analyte.
Typical cyclic voltammogram obtained for the oxidation of 50.0 μM GFX in 0.1 M Tris-HCl buffer solution (pH 7.0) on SPCE is shown in Fig.2. The curve obtained for oxidation of GFX presents one anodic peak at 0.640 V vs. Ag-AgCl reference electrode. The fact that no peak was observed in the reverse scan suggests that the oxidation process is an irreversible one. The dependence of the peak intensity of the oxidation process at the SPE on the scan rate (ν) was examined. A linear plot of i vs. ν1/2should be obtained when the electrode process is diffusion-controlled, whereas the adsorption-controlled process should result in linear plot i vs.ν.When the potential was scanned at increasing rates from 5 to 250 mV/s, under the same experimental conditions, a linear relationship was observed between the peak intensity i and the scan rate ν:i (μA)=0.012+0.031ν (mV/s), suggesting that the GFX oxidation at the electrode surface is an adsorption-controlled process [32]. GFX showed a positive shift in the peak potential, a further indication of the irreversibility of GFX electrochemical oxidation process.
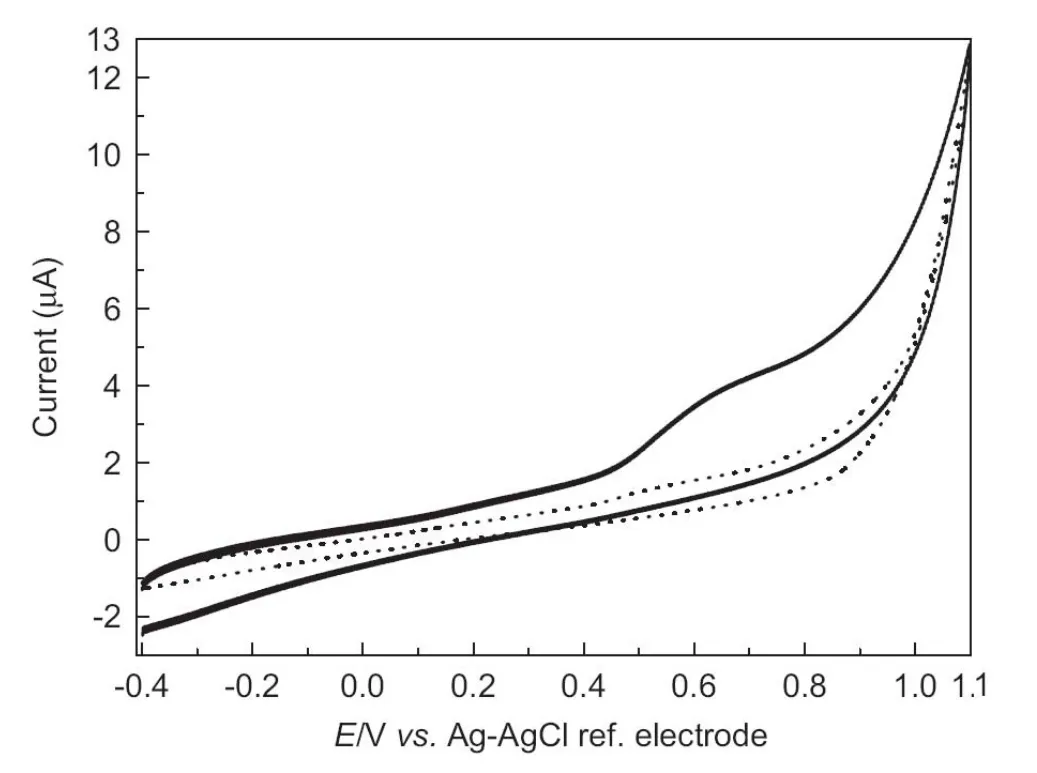
Fig.2 Cyclic voltammograms for 50.0 μM gemifloxacin in 0.1 M Tris-HCl pH 7.0 buffer solution at screen-printed carbon electrode. Scan rate=100 mV/s.

Fig.3 Differential pulse voltammograms for 1.0 μM gemifloxacin in 0.1 M Tris-HCl pH 7.0 buffer solution at screen-printed carbon electrode.Scan rate,10 mV/s;pulse amplitude,50 mV and pulse width, 30 ms. Inset is the calibration plot.
The instrumental variables for the quantitative determination of GFX were examined and the differential-pulse voltammetric method was found to have a higher sensitivity in comparison to other electroanalytical techniques.The increase of GFX concentration in 0.1 M Tris-HCl pH 7.0 was followed by the proportional increase of DPV peak height (pulse amplitude 50 mV, pulse width 50 ms and scan rate 10 mV/s)as shown in Fig.3. A linear dependence was observed within the GFX concentration range: 0.5-10.0 μM GFX. It was described by the equation: i(μA)=0.009+0.15 C (μM);r=0.993. Each point of the calibration curve corresponded to the mean value obtained from three measurements. Deviation from linearity appeared for more concentrated solutions due to the adsorption of GFX or its oxidation product.Extended linearity (linearity at higher concentration) experiment performed showed that the significant dilution of the sample before measurement could also play an important role in improving linear behavior. The standard deviations for the intercept and the slope of the calibration line were 0.65 μA and 0.15 μA/μM,respectively.The detection limit of the procedure(LOD=3Sy/x/b [33], where Sy/xis the standard deviation of yresiduals and b is the slope of the calibration plot), was calculated to be 0.15 μM and the limit of quantitation(LOQ=3Sy/x/b) was 0.050 μM.
Three different concentrations of GFX (0.50, 0.75 and 1.00 μM) were analyzed over six independent series on the same day (intra-day precision) and six consecutive days (inter-day precision). The %RSD values of intra-day and inter-day studies were 1.84 and 3.44 for GFX, respectively, suggesting that the intermediate precision of the method was satisfactory. Robustness tests were performed to investigate the reliability of results when the experimental parameters including ionic strength of supporting electrolyte, pH and instrumental DP pulse parameters were slightly changed deliberately. Test solution of 10.0 μM GFX standard solution was prepared and analyzed under each condition, and assay of GFX was determined. No significant difference was found between the results, indicating the robustness of the method.
For the specificity test, the response of the standard solution (1.00 μM) with or without different amounts of various excipients was compared. No significant change was observed. Therefore, excipients as majority compound in commercial tablet samples did not interfere in the quantitation of GFX.The accuracy of the proposed method was performed by spiking the synthetic mixture with known amounts of GFX(0.50, 0.75 and 1.00 μM). Recoveries ranging from 96.2% to 103.64% for the drug were found.
The stability of the electrochemical response is one of the most critical factors for assessing the possibilities of a screenprinted electrode to be applied in control process and routine monitoring. Although screen-printed electrodes are commercialized as disposable electrochemical sensors, the DP voltammograms recorded successively for GFX in 0.1 M Tris-HCl pH 7.0 buffer working solution at screen-printed electrodes showed negligible changes for the anodic peak. This assay demonstrates that there is no memory effect during the analysis or electrode poisoning and that the potential scan initiated in the positive direction in a blank supporting electrolyte is enough for cleaning the electrode surface. The relative standard deviation at 1.0 μM was around 4.40% with five different electrodes and around 3.64% using the same electrode (five repetitions).
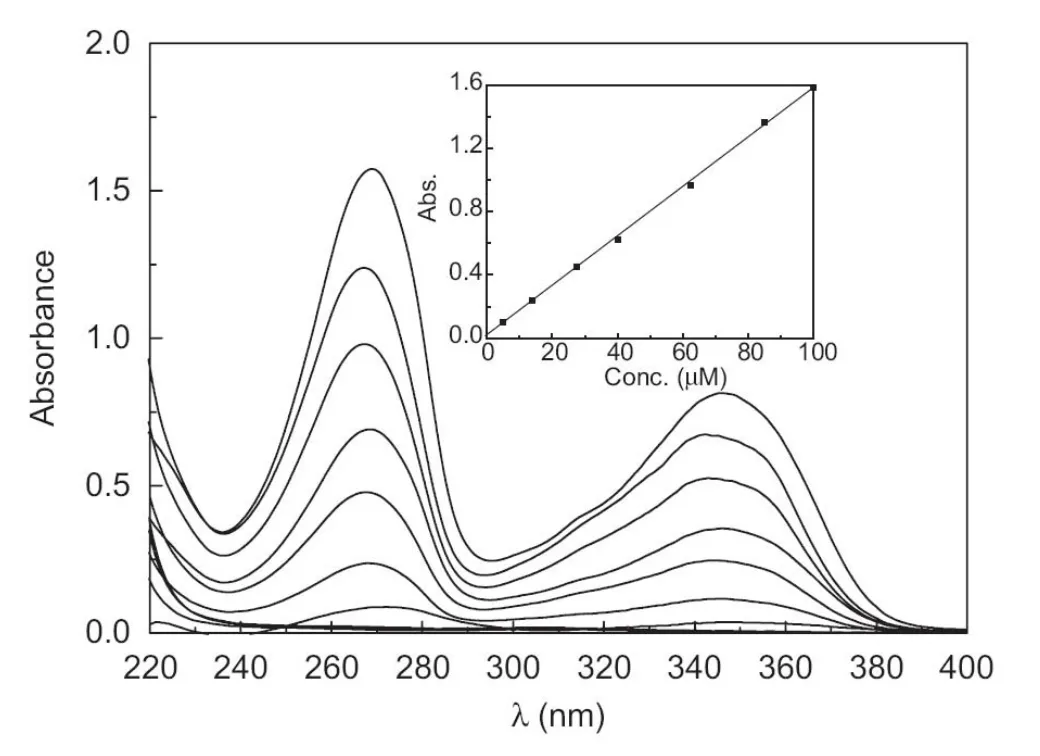
Fig.4 UV-vis spectra of gemifloxacin at different concentrations from 5.0 to 100 μM in 0.1 M Tris-HCl pH 7.0 buffer solution.Inset: calibration plot of gemifloxacin at λmax=545.61 nm.
Spectrophotometric and spectrofluorometric methods were developed for determination of GFX.Fig.4 shows the UV-vis spectrum of GFX and the calibration plot obtained between the concentration and the absorbance values.The method was linear over the concentration range of 5.0-100.0 μM, and the RSD value at 50.0 μM GFX was 3.53%.The limit of detection and the limit of quantitation were 1.50 and 5.00 μM, respectively. A method based on direct measurement of GFX fluorescence intensity was also proposed. Fig.5 shows the excitation and emission spectra of GFX and the calibration plot obtained. The method was linear over the concentration range of 0.5-80.0 μM, and the RSD value at 25.0 μM GFX was 4.00%.The limit of detection and the limit of quantitation were 0.20 and 0.65 μM, respectively.
The optimized electroanalytical method was successfully applied for determination of GFX in pharmaceutical formulation commercialized as Factive®using the standard addition method. No tedious extraction or filtration procedures have been applied during sample preparation and only dilution of aliquot from the supernatant layer with the supporting electrolyte (0.1 M Tris-HCl pH 7.0) is required before measurement. Recoveries of 108.88±3.64% of GFX were obtained for the pharmaceutical formulation samples (n=5).Table 1 gives the results obtained for the spectral methods and the DPV method, as well as the label values of the samples analyzed. The statistical calculations for the assay results suggested good precision for the DPV method. The results obtained were also compared by applying the t and F tests.[33]The calculated t and F values do not exceed the theoretical values at 95%confidence level.Therefore,there is no significant difference between the three methods with respect to the mean values and the standard deviations;therefore,the three methods are equally applicable.
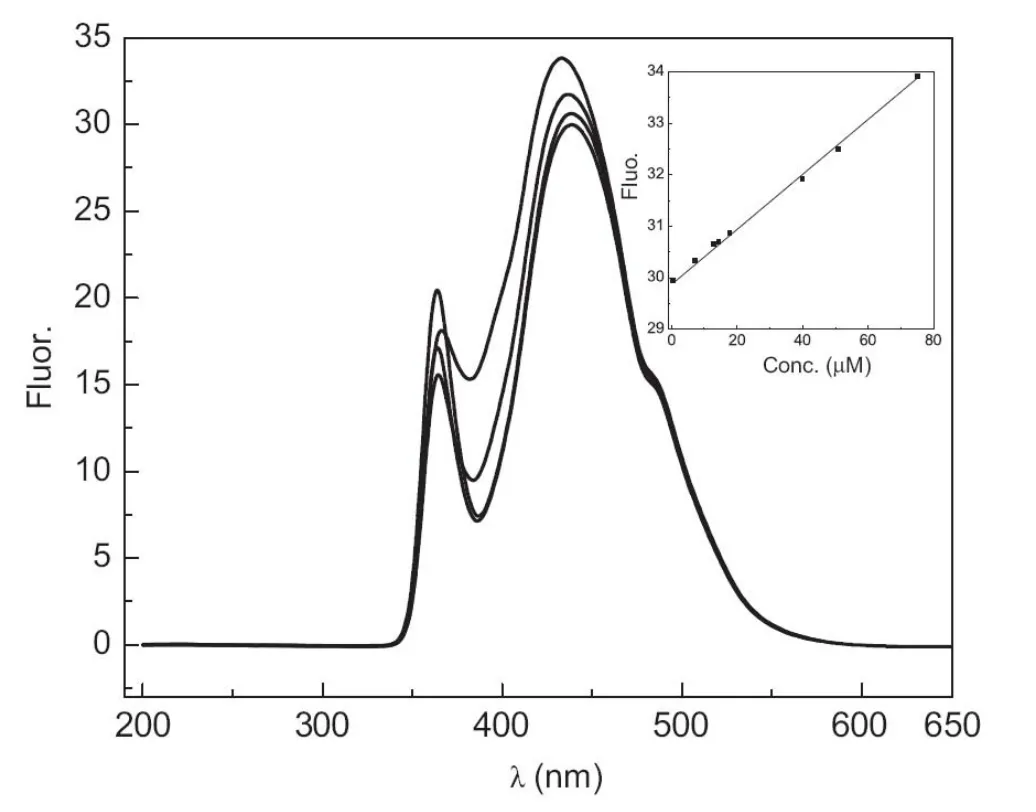
Fig.5 The excitation and emission spectra of gemifloxacin (0.5,10.0,40.0,and 50.0 μM).Inset:calibration plot of gemifloxacin at λmax=545.61 nm.
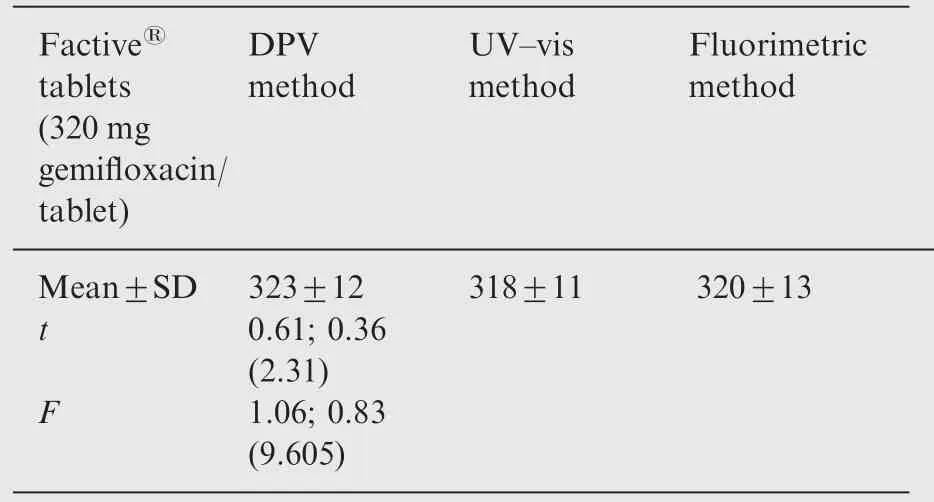
Table 1 Application of the three different methods for the determination of GFX in Factive® tablets.
4. Conclusion
This is the first use of screen-printed carbon electrodes for the anodic voltammetric determination of GFX. The advantages of screen-printed carbon electrodes include low cost, potential for miniaturization, facility of automation,and easy construction of simple and portable equipment. The good analytical performance of the proposed electroanalytical method such as precision, specificity, accuracy, robustness, good recoveries and minimal sample preparation for determination of GFX in tablet formulations has been demonstrated. The results are in agreement with those found with the spectral alternative methods. Therefore, the DPV method is very suitable for routine determination of GFX.
[1] V.T. Andriole, The quinolones: past, present, and future, Clin.Infect. Dis. 41 (2005) S113-S119.
[2] M.K. Bolon, The newer fluoroquinolones, Infect. Dis. Clin.North Am. 23 (2009) 1027-1051.
[3] A.M. Emmerson, A.M. Jones, The quinolones: decades of development and use, J. Antimicrob. Chemother. 51 (2003) 13-20.
[4] J.M. Blondeau, G. Tillotson, Gemifloxacin for the management of community-acquired respiratory tract infections,Antibiotiques 9 (3) (2007) 173-180.
[5] J.M. Blondeau, G. Tillotson, J. Deangelis, Gemifloxacin for the management of community-acquired respiratory tract infections,J. Chemother. 18 (2006) 582-588.
[7] B.K. Yoo, D.M. Triller, C.S. Yong, et al., Gemifloxacin: a new fluoroquinolone approved for treatment of respiratory infections,Ann. Pharmacother. 38 (7-8) (2004) 1226-1235.
[8] E.Doyle,S.E.Fowles,D.F.McDonnell,et al.,Rapid determination of gemifloxacin in human plasma by high-performance liquid chromatography-tandem mass spectrometry, J. Chromatogr. B:Biomed. Sci. Appl. 746 (2000) 191-198.
[9] S.I. Cho, J. Shim, M.S. Kim, et al., On-line sample cleanup and chiral separation of gemifloxacin in a urinary solution using chiral crown ether as a chiral selector in microchip electrophoresis,J. Chromatogr. 1055 (2004) 241-245.
[10] S.I. Cho, K.N. Lee, Y.K. Kim, et al., Chiral separation of gemifloxacin in sodium-containing media using chiral crown ether as a chiral selector by capillary and microchip electrophoresis,Electrophoresis 23 (6) (2002) 972-977.
[11] M.H. Hyun, S.C. Han, Y.J. Cho, et al., Liquid chromatographic resolution of gemifloxacin mesylate on a chiral stationary phase derived from crown ether, Biomed. Chromatogr. 16 (5) (2002)356-360.
[12] W. Lee, C.Y. Hong, Direct liquid chromatographic enantiomer separation of new fluoroquinolones including gemifloxacin,J. Chromatogr. 879 (2000) 113-120.
[13] J.V. Ramji, N.E. Austin, G.W. Boyle, et al., The disposition of gemifloxacin, a new fluoroquinolone antibiotic, in rats and dogs,Drug Metab. Dispos. 29 (2001) 435-442.
[14] E. Kim, Y.M. Koo, D.S. Chung, Chiral counter-current chromatography of gemifloxacin guided by capillary electrophoresis using (+)-(18-crown-6)-tetracarboxylic acid as a chiral selector,J. Chromatogr. 1045 (1-2) (2004) 119-124.
[15] S.B. Wankhede, A.M. Mahajan, S.S. Chitlange, Simultaneous spectrophotometric estimation of gemifloxacin mesylate and ambroxol hydrochloride in tablets, Der Pharma Chem. 3 (2011)269-273.
[16] M. Sugumaran, V. Meganathan, T. Vetrichelvan, Spectrophotometric method for the determination of gemifloxacin mesylate in bulk and pharmaceutical formulations, Biosci. Biotechnol. Res.Asia 5 (1) (2008) 495-496.
[17] D.Madhuri,K.B.Chandrasekhar,N.Devanna,et al.,Direct and derivative spectrophotometric estimation of gemifloxacin by chelation with palladium(II) ion, Rasayan J. Chem. 3 (1) (2010)159-165.
[18] M.V. Krishna,D.G. Sankar, Utility of σ and π-acceptors for the spectrophotometric determination of gemifloxacin mesylate in pharmaceutical formulations, E. J. Chem. 5 (2008) 493-498.
[19] M.V. Krishna, D.G. Sankar, Spectrophotometric determination of gemifloxacin mesylate in pharmaceutical formulations through ion-pair complex formation, E. J. Chem. 5 (3) (2008) 515-520.
[20] D. Jyothirmayee, G.S. Sai Babu, G.D. Rao, Spectrophotometric determination of gemifloxacin in pharmaceutical formulations,Asian J. Chem. 22 (2) (2010) 1634-1636.
[21] S. Ganapathy, G.V.H. Raju, D.G. Sankar, et al., Spectrophotometric determination of gemifloxacin in bulk and pharmaceutical formulation, Asian J. Chem. 21 (8) (2009) 6508-6512.
[22] D.C. Charan, S. Satyabrata, Simple and rapid spectrophotometric estimation of gemifloxacin mesylate in bulk and tablet formulations, Int. J. ChemTech. Res. 3 (2011) 133-135.
[23] R.R. Ambadas, P.P. Sunita, Validated UV-spectrophotometric methods for determination of gemifloxacin mesylate in pharmaceutical tablet dosage forms, E. J. Chem. 7 (2010) S344-S348.
[24] S.E.K. Tekkeli, A.nal, Spectrofluorimetric methods for the determination of gemifloxacin in tablets and spiked plasma samples, J. Fluoresc. 21 (2011) 1001-1007.
[26] B. Uslu, S.A. Ozkan, Solid electrodes in electroanalytical chemistry: present applications and prospects for high throughput screening of drug compounds, Comb. Chem. High Throughput Screening 10 (7) (2007) 495-513.
[27] A.E. Radi, Recent updates of chemically modified electrodes in pharmaceutical analysis,Comb.Chem.High Throughput Screening 13 (8) (2010) 728-752.
[28] J.M.P.J. Garrido, E.M.P.J. Garrido, A.M. Oliveira-Brett, et al.,An electrochemical outlook on tamoxifen biotransformation:current and future prospects, Curr. Drug Metab. 12 (4) (2011)372-382.
[29] R. Jain Rajeev, J.A. Rather, Voltammetric determination of antibacterial drug gemifloxacin in solubilized systems at multiwalled carbon nanotubes modified glassy carbon electrode,Colloids Surf. B. Biointerfaces 83 (2011) 340-346.
[30] J.P. Hart, A. Crew, E. Crouch, et al., Some recent designs and developments of screen-printed carbon electrochemical sensors/biosensors for biomedical, environmental, and industrial analyses, Anal. Lett. 37 (2004) 789-830.
[31] J.P. Hart, S.A. Wring, Recent developments in the design and application of screen-printed electrochemical sensors for biomedical,environmental and industrial analyses,Trends Anal.Chem.16 (1997) 89-103.
[32] D.K.Gosser Jr.,Cyclic Voltammetry:simulation and Analysis of Reaction Mechanisms, Wiley-VCH, New York, 1993.
[33] J.C. Miller, J.N. Miller, Statistics for Analytical Chemistry,Ellis Horwood, West Sussex, 1993.
 Journal of Pharmaceutical Analysis2013年2期
- Journal of Pharmaceutical Analysis的其它文章
- Analysis of spironolactone residues in industrial wastewater and in drug formulations by cathodic stripping voltammetry
- Electrochemical study and application on rutin at chitosan/graphene films modified glassy carbon electrode
- Liquid chromatography tandem mass spectrometry method for the estimation of lamotrigine in human plasma:Application to a pharmacokinetic study
- New simple spectrophotometric method for determination of the binary mixtures (atorvastatin calcium and ezetimibe;candesartan cilexetil and hydrochlorothiazide) in tablets
- Determination of cefcapene acid by LC-MS and their application to a pharmacokinetic study in healthy Chinese volunteers
- Establishment of inherent stability of pramipexole and development of validated stability indicating LC-UV and LC-MS method