
Numerical study on static and dynamic fracture evolution around rock cavities
2013-10-19 06:58WangSunYangYangTang
S.Y.Wang,L.Sun,C.Yang,S.Q.Yang,C.A.Tang
aARC Centre of Excellence for Geotechnical Science and Engineering,The University of Newcastle,Callaghan,NSW 2238,Australia
bDepartment of Civil Engineering,Catholic University of America,Washington,DC 20064,USA
cSchool of Transportation,Southeast University,Nanjing,China
dCentre for Geotechnical and Materials Modelling,Department of Civil,Surveying and Environmental Engineering,The University of Newcastle,Callaghan,NSW 2308,Australia
eState Key Laboratory for Geomechanics and Deep Underground Engineering,School of Mechanics and Civil Engineering,China University of Mining and Technology,Xuzhou 221008,China
fSchool of Civil and Hydraulic Engineering,Dalian University of Technology,Dalian 116024,China
1.Introduction
The stability of cavities in the presence of static and dynamic loads has long been the subject of intensive studies in mining and civil engineering.Extensive examinations of fracture evolution around a single pre-existing cavity have been completed(Gay,1976;Hoek and Brown,1980;Ewy and Cook,1990;Carter et al.,1991;Carter,1992;Ingraffea,1997).The fracture patterns under increasing uniaxial compression generally consist of primary fractures(T1),remote fractures(T2)as well as shear fractures(NS)(see Fig.1).Primary fractures form at the center of the crown and invert due to the high local tension. Remote cracks form at a remote position from the cavity,while shear fractures develop where high compressive stresses exist(Lajtai and Lajtai,1975).
Under static or dynamic loads,fractures can initiate from cavities and propagate.Meanwhile,new cracks may be initiated.The damage caused by micro-cracking is the main dissipation process associated with inelastic behavior and failure in brittle rock.In this case,rock failure occurs due to a progressive material degradation,micro-cracks initiate and propagate on a small scale,and then coalesce to form large-scale macroscopic fractures and faults(Souley et al.,2001).To describe this mechanism of crack evolution around cavities,micromechanical fracture models have been proposed based on experimental studies.
Based on continuum damage mechanics,many damage models have been developed to study the dynamic damage evolution of brittle materials with micro- flaws and cavities(Grady and Kipp,1979;Suaris and Shah,1985;Tayloretal.,1986;Fahrenthold,1991;Yang et al.,1996;Yazdchi et al.,1996;Liu and Katsabanis,1997;Li et al.,2001;Huang et al.,2002).Most of these models were developed by combining the theory of fracture mechanics with a statistic treatment to account for the random distribution of micro-cracks.
Although many numerical methods,including finite element,boundary element, finite difference and discrete element methods do well in simulating the nonlinear behaviors of rock deformation,most of them do not consider the effects of strain rate on the rock strength,and they cannot demonstrate progressive failure due to rock heterogeneity, which is the primary cause of nonlinear behavior.Therefore,a more reasonable numerical code RFPA2D(rock failure process analysis)was developed(Tang et al.,1993,2000;Tang,1997;Tang and Kou,1998).This code,which considers the effects of strain rate on rock strength, has been successfully applied to studying the dynamic failure process of rock(Chau et al.,2004;Zhu and Tang,2006;Wang et al.,2011).
It is noted that,although there are some limitations,the laboratory experimental and numerical tests on small scales still have their own advantages.For example,it is easy to control the loading/boundary conditions,and also can monitor more data during the failure process of specimen.In this paper,RFPA2Dwas used to simulate the evolution of static and dynamic fracture initiation and4 propagation around pre-existing cavities in brittle rock.Moreover,the characteristics of acoustic emission(AE)associated with the fracture evolution were simulated.Finally,the evolution and interaction of fractures between multiple cavities were investigated by stress redistribution and transference in compressive and tensile stress fields.
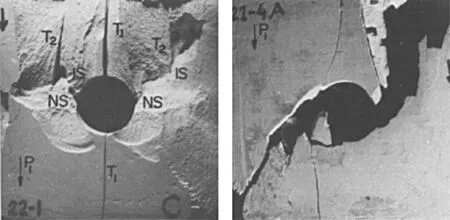
Fig.1.Fracture pattern of plaster samples(Lajtai and Lajtai,1975).
2.Brief description of RFPA2D
RFPA2D(Tang,1997)is a two-dimensional finite element code that simulates fracture and failure processes of quasi-brittle materials such as rocks.To model the failure of rock material(or rock mass),rock medium is assumed to be composed of many mesoscopic rectangle elements of the same size.The material properties of these elements are different and can be specified according to a Weibull distribution.These elements are considered as four-node isoparametric elements in a finite element analysis. Elastic damage mechanics is used to describe the constitutive laws of the mesoscale elements,and the maximum tensile strain criterion and the Mohr-Coulomb criterion are utilized as damage thresholds(Zhu and Tang,2004).
2.1.Elastic damage constitutive law
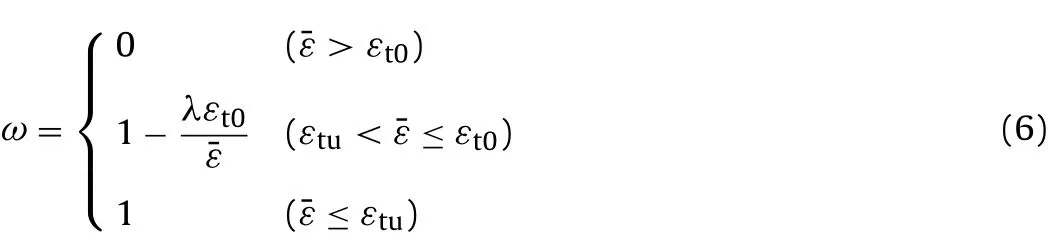
The damage mechanics approach is employed to model the mechanical behavior of meso-scale elements. For each element,the material is assumed to be linearly elastic,isotropic and damage free before loading.Its elastic properties are defined by the elastic modulus and Poisson’s ratio.Based on elastic damage mechanics,the strength and stiffness of the element are assumed to degrade gradually as damage progresses.The elastic modulus of the damaged material is given by where ω represents the damage variable;E and E0are the elastic moduli of damaged and undamaged materials,respectively.

The damage variable of the mesoscopic element under uniaxial tension is expressed as(Zhu and Tang,2004;Wang et al.,2011):
where E0is the elastic modulus of undamaged material;ftris the residual tensile strength,which is given as ftr=λft0=λE0εt0,ft0and λare the uniaxial tensile strength and residual strength coefficient,respectively;εt0is the strain at the elastic limit, which can be called the threshold strain;and εtuis the ultimate tensile strain at which the element is completely damaged.The ultimate tensile strain is defined as εtu= ηεt0,where η is the ultimate strain coefficient(Zhu and Tang,2004,2006).Eq.(2)can be written as(Zhu and Tang,2004;Wang et al.,2011):
In addition,it is assumed that damage to mesoscopic elements in multi-axial stress states is also isotropic and elastic(Tang,1998).The damage to the elements occurs in the tensile mode whenever the equivalent major tensile strain,¯ε,is greater than the threshold strain,εt0.The equivalent principal strain,¯ε,is defined as follows(Wang et al.,2011):

where ε1,ε2andε3are three principal strains;and <·> is a function defined as follows(Zhu and Tang,2004):
The constitutive law of the element subjected to multi-axial stresses can be easily obtained by substituting the equivalent strain,¯ε,into Eq.(3).The damage variable under a multi-axial stress state is then obtained as(Zhu and Tang,2004;Wang et al.,2011):
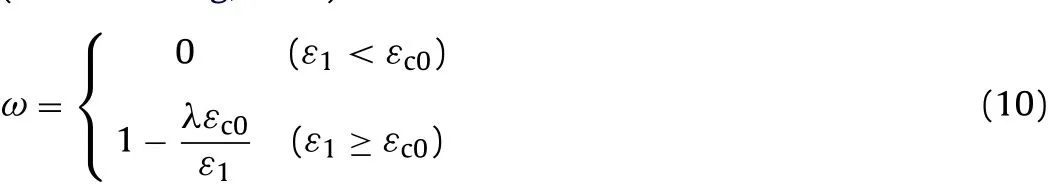
To study the damage of elements subjected to compressive and shear stresses,the Mohr-Coulomb criterion,given below,was used as the second damage threshold(Zhu and Tang,2004):

whereσ1andσ3are the major and minor principal stresses,respectively;fc0is the uniaxial compressive strength;andφ is the internal friction angle of the mesoscopic element.Similarly,according to the Mohr-Coulomb criterion,the expression for the damage variable,ω,with respect to the element under uniaxial compression can be described as(Wang et al.,2011):
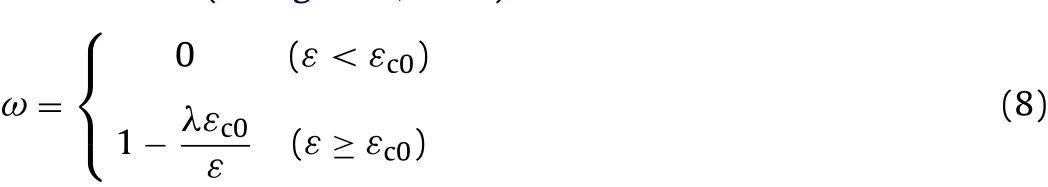
where λ is equal tofcr/fc0orftr/ft0when the element is under uniaxial compression or tension,respectively.
Damage occurs when the element is under multi-axial stress and its strength satis fies the Mohr-Coulomb criterion.The effect of other principal stresses during the damage evolution process should be considered.When the Mohr-Coulomb criterion is met,the maximum principal strain(maximum compressive principal strain),εc0,is calculated at the peak value of maximum principal stress(maximum compressiv eprincipal stress)(Wang et al.,2011):
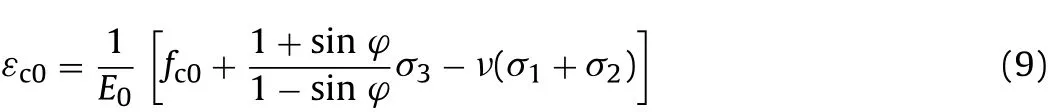
where ν is the Poisson’s ratio.
In RFPA2D,the specified displacement(or load)is applied on the specimen step by step.If some elements become damaged at a given step according to the above derivation of the damage variable,ω,and Eq.(1),the damaged elastic modulus of elements at each stress or strain level can be calculated.Then the calculation must be restarted under the current boundary and loading conditions to achieve the stress redistribution in the specimen.At last,the external load(or displacement)is increased and the calculation proceeds to the next step of the analysis.Thus,the progressive failure process of rock subjected to gradually increasing static loading can be simulated.A user-friendly pre-and post-processor is integrated into RFPA2Dto deal with the data input and to display the numerical results(Tang,1997).
In RFPA2D,the failure(or damage)of each element is assumed to be the source of an acoustic event because the failed element must release its elastic energy stored during the deformation.Therefore,by recording the number of damaged elements and the associated amount of energy release,RFPA2Dis capable of simulating AE activities,including the AE eventrate,magnitude and location.According to Tang and Kaiser(1998),the accumulative damage,ω,can be calculated by the following equation:
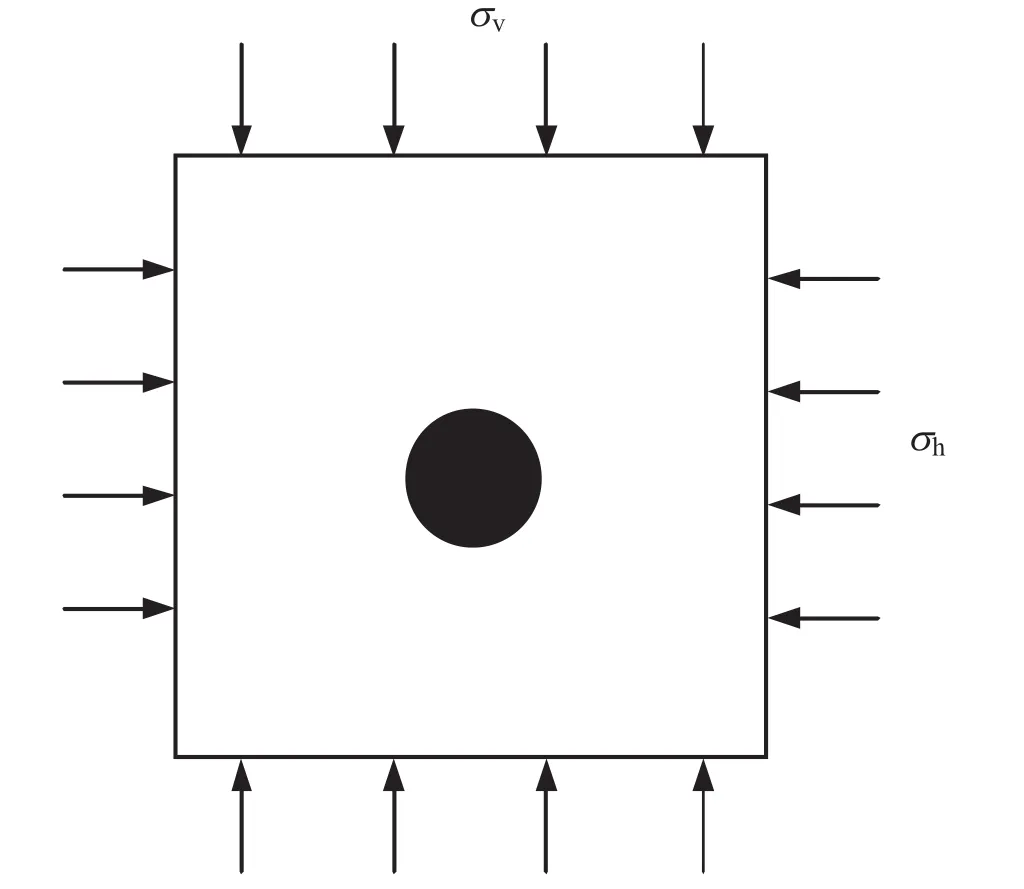
Fig.2.Numerical model setup for the static case.
wheresis the number of calculation steps,niis the damaged elements in theith step,andNis the total number of elements in the model.In addition,when the element fails,the energy released is calculated by the following equation(Tang et al.,2007):

whereiis the element number,Wiis the released elastic strain energy,Eis the elastic modulus of damaged material,andVis the element volume(Tang et al.,2007).
2.2.Strain-rate-dependent damage threshold
The effects of strain rate on the strength of rock have beenwidely studied through experiments.Based on a variety of experimental results of granite,Zhao(2000)proposed that the Mohr-Coulomb law is also applicable to dynamic loading conditions if the increase of cohesion with the strain rate is taken into account.The relation between dynamic uniaxial compressive strength and loading rate can be described with a semi-log formula as follows:
where σcdis the dynamic uniaxial compressive strength(MPa),˙σcdis the dynamic loading rate(MPa/s),˙σcis the quasi-static loading rate,σcis the uniaxial compressive strength at the quasi-static loading rate,and the parameterAreflects the effect of strain rate on the dynamic strength.In this investigation,the values ofAfor different material sare obtained basedon the assumption thatAincreases linearly with the uniaxial compressive strength(Zhao et al.,1999).This parameter,A,in the present research is 14.In addition,this type of semi-log relationship has also been proposed by Grady and Kipp(1979)to study the strain-rate effect of other rocks.For finite element implementation,the equilibrium equations governing the linear dynamic response of a system of finite elements can be expressed in the following form:where M,C and K are the mass,damping and stiffness matrices,respectively;R is the vector of externally applied loads;and U,˙U and Ü are the displacement,velocity and acceleration vectors of the finite elements,respectively.In addition,lumped mass analysis is assumed,where the structure mass is the sum of the individual element mass matrices plus additional concentrated masses that are specified at selected degrees of freedom(Zhu and Tang,2006).In addition,Rayleigh damping is assumed,and direct numerical step-by-step integration is adopted for solving problems in which a body is subjected to a short duration impulse load(Zhu and Tang,2006;Wang et al.,2011).
对表1中的工况1和工况12进行实验,并将实验结果与相应的数值模拟结果进行对比,结果如表3所列。表3还给出了数值模拟得到的碎片第2阶段瞬时速度v1、第3阶段速度增量vi及最终速度v。针对这两个工况,给出了3个理论模型的相应结果。可以看出,模型2的结果与实验结果偏离较多,而模型1和模型3在装药比很小时的结果都比较接近实验结果,在装药比较大时与实验结果偏离较多。相对而言,模型3的结果整体上更接近实验结果,这表明数值模拟方法是正确的。因此,后续其他工况通过3个理论模型计算的碎片最终速度与数值模拟的相应结果进行比较。

Table 1Material properties of rock specimens for static models.

Table 2Material properties of rock specimens for dynamic models.
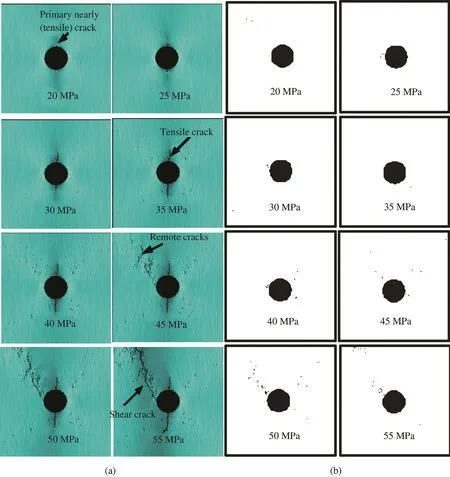
Fig.3.The evolution of cracks around the cavity with K0=0:(a)the shear stress distribution during the process of fractures’evolution and(b)the associated AE distribution.

For this kind of dynamic response problem,the maximum time step is related to the wave speed in the material and the size of finite element.The maximum time step is selected such that the stress wave cannot propagate further than the distance between the element integration points within the time increment.When the stress-rate effect is considered and the stresses(or strains)of elements meet the maximum tensile strain criterion or the Mohr-Coulomb criterion,damage occurs according to the constitutive laws. Then their stress states are re-analyzed iteratively with respect to the current boundary conditions to reflect the stress redistribution at this time step.The program will not proceed to the analysis of the next time step until no new damaged elements are found at the last iterative step for the current time(Zhu and Tang,2006;Wang et al.,2011).
Validation studies using typical laboratory tests of rock and concrete have been conducted to test the formulation of fracture evolution and rock failure(Tang,1997,1998;Chau et al.,2004;Zhu and Tang,2004,2006;Wang et al.,2006,2011).Under a variety of static and dynamic loading conditions,the model can effectively simulate some key features of rock deformation and failure in quasi-brittle materials(such as rock and concrete);it also can simulate the nonlinearity of stress-strain response,localization of deformations,strain softening,and crack propagation process.
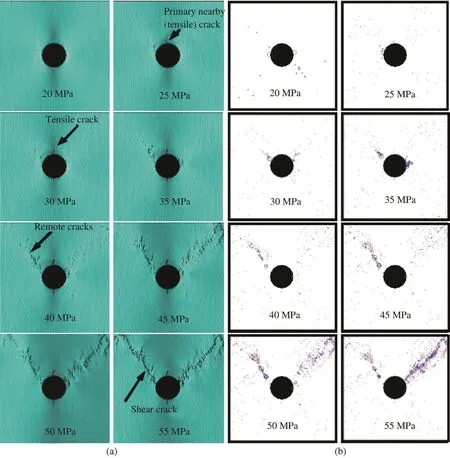
Fig.4.The evolution of cracks around the cavity with K0=0.19:(a)the shear stress distribution during the process of fractures’ evolution and (b) the associated AE distribution.
3.Model description
In total,four types of models were simulated in this study.Three numerical models with a single circular cavity and with K0values of 0,0.19 and 0.24 were simulated.The value of K0is defined as the initial ratio of σh/σv,where σhand σvare the imposed horizontal and vertical stresses,respectively.It is noted that,in practical rock engineering,values as low as these mentioned above are extremely uncommon with values of equal to or greater than 1.0 being more common than not.However,current research mainly focuses on the fundamental failure mechanism of rock mass with pre-existing cavities,based on the small-scale laboratory tests.The reason for only K0values of 0,0.19 and 0.24 are used in the simulations,is that we mainly investigate the effect of higher K0on the development of the tensile and shear cracks.Nevertheless,the effect of more different values of K0will be numerically simulated in the future work, which has good practical interests.
In addition, four numerical models with three cavities arrayed in the inclined angle of 0°,30°,60°and 90°simulated.Two numerical models with a single circular cavity under vertical and horizontal dynamic compression were simulated.Finally,two numerical models with three and four circular cavities under vertical dynamic compression also were simulated,respectively.The basic parameters for the static and dynamic models are listed in Tables 1 and 2,respectively.
In the first stage of geotechnical deformation analysis,gravity and boundary loads are applied.Equilibrium should be satisfied,and deformations caused by these stresses are usually ignored.RFPA2Dchecks for equilibrium during the initial stage and iterates,if needed,to obtain a state of stresses that is in equilibrium with the prescribed boundary conditions.
In all of the sets of simulations,the domain was discretied into groups of square elements.The stress condition of each element was then examined for failure before the next load increment.The two-dimensional plane strain numerical model was chosen.The material properties were determined according to the Weibull statistical distribution.Most importantly,the fracture propagation in this model was neither controlled by fracture toughness nor related to a stress intensity factor at the advancing crack tip. The failure was solely controlled by the compressive or tensile strength of the individual elements according to the rules specified above. More details of the numerical simulations of rocks under static and dynamic loads have been presented previously(Zhu and Tang,2004;Wang et al.,2011).
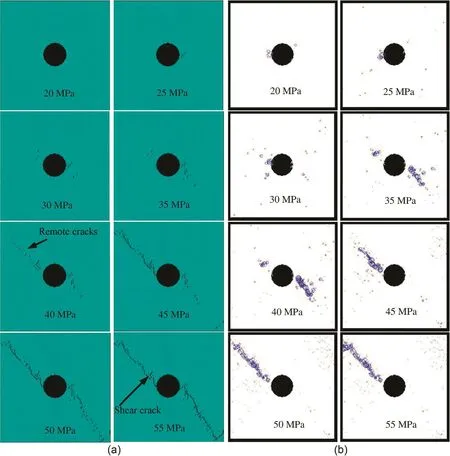
Fig.5.The evolution of cracks around the cavity with K0=0.24:(a)the shear stress distribution during the process of fractures’ evolution and (b) the associated AE distribution.
4.Numerical results for static models
4.1.Fracture evolution around cavities with different K0 conditions
In this section,three numerical simulations with K0value of 0,0.19 and 0.24 were carried out to investigate the fracture evolution around a single cavity in the center of the specimen(Fig.2).The domain of 500mm×500mm was divided into 40,000 elements with material properties following the Weibull statistical distribution.The diameter of the cavity was 80mm.The material parameters are listed in Table 1.
Numerical results of the evolution of fractures for models with K0=0,0.19 and 0.24 around a single circular cavity are shown in Figs.3-5.Figs.3a,4a and 5a illustrate the shear stress distribution during the process of fractures’evolution,and Figs.3b,4b and 5b present the associated AE distribution. As seen in Fig. 3, the primary tensile cracks were detected at the center of the cavity when the shear stress was about 20MPa.When the shear stress was 25MPa,tensile stress concentrations developed at points of the crown or invert.With an increase of external loading,the primary tensile crack started to propagate vertically.Accompanying the appearance of the primary tensile cracks,some AE events occurred in the vicinity of the cracks,which can be seen in Fig.3b.When the shear stress was 45MPa,some remote cracks formed in an off-set(or remote)position away from the primary crack and cavity. This phenomenon was verified from the AE distribution in Fig.3b.Clusters of circles appeared in the position of the remote cracks,as shown in Fig.3a.When the shear stress was 50MPa,a shear crack formed 30°to the vertical tensile crack.With the increase of shear stress,more and more remote fractures were coalesced,and the model became unstable.As a result,the cavity collapsed.
Figs. 4 and 5 illustrate the numerical results of fractures for models with K0values of 0.19 and 0.24.Although all three types of cracks appeared in the model,due to increasing K0,the stresses at the crown became less tensile,and the initiation of a tensile crack increased with increasing confinement.For instance,in Fig.4a,the primary tensile crack appeared when the shear stress was 25MPa,which was higher than 20MPa in Fig.3a.However,with the increase of the shear stress,the primary tensile crack in Fig.4a did not propagate further.In contrast,the primary tensile crack in Fig.3a increased gradually in length.In addition,in Fig.5a,the tensile crack was almost non-existent in the crown of the cavity.This phenomenon can be explained by the fact that shear fractures dominate the failure process of the specimen as K0increases.Meanwhile,primary tensile fracture was distinctly depressed due to increasing shear stress.RFPA2Denabled us to distinguish tensile fracture from shear fracture according to the color of circles of AE events(Tang,1997).For example,from the colors of AE in Fig.4b,the remote cracks were the clusters of smaller tensile and shear fractures;however,the shear fractures dominated in this stage.
In summary,the numerical results showed the evolution of three types of cracks.The tensile fractures were always involved in the mechanism of collapse.For K0=0,the tensile fracture dominated during the process;for K0=0.19,both the tensile and shear fractures occurred;for K0=0.24,the shear fracture dominated the remote fracture.The numerically simulated fracture patterns agreed with the experimental results presented by Lajtai and Lajtai(1975).
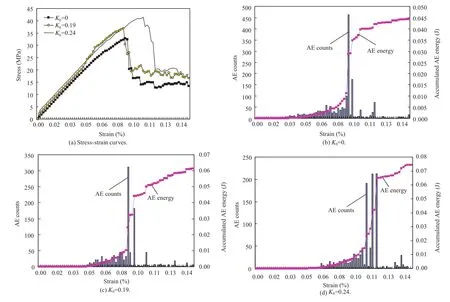
Fig.6.Curves of stress as well as AE counts and AE energy release for models with K0values of 0,0.19 and 0.24 vs.strain.
In addition,the appearances of these fractures are always accompanied by releases of stored strain energy,as illustrated in Fig.6.Fig.6 shows the interdependent effects of stress,strain,AE counts,and AE energy on fracture evolution with different K0values.Due to the brittle properties of the rock samples(average elastic modulus of 60,000MPa and average compressive strength of 200MPa)in the present numerical simulation,the numerically simulated results showed almost the same brittle post-peak behavior.The existence of cavities also determined nearly the same post-peak behavior.Each stress drop was associated with an AE count and an AE energy release.It is clear from Fig.6a that the stress-strain curves of the model showed more ductile characteristics due to increasing confinement with increasing K0.In addition,the peak strength and residual strength increased with increasing K0.Comparing Fig.6a-c,the AE events decreased with increasing K0,whereas the released AE energy increased gradually with increasing K0.This is due to the fact that rock fails easily under tension but not under compression or shear.As mentioned above,when K0=0,tensile fractures dominated,and with increasing K0,shear fractures became more dominant.Accordingly,due to increasing confinement with higher K0,tensile cracks were depressed,leading to reduced AE counts,as shown in Fig.6a.On the other hand,shear cracks need more external energy to form.
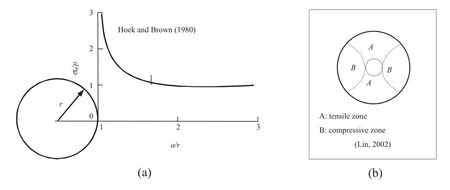
Fig.7.Schematic of tensile and compressive zone distributions in the specimen with single cavity.
4.2.Interactions of multiple cavities
In this section,four numerical models with three cavities arrayed at inclined angles of 0°,30°,60°and 90°were simulated to study the interaction of multiple cavities and the evolution of fractures among the cavities.The basic material parameters of these models were the same;the homogeneity index was 3,and K0was 0.19.In addition,in this section,we mainly study the interaction effect between pre-existing cavities due to static loadings. Only the middle value of K0=0.19is selected, as in this case, both tensile and shear cracks could develop based on the previous case of one cavity in Section 4.1.
According to Hoek and Brown (1980), Fig. 7a illustrates the relationship between the normalized stress and the ratio a/r,where r is the radius of the cavity and a is the distance to the cavity.From
Fig.7a,when the distance from the cavity is three times more than the radius of cavity,the influence of stress due to the existence of cavities is negligible.Therefore,the stress influence zone is mainly concentrated on the circular region where the diameter is six times larger than that of the cavity(Fig.7b).Zone A represents the tensile stress zone, and Zone B represents the compressive stress zone.Fig.8 shows the influence of the three cavities based on the distribution of tensile and compressive stress zones in the specimen.When the three cavities were arrayed horizontally,the tensile zones did not influence each other.However,the compressive zones could overlap,and the cracks could appear in those overlapping zones.
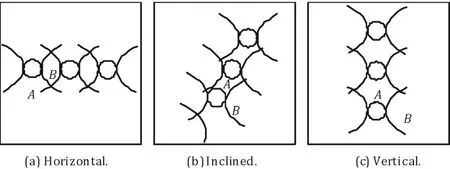
Fig.8.Schematic of the distribution of tensile and compressive stress zones in specimen with three cavities(Lin,2002).
In addition, when the three cavities were arranged in an inclined array,the compressive zones almost did not overlap;however,the tensile zones could overlap in the inclined direction,and cracks could propagate along the overlapping zone.Finally,when the three cavities were arrayed vertically,the compressive zones did not influence each other,whereas the tensile zones could overlap.
Fig.9 shows the evolution of fractures among the three cavities arrayed at 0°,30°,60°and 90°.When the three cavities were arrayed horizontally,the shear stress was 20MPa,and the primary tensile cracks initiated in the top and bottom crown of cavity(Fig.9a).In this stage,the fracture evolution was not strongly influenced by the presence of adjacent cavities.When the shear stress was 35MPa,remote cracks were initiated and propagated in the overlapping compressive zones.In this stage,fracture evolution was influenced significantly by the adjacent cavities.A shear crack formed when the shear stress was 50MPa.In addition,remote cracks appeared in the tensile overlapping zones,and shear cracks formed along the direction of the inclined angle(Fig.9b-d).In this stage,the fracture process is best described as involving the destruction of rock bridges separating the individual cavities;this observation is consistent with the experimental results shown in Fig.10(Lajtai and Lajtai,1975).
5.Numerical results for dynamic models
5.1.Fracture evolution around a single cavity subjected to dynamic loads
In this section,two numerical models with single circular cavities were subjected to vertical and horizontal compressive stress waves to study the evolution of fractures around a cavity.One model was subjected to a vertical compressive stress wave.The other model was subjected to vertical and horizontal compressive stress waves,which were imposed at the same time.Fig.11 shows the two waves that were applied to the specimens.The 500mm×1000mm domain was divided into 80,000 material elements with properties following the Weibull statistical distribution.
The diameter of the cavity was 80mm.The basic material parameters are listed in Table 2.
Fig.12 shows the numerically simulated fracture evolution around the single cavity subjected to vertical dynamic loading.The stress wave propagated from the top to the bottom of the specimen.The primary tensile crack was initiated at 85μs,despite the fact that the first front of the stress wave passed the cavity at 50μs.
The tensile cracks from the top and bottom crown of the cavity propagated until the stress wave reached the bottom of the specimen.However,the stress wave reflected back when it reached the bottom of the specimen(at 100μs),and the tensile crack from the bottom crown propagated faster than that from the top crown.This is likely due to the fact that both the compressive wave and the tensile wave influenced the propagation of tensile cracks.In particular,the reflected wave was represented as a tensile wave,which accelerated the propagation of tensile cracks because rock had less tensile strength than compressive strength.
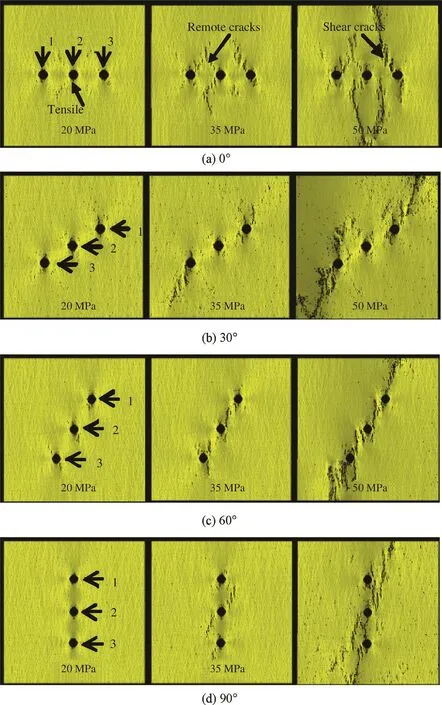
Fig.9.Plots of simulated maximum shear stress of three cavities with inclined angles from the direction of the maximum compression of 0°,30°,60° and 90°.
Fig.13 shows the numerically simulated fracture evolution around a single cavity subjected to both horizontal and vertical dynamic loadings.The horizontal compressive stress wave was reflected more quickly because the width of the specimen was shorter than the height.Accordingly,both the vertical and horizontal compressive stress waves could cause tensile cracks to form and propagate. The remote cracks first appeared at 80μs.When the vertical compressive stress waves passed the cavity,the primary tensile crack appeared (at 85μs, the same time as the vertical compressive stress wave in Fig. 12). At this stage, remote cracks only occurred above the cavity. As the tensile crack propagated from the bottom crown of the cavity,remote cracks began to propagate in the region under the cavity.Moreover,when the vertical compressive stress wave was reflected from the bottom,under the effect of both the horizontal and vertical compressive waves and their reflected waves,the remote cracks and tensile cracks interacted to form several bigger vertical cracks.In other words,the remote cracks formed the final vertical tensile cracks.This was different for the static models in which the remote cracks formed the shear cracks in Figs.3-5.
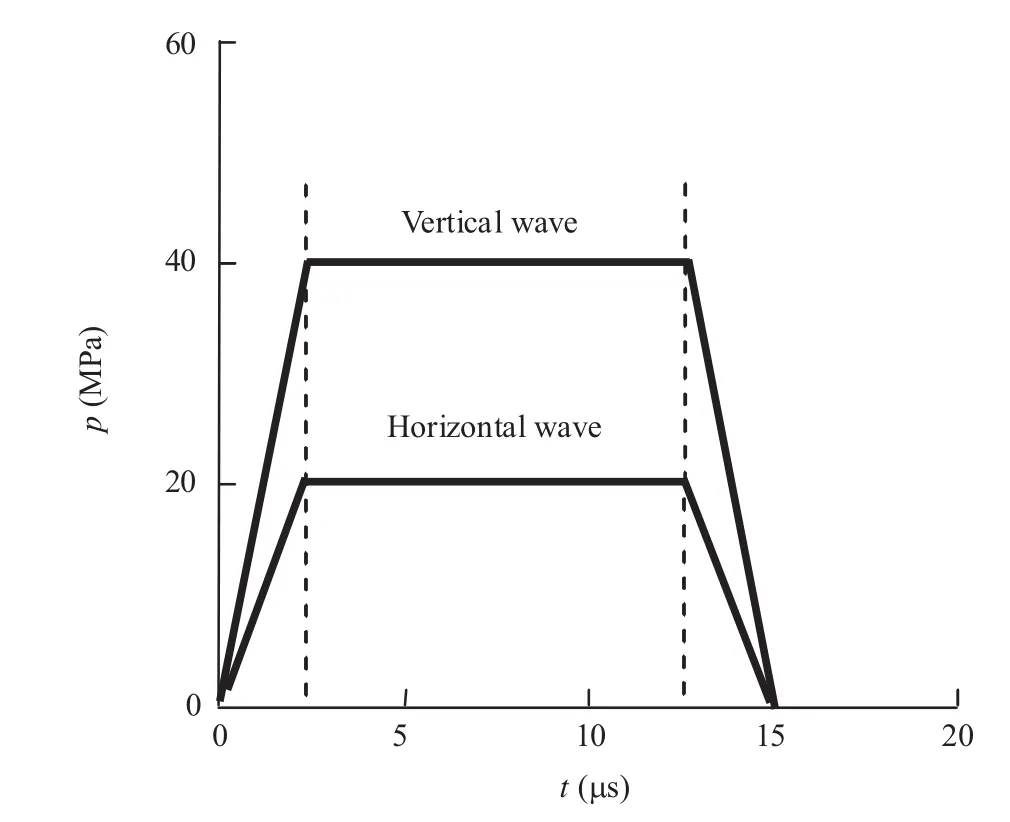
Fig.11.Two kinds of waves applied to the specimens.
5.2.Fractures evolution around multi-cavity subjected to dynamic loading
In this section,two numerical models were examined to investigate the evolution of fractures between cavities.One was the specimen with the three circular cavities arrayed vertically.The other one was the specimen with four circular cavities arrayed in a diamond.Both of these models were subjected to a vertical compressive stress wave as depicted in Fig. 11. The material parameters of rock are listed in Table 2.
Fig.14 shows the numerically simulated evolution of fractures from three vertically arrayed cavities.As the vertical compressive stress wave propagated from the top to the bottom of specimen,the primary tensile crack of Cavity 1 appeared at 80μs.The primary tensile crack of Cavity 2 was initiated at 85μs.Furthermore,the tensile cracks of Cavities 1 and 2 coalesced at 90μs.The tensile crack of Cavity 3 was initiated when the vertical compressive stress wave was reflected at 100μs.In addition,the tensile cracks of Cavities 2 and 3 coalesced at 130μs.The tensile crack from the top crown of Cavity 1 increased slowly,but the tensile crack from the bottom crown of Cavity 1 increased more rapidly due to the influence of the tensile crack from Cavity 2.Meanwhile,the two tensile cracks from the bottom crown of the cavities appeared and propagated,which was different from the single cavity result in Fig.12.
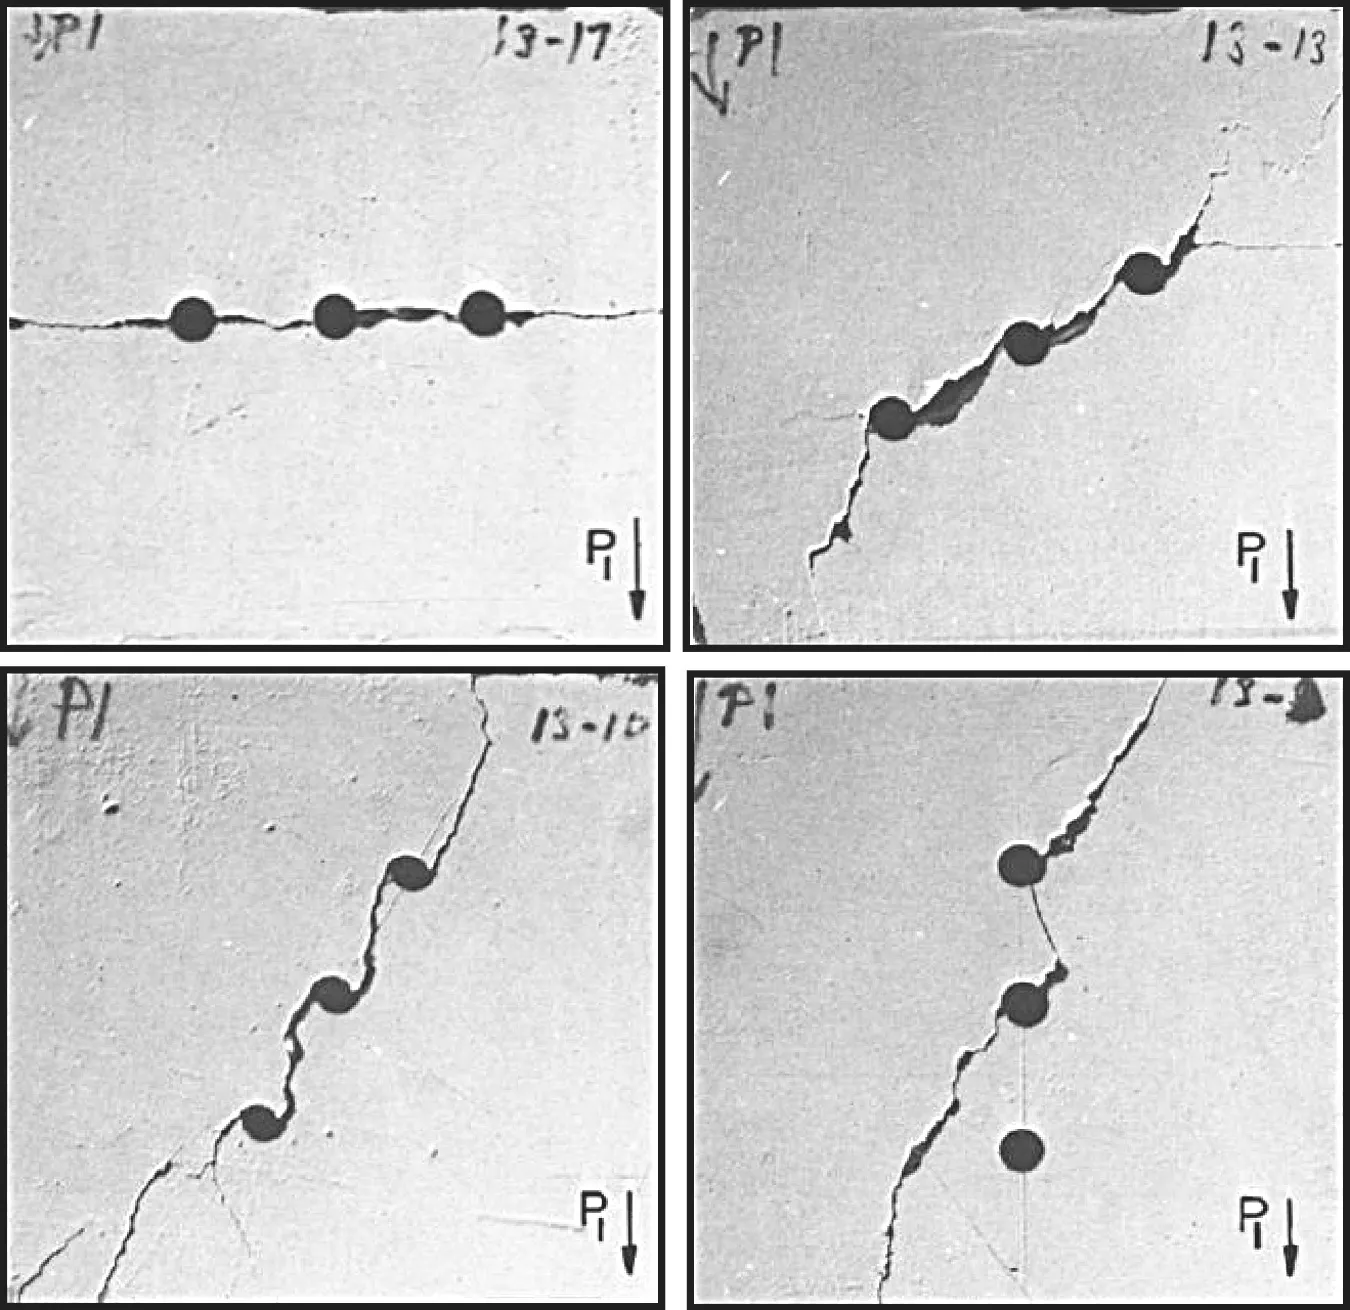
Fig.10.Experimental results of fracture pattern of cavities(Lajtai and Lajtai,1975).
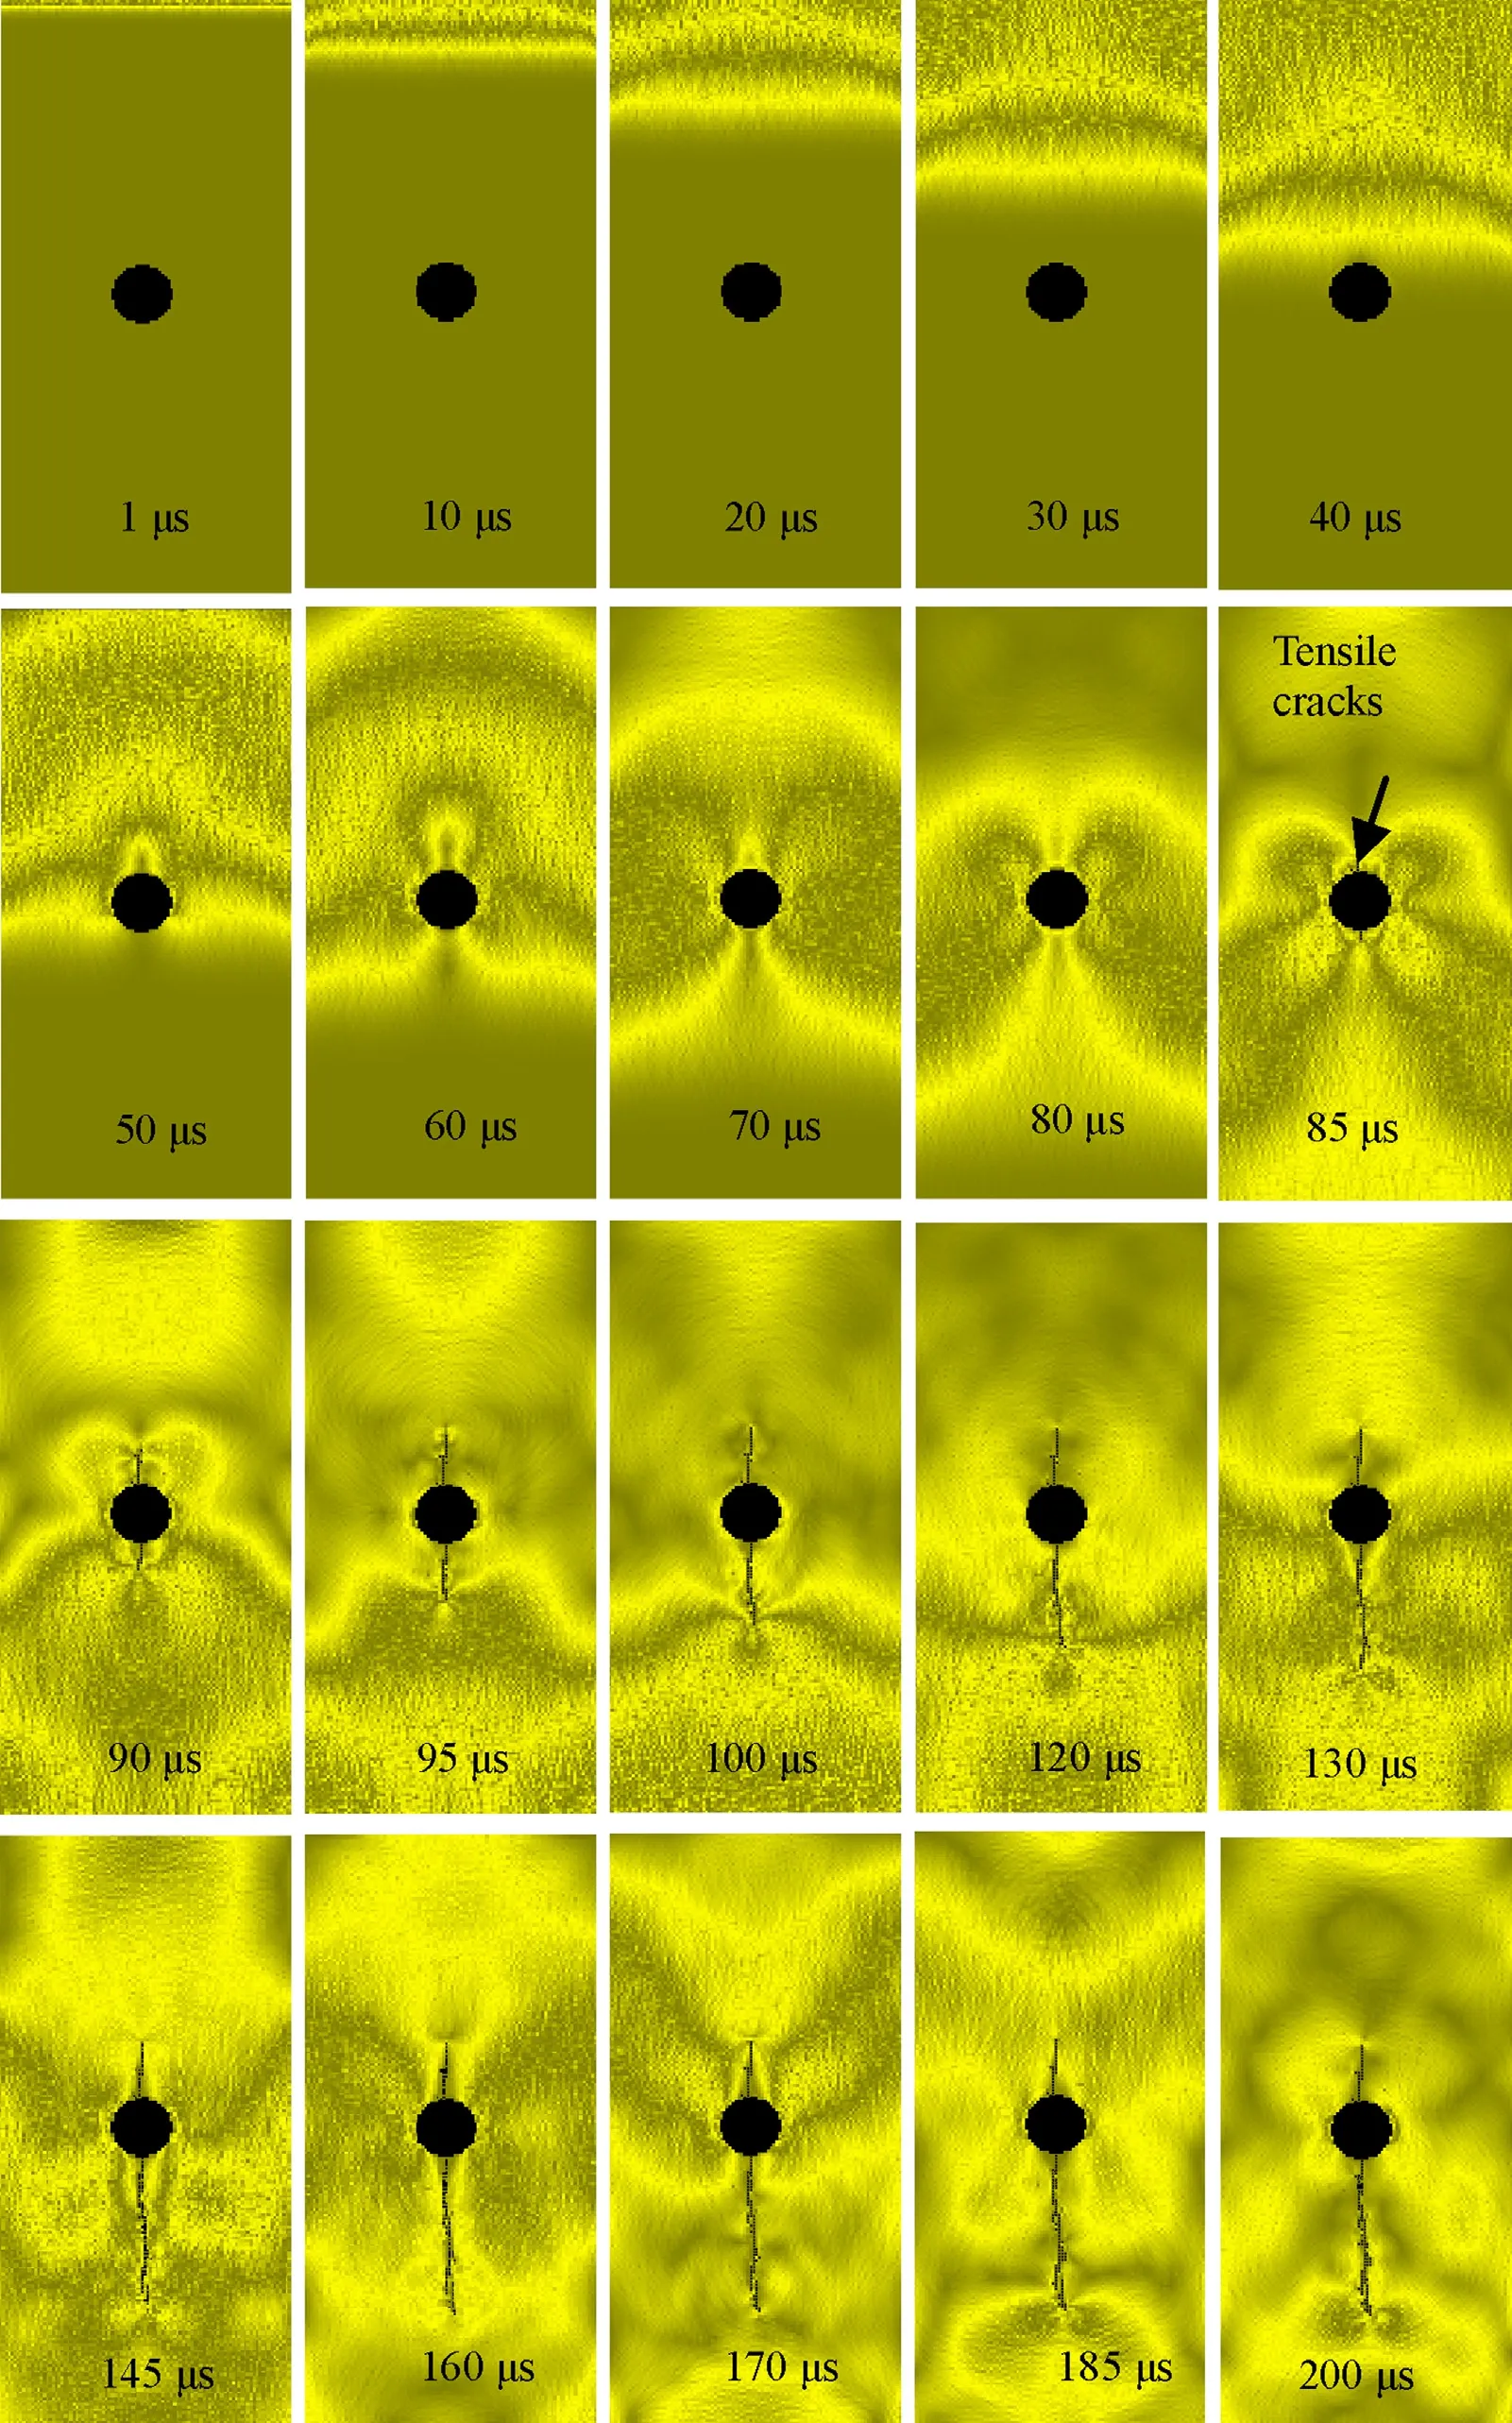
Fig.12.Numerically simulated failure process of the specimen with a single cavity subjected to vertical dynamic loading.
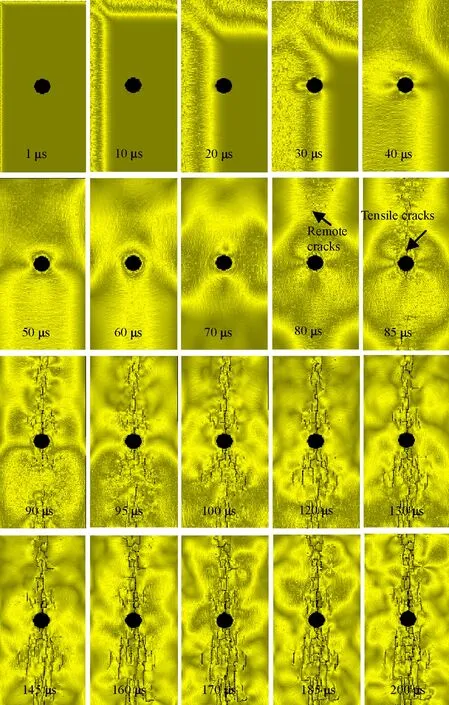
Fig.13.Numerically simulated failure process of specimen with a single cavity subjected to both vertical and horizontal dynamic loadings.
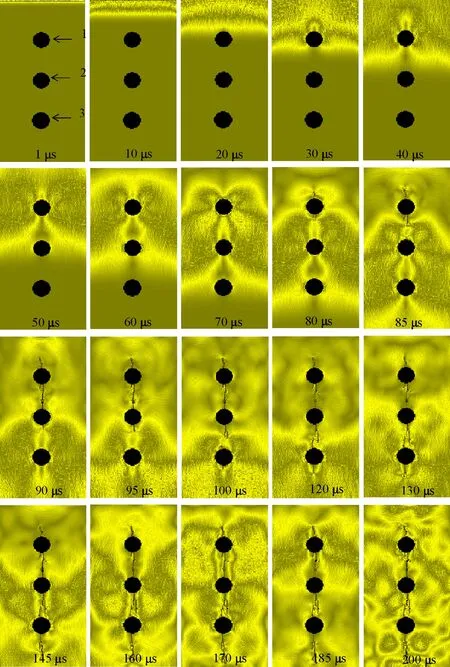
Fig.14.Numerically simulated failure process of the specimen with three vertically aligned cavities subjected to vertical dynamic loading.
Fig.15 shows the numerically simulated evolution of fractures from four cavities arrayed in diamond.With propagation of the vertical compressive stress wave from the top to the bottom of specimen,the primary tensile crack of Cavity 1 appeared at 40μs.The tensile cracks of Cavities 2 and 3 were both initiated at 50μs.The tensile crack of Cavity 4 appeared at 60μs.In addition,the tensile cracks of Cavities 1 and 4 became coalescent at 100μs.At this time,the compressive stress wave began to reflect and the tensile crack from the top crown of Cavity 1 started to propagate and divide into 3 cracks.The left crack propagated and bent to the left,while the middle and right cracks propagated and bent to the right(140μs).Meanwhile,the horizontal cracks initiated from Cavities 2,3and4.The horizontal cracks propagated and coalesced with the neighboring vertical tensile cracks.As a result,some sets of vertical main cracks occurred(200μs).Although the stress waves could influence the evolution of cracks from cavities,the cavities could also change the propagation of stress waves.Accordingly,the evolution of fractures from cavities was more complicated. An analysis for the effect of the cavity size taking the relationship between the wavelength and the frequency of stress waves into account is left for future work.
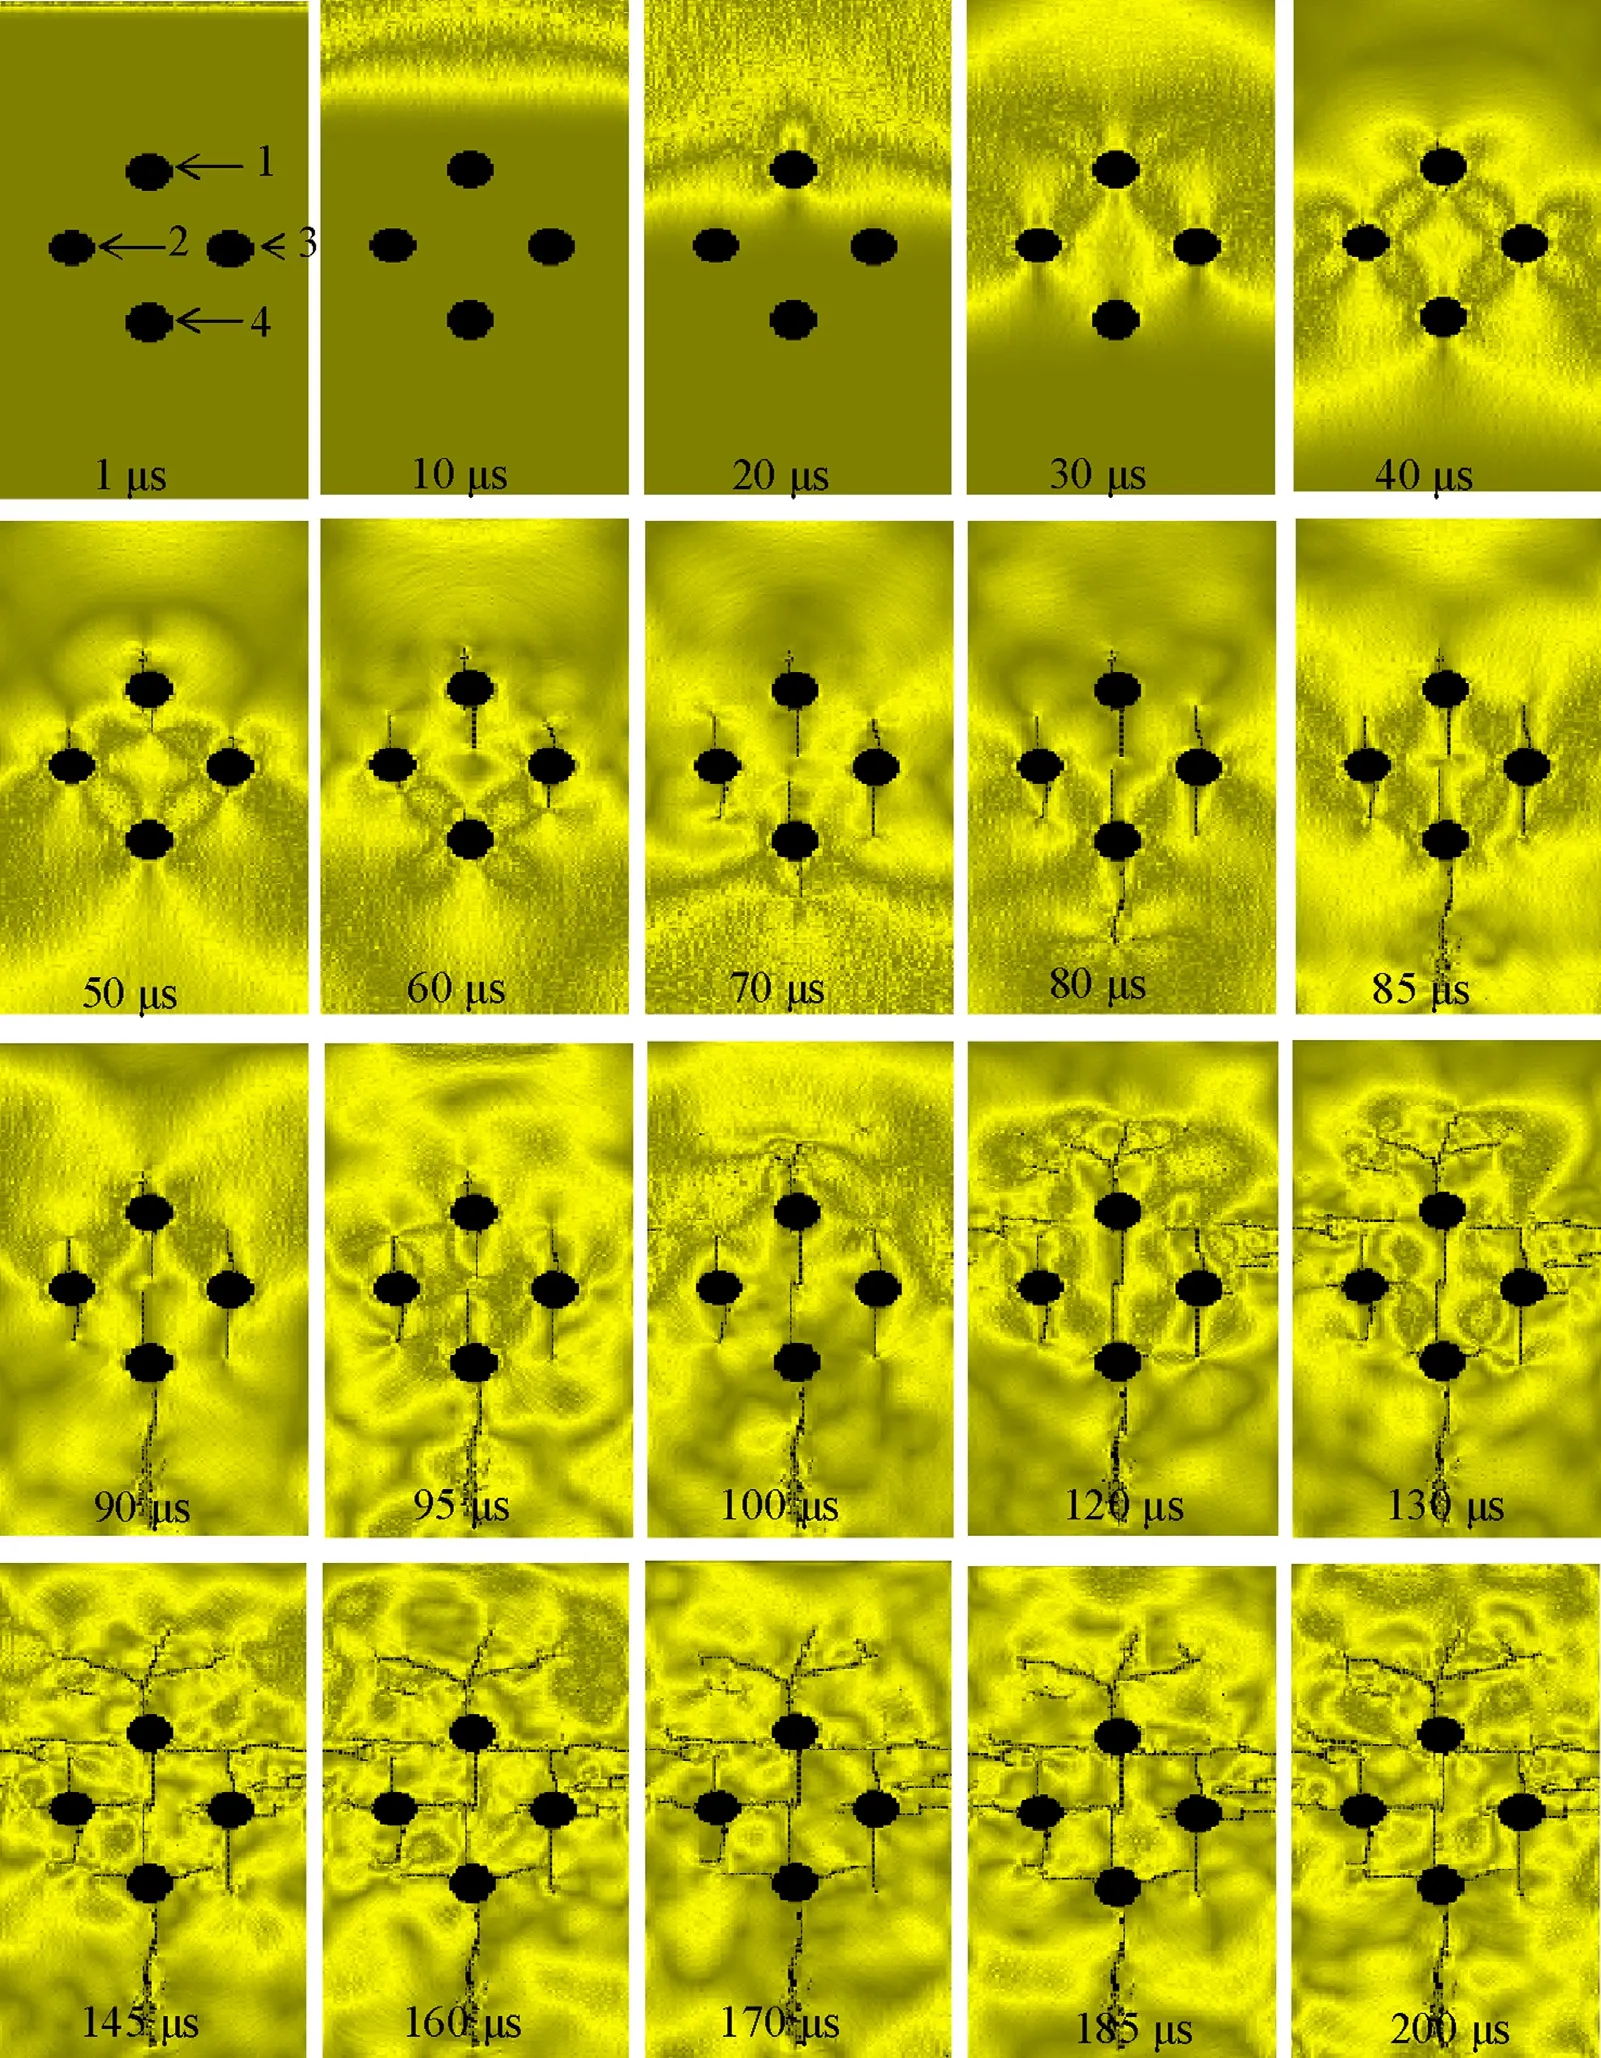
Fig.15.Numerically simulated failure process of specimen with four cavities arrayed in a diamond formation and subjected to vertical dynamic loading.
6.Conclusions
In this manuscript,RFPA2Dwas introduced briefly.By using RFPA2D,a stain-rate-sensitive model for rock failure based on damage mechanics was implemented to simulate the evolution of fractures from a single cavity and multiple cavities under static and dynamic loadings.The key conclusions are as follows:
(1)For models of a single cavity subjected to static loading,the numerically simulated results showed that fracture patterns consisted of nearby(primary)and remote fractures as well as tensile and shear fractures(Fig.1).Primary fractures formed at the center of the crown and invert due to high local tensions.Remote cracks formed in remote positions from the cavity,while shear fractures developed where high compressive stresses exist.
(2)The lateral compressive coefficient(K0)plays an important role in the evolution of fractures around a single cavity and in the stress-strain behavior of the specimens.When K0=0,the tensile fractures dominated;with increasing K0,shear fractures became more dominant.Both the peak strength and residual strength increased with increasing K0.
(3)Three cavities arrayed in inclined angles of 0°,30°,60°and 90°were numerically subjected to static loading.The numerically simulated fracture patterns of the three cavities agreed with experimental results.
(4)When the specimens with three or four cavities were subjected to dynamic vertical or horizontal compressive stress waves,numerical results indicate that both the compressive wave and tensile wave could influence the propagation of tensile cracks.In particular,the reflected wave accelerated the propagation of tensile cracks.
(5)Due to the existence of cavities and the propagation of fractures from cavities,the propagation of stress waves was modified.The numerical results represent the coupled effects between them.
Acknowledgements
This research is granted by many sponsors,namely the National Science Foundation(NSF)under Grant CMMI-0408390 and NSF CAREER Award CMMI-0644552,the American Chemical Society Petroleum Research Foundation under Grant PRF-44468-G9,National Natural Science Foundation of China under Grant No.51050110143,by Huoyingdong Educational Foundation under Grant No.114024,Jiangsu Natural Science Foundation under Grant No.SBK200910046,by Jiangsu Postdoctoral Foundation under Grant No.0901005C,and Shanxi,Anhui and Shandong Departments of Transportations,to which the authors are very grateful.
Carter B. Physical and numerical modeling of fracture in rock: with special emphasis on the potash mines of Saskatchewan.Winnipeg:Civil Eng.,Univ.of Manitoba;1992[Ph.D.thesis].
Carter B,Lajtal E,Petuhkov A.Primary and remote fracture around underground cavities.International Journal for Numerical and Analytical Method in Geomechanics 1991;15(1):21-40.
Chau KT,Zhu WC,Tang CA,Wu SZ.Numerical simulations of failure of brittle solids under dynamic impact using a new computer program—DIFAR. Key Engineering Materials 2004;261-263:239-44.
Ewy R,Cook NGW.Deformation and fracture around cylindrical openings in rock.Parts I and II.International Journal of Rock Mechanics and Mining Sciences and Geomechanics Abstracts 1990;27(5):387-427.
Fahrenthold EP.A continuum damage model for fracture of brittle solids under dynamic loading.Journal of Applied Mechanics ASME 1991;58(4):904-9.
Gay NC. Fracture growth around openings in large block of rock subjected to uniaxial and biaxial compression.International Journal of Rock Mechanics and Mining Sciences and Geomechanics Abstracts 1976;13(8):231-43.
Grady DE,Kipp ME.The micromechanics of impact fracture of rock.International Journal of Rock Mechanics and Mining Sciences and Geomechanics Abstracts 1979;16(5):293-302.
Hoek E,Brown ET.Underground excavations in rock.London:E&FN Spon;1980.p.105-6.
Huang CY,Subhash G,Vitton SJ.A dynamic damage growth model for uniaxial compressive response of rock aggregates.Mechanics of Materials 2002;34(5):267-77.
Ingraffea AR.Discrete fracture propagation in rock laboratory tests and finite element analysis.Boulder:University of Colorado;1997[Ph.D.thesis].
Lajtai E,Lajtai V.The collapse of cavities.International Journal of Rock Mechanics and Mining Sciences and Geomechanics Abstracts 1975;12(1):81-6.
Li HB,Zhao J,Li TJ,Yuan TJ,Yuan JX.Analytical simulation of the dynamic compressive strength of granite using the sliding crack model.International Journal of Numerical and Analytical Method in Geomechanics 2001;25(9):853-69.
Lin P.Brittle failure behavior of medium containing flaws and pores.Shenyang:Northeastern University;2002[in Chinese,Ph.D.thesis].
Liu LQ,Katsabanis PD.Development of a continuum damage model for blasting analysis.International Journal of Rock Mechanics and Mining Sciences 1997;34(2):217-31.
Souley M,Homand F,Pepa S,Hoxha D.Damage-induced permeability changes in granite:a case example at the URL in Canada.International Journal of Rock Mechanics and Mining Sciences 2001;38(2):297-310.
Suaris W,Shah SP.Constitutive model for dynamic loading of concrete.Journal of Structural Engineering 1985;111(3):563-76.
Tang CA.Numerical simulation of progressive rock failure and associated seismicity.International Journal of Rock Mechanics and Mining Sciences 1997;34(2):249-61.
Tang CA.A new approach to numerical method of modeling geological processes and rock engineering problems.Engineering Geology 1998;49(3/4):207-14.
Tang CA,Hudson JA,Xu XH.Rock failure instability and related aspects of earthquake mechanism.Beijing:China Coal Industry Publishing House;1993.p.30-53.
Tang CA,Kaiser PK.Numerical simulation of cumulative damage and seismic energy release during brittle rock failure—Part I:fundaments.International Journal of Rock Mechanics and Mining Sciences 1998;35(2):113-21.
Tang CA,Kou SQ.Crack propagation and coalescence in brittle materials under compression.Engineering Fracture Mechanics 1998;61(3/4):311-24.
Tang CA,Liu H,Lee PKK,Tsui Y,Tham LG.Numerical tests on micro-macro relationship of rock failure under uniaxial compression,part I:effect of heterogeneity.International Journal of Rock Mechanics and Mining Sciences 2000;37(4):555-69.
Tang CA,Tham LG,Wang SH,Liu H,Li WH.A numerical study of the influence of heterogeneity on the strength characterization of rock under uniaxial tension.Mechanics of Materials 2007;39(4):326-39.
Taylor LM, Chen EP, Kuszmaul JS. Microcrack-induced damage accumulation in brittle rock under dynamic loading.Computer Methods in Applied Mechanics and Engineering 1986;55(3):301-20.
Wang SY,Lam KC,Au SK,Tang CA,Zhu WC,Yang TH.Analytical and numerical study on the pillar rockburst mechanism. Rock Mechanics and Rock Engineering 2006;39(5):445-67.
Wang SY,Sloan SW,Liu HY,Tang CA.Numerical simulation of the rock fragmentation process induced by two drill bits subjected to static and dynamic(impact)loading.Rock Mechanics and Rock Engineering 2011;44(3):317-32.
Yang R,Bawden WF,Katsabanis PD.A new constitutive model for blast damage.International Journal of Rock Mechanics and Mining Sciences 1996;33(3):245-54.
Yazdchi M,Valliappan S,Zhang WH.Continuum model for dynamic damage evaluation of anisotropic brittle materials.International Journal of Numerical Method in Engineering 1996;39(9):1555-83.
Zhao J.Applicability of Mohr-Coulomb and Hoek-Brown strength criteria to the dynamic strength of brittle rock.International Journal of Rock Mechanics and Mining Sciences 2000;37(7):1115-21.
Zhao J,Li HB,Wu MB,Li TJ.Dynamic uniaxial compression tests on a granite.International Journal of Rock Mechanics and Mining Sciences 1999;36(2):273-7.
Zhu WC,Tang CA.Micromechanical model for simulating the fracture process of rock.Rock Mechanics and Rock Engineering 2004;37(1):25-56.
ZhuWC,Tang CA. Numerical simulation of Brazilian disk rock failure under static and dynamic loading.International Journal of Rock Mechanics and Mining Sciences 2006;43(2):236-52.
猜你喜欢
火炸药学报(2022年3期)2022-07-04
煤气与热力(2022年4期)2022-05-23
含能材料(2022年3期)2022-03-17
煤气与热力(2022年2期)2022-03-09
科技创新与应用(2022年3期)2022-02-18
防爆电机(2021年5期)2021-11-04
中学生数理化·高一版(2021年11期)2021-09-05
舰船科学技术(2021年12期)2021-03-29
舰船科学技术(2021年12期)2021-03-29
铁道通信信号(2020年1期)2020-09-21
 Journal of Rock Mechanics and Geotechnical Engineering2013年4期
- Journal of Rock Mechanics and Geotechnical Engineering的其它文章
- Shear strength criteria for rock,rock joints,rock fill and rock masses:Problems and some solutions
- Failure behavior of highly stressed rocks under quasi-static and intensive unloading conditions
- A comparative study on the application of various artificial neural networks to simultaneous prediction of rock fragmentation and backbreak