
Optimization of thermoacoustic refrigerator using response surface methodology*
2013-06-01 12:29:57HARIHARANSIVASHANMUGAM
水动力学研究与进展 B辑 2013年1期
HARIHARAN N. M., SIVASHANMUGAM P.
Department of Chemical Engineering, National Institute of Technology, Trichy 620 015, Tamilnadu, India, E-mail: nmhariharan@gmail.com
KASTHURIRENGAN S.
Centre for Cryogenic Technology, Indian Institute of Science, Bangalore 560 012, Karnataka, India
Optimization of thermoacoustic refrigerator using response surface methodology*
HARIHARAN N. M., SIVASHANMUGAM P.
Department of Chemical Engineering, National Institute of Technology, Trichy 620 015, Tamilnadu, India, E-mail: nmhariharan@gmail.com
KASTHURIRENGAN S.
Centre for Cryogenic Technology, Indian Institute of Science, Bangalore 560 012, Karnataka, India
(Received April 4, 2012, Revised August 25, 2012)
Thermoacoustic refrigerator (TAR) converts acoustic waves into heat without any moving parts. The study presented here aims to optimize the parameters like frequency, stack position, stack length, and plate spacing involving in designing TAR using the Response Surface Methodology (RSM). A mathematical model is developed using the RSM based on the results obtained from DeltaEC software. For desired temperature difference of 40 K, optimized parameters suggested by the RSM are the frequency 254 Hz, stack position 0.108 m, stack length 0.08 m, and plate spacing 0.0005 m. The experiments were conducted with optimized parameters and simulations were performed using the Design Environment for Low-amplitude ThermoAcoustic Energy Conversion (DeltaEC) which showed similar results.
Design Environment for Low-amplitude ThermoAcoustic Energy Conversion (DeltaEC), optimization, Response Surface Methodology (RSM), temperature difference, thermoacoustic refrigerator (TAR)
Introduction
Thermoacoustic refrigeration is a technology which uses large amplitude sound waves, generating hot or cold regions along a thermoacoustic stack without the need of environmentally destructive refrigerants. This cooling systems offer some advantages as compared with conventional systems. It uses environmental friendly working fluids such as helium, argon or nitrogen, no sliding seals or lubrication, no moving parts, enable low-cost continuous capacity control and relatively simple in construction. Thermoacoustic refrigerators (TAR) are systems which consume sound to generate cooling power. It mainly consists of a sound source (loudspeaker or vibrating diaphragm or a thermoacoustic primemover) attached to an acoustic resonator filled with gas, stack made of number of parallel plates and two heat exchangers placed at either ends of stack. The stack is the main component of thermoacoustic devices where the thermoacoustic phenomenon occurs, which is placed inside the resonator between pressure antinode and velocity antinode of the sound wave. The material selected for preparing stack should possess low thermal conductivity and higher heat capacity than gas, because the stack with a larger heat capacity is less affected by the temperature oscillations of the nearby gas and it allows the temperature gradient along the stack walls to remain steady. A material of low thermal conductivity should be chosen for the stack and resonator in order to prevent heat leaking from the hot side of the resonator back to the cold side and also it should be strong enough to withstand higher pressure.
An acoustic wave from an acoustic driver makes the gas resonant. As the gas oscillates back and forth, the standing sound wave creates a temperature difference along the length of the stack. This temperature change comes from compression and expansion of gas by the sound pressure and the rest is a consequence of heat transfer between gas and stack. The heat exchangers exchange heat with the surroundings at the cold and hot sides of the stack. The resonator part on the right hand of the stack cools down so that a heat exchanger is necessary for a good thermal contactbetween the cold side of the stack and the small portion of the resonator. The hot heat exchanger is necessary to remove the heat pumped by the stack and rejects heat to the surroundings.
The basic science, engineering concepts underlying thermoacoustic processes, and various parameters affecting the performance of TAR are well understood from Refs.[1-3]. Tu et al.[4]developed a network model to calculate the temperature differences generated across the heat-pump stack. The calculated results showed that the temperature differences are significantly affected by stack position, different oscillating pressure ratios and stack geometries of TAR. Zoontjens et al.[5]illustrates the optimization of inertance sections of thermoacoustic devices using Design Environment for Low-amplitude ThermoAcoustic Energy Conversion (DeltaEC) by varying individual parameters to determine optimal designs. Paek et al.[6]evaluated the performance of standing wave thermoacoustic cooler in terms of best possible COPRs for various temperature spans between hot-side and coldside stack-end temperatures using an optimization program based on thermoacoustic simulation program, DeltaEC. They found that the evaluation is satisfied only for TAR, not for cryocoolers and air conditioning applications. Akhavanbazaz et al.[7]investigated the performance of TAR by the impact of gas blockage with small and large thermal contact areas between stack and heat exchangers and also without heat exchangers. They found that heat exchanger with larger thermal contact area increases the heat exchange between the heat exchanger fluid and the stack, but it reduces the cooling power and increases the work input to the stack due to the increased gas blockage. Nsofor and Ali[8]investigated the performance of thermoacoustic refrigeration system in terms of reducing the heat loss by constructing the resonator with aluminium tubing lined with plastic tubing by varying the frequency, cooling load and pressure. Wu et al.[9]derived the relationship between cooling load and plate spacing by using constructal principle for parallel plate stacks. From the results obtained he concluded that plate spacing and number is selected based on the thickness of plate and frequency to obtain the maximum cooling load. Ke et al.[10]conducted a two-dimensional numerical simulation of thermoacoustic refrigerator driven at large amplitude using pressure correction algorithm for compressible flows by neglecting the limitations of traditional linear thermoacoustic model. They identified the optimized parameters of plate spacing, plate thickness and length of heat exchanger for TAR from the developed algorithm. The numerical model developed by Piccolo[11]integrated the thermoacoustic equations of the standard linear theory into an energy balance-based numerical calculus scheme. The effect of operation conditions and geometrical parameters on the heat exchanger performance in TAR was investigated and main conclusions for design of heat exchanger were drawn based on length, blockage ratio, gas and secondary fluid-side heat transfer coefficients. Berson et al.[12]developed a nonlinear one-dimensional model reling on relaxation time approximation to describe the thermal harmonics generated near the ends of a stack of TAR. These thermal harmonics near the ends of the stack have an impact on heat transport between the stack and the heatexchangers.
In order to reduce the number of experiments, optimization using the Response Surface Methodology (RSM) has been widely applied in many process operations, namely electrochemical treatment process[13], three phase fluidized beds[14]. The literature cited above reported the basic principles and performance improvements of thermoacoustic refrigerator and no literature is available on optimum design of TAR using RSM. Therefore, the main objective of the present study is to optimize the input parameters of standing wave TAR using RSM with air as a working fluid at 1 atm. The most important parameters influencing performance of TAR are frequency, stack position, stack length, and plate spacing. Using RSM the interaction effects of these parameters are investigated and presented. The experimental setup of TAR has been fabricated based on optimized parametric values generated from RSM for the desired output of 40 K temperature difference. Experiments and simulations using DeltaEC were performed and the results are presented in this paper.
1. Response surface methodology
RSM is a set of mathematical and statistical techniques that can be used to define the effect of independent variables, alone or in combination, on the output by generating a mathematical model. RSM is categorized into three different stages. They are identifying the independent parameters and their levels, verifying the model equation generated from the experimental design matrix with the practical experiments and plotting graphs. The accuracy of the developed model equation is increased due to the randomization of experimental errors of each runs and distribution of experimental points. It allows calculations to be made of the response at intermediate levels which were not experimentally studied and shows the direction to move if we wish to change the input levels so as to decrease or increase the response. The Central Composite Design (CCD), which is the standard method in RSM, was selected for the optimization of the parameters of TAR in the present study. 30 runs were performed in a totally random order with six replicates at the center points and a single run for each of the other combinations. The relationship between the response and the input is given by

Table 1 Range and levels of independent variables in CCD

wherey is the response,f is the unknown function of response,x1, x2,…,xkdenote the independent variables, also called natural variables,k is the number of the independent variables and finally εis the statistical error. The mathematical relationship between the input variables and the response can be approximated by the second order polynomial expressed as
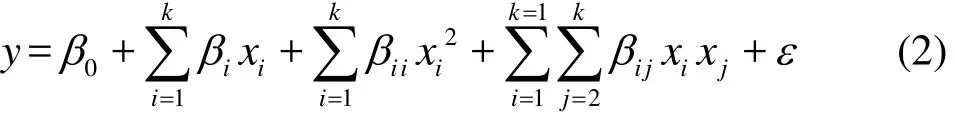
where β0,βi,βiiand βijare regression coefficients for the intercept, linear, quadratic and interaction coefficients, respectively, and xiand xjare the coded independent variables[15]. Data were analyzed using the response surface regression procedure and fitted to the second-order polynomial equation.
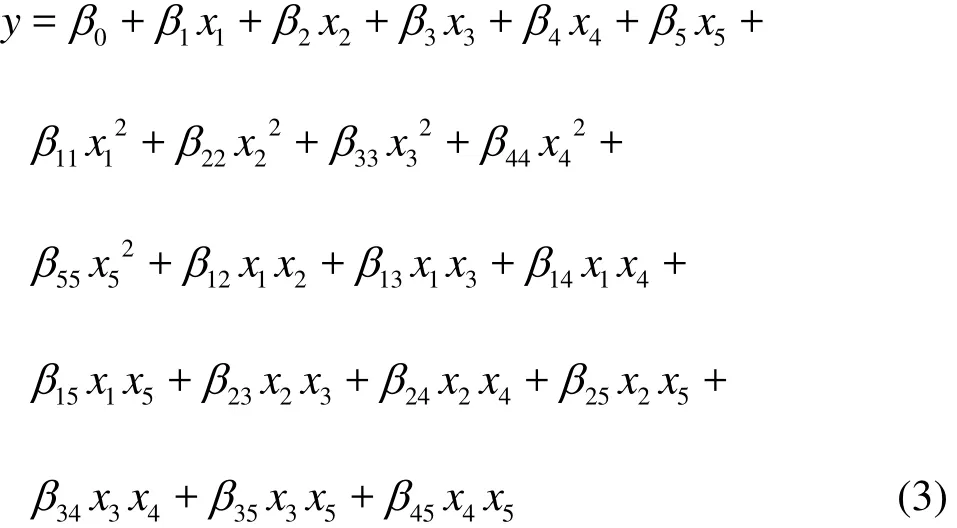
A four-factor and five-coded level CCD was selected for optimizing the parameters of TAR. This CCD design consists of the following parts: (1) a full factorial or fractional factorial design, (2) an additional design, often a star design in which experimental points are at a distance from its center, and (3) a central point. Using these levels, sufficient information could be generated to fit a second-order polynomial called “quadratic”. Considering the effects of main and interaction factors, the regression equation is expressed as
The optimization of temperature difference was carried out by four chosen independent process variables. The ranges and levels of input variables investigated in this study are given in Table 1.
In experimental design model, frequency (200 Hz-400 Hz), stack position (0.05 m-0.3 m), stack length (0.05 m-0.15 m) and spacing (0.0002 m-0.0006 m) were taken as independent input variables and temperature difference across the stack(ΔT) as response of the system are presented in Table 1. The parameters taken were studied at five different levels as –2, –1, 0, 1, 2. The input variables are expressed in different units and after the coding, the influence of inputs on the response can be compared. The experimental design matrix derived from the CCD model is shown in Table 2. First column of Table 2 shows run number, the next four columns represent the actual conditions of runs and the last two columns represent the output of the system.
2. Simulation using DeltaEC
DeltaEC is a computer program that acts as a powerful tool for modeling and designing the thermoacoustic and other one-dimensional acoustic apparatus for analyzing its performance. It numerically integrates the one-dimensional wave equation and other equations such as continuity and energy equations in gas or liquid based on acoustic approximation in geometries defined by the user, within each segment such as DUCT, HX, STKSLAB, COMPLIANCE, and INERTANCE. For example, the pressure and volumetric velocity of fluid is determined using Rott’s wave equation in thermoacoustic stack and lossy Webster horn equation in conical segments, temperature profile of fluid can be computed using Rott’s enthalpy equation in thermoacoustic stacks and wave equation in ducts. In DeltaEC platform, the segments are arranged to form one-dimensional path of acoustic propagation. The major segments required to construct a TAR model in DeltaEC are BEGIN, VSPEAKER, HX, STKSLAB, DUCT and SOFTEND. The working fluid and solid (stack) can be selected by user, which is available in DeltaEC simulation software. In our case, air and mylar is selected as the working fluid and solidrespectively. The diameter of resonant tube is 0.038 m, accordingly the area and perimeter of DUCT, HX, STKSLAB are calculated and substituted in DeltaEC. Also, the value of half plate spacing and half plate thickness is substituted for HX and STKSLAB according to the experimental design matrix. The pressure amplitude and temperature is fixed as guesses, which is the output of the system and the targets are real and imaginary part of specific impedance in SOFTEND segment. Since it is an open end TAR, the pressure is considered as 1 atm and air is taken as a working fluid, in the BEGIN statement and the segment SOFTENDis selected for simulating the model, where the acoustic velocity is not equal to zero. The experimental conditions of design matrix generated from RSM are substituted in DeltaEC to determine the output namely temperature difference and is presented in the fifth column of Table 2. Using this output value, RSM generated a mathematical model equation in terms of all input parameters is as follows
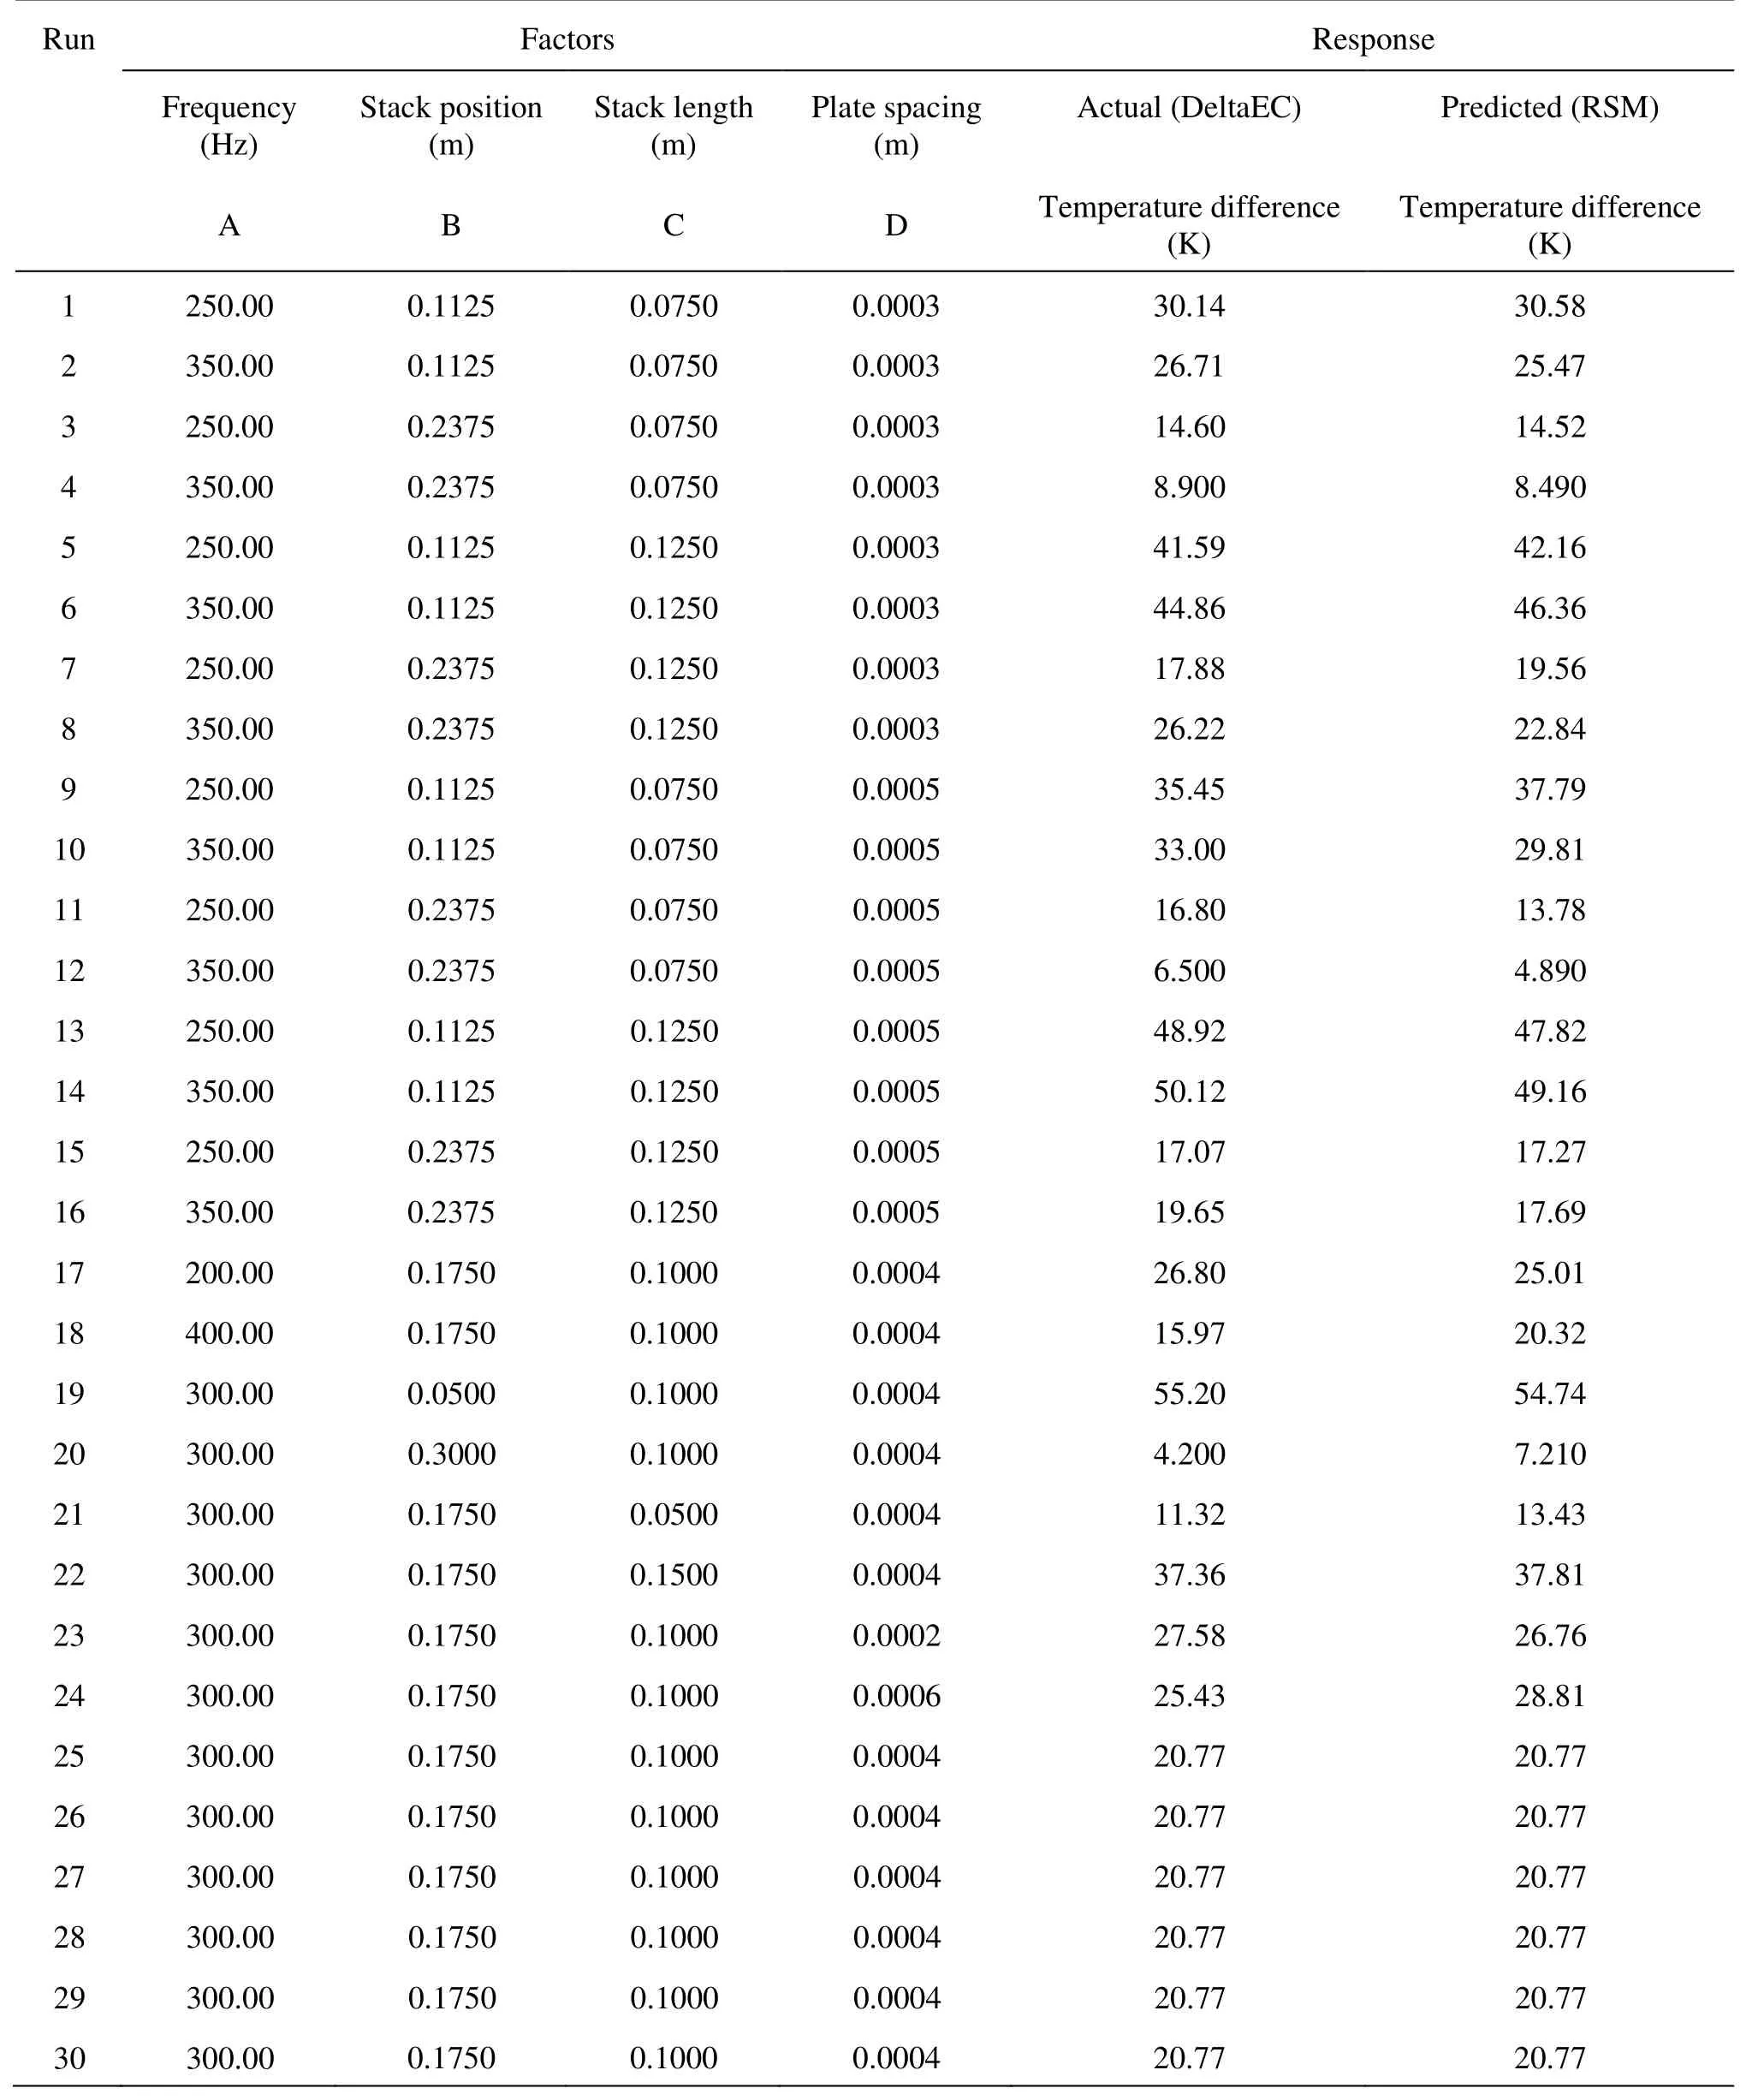
Table 2 Experimental design matrix and results for temperature difference
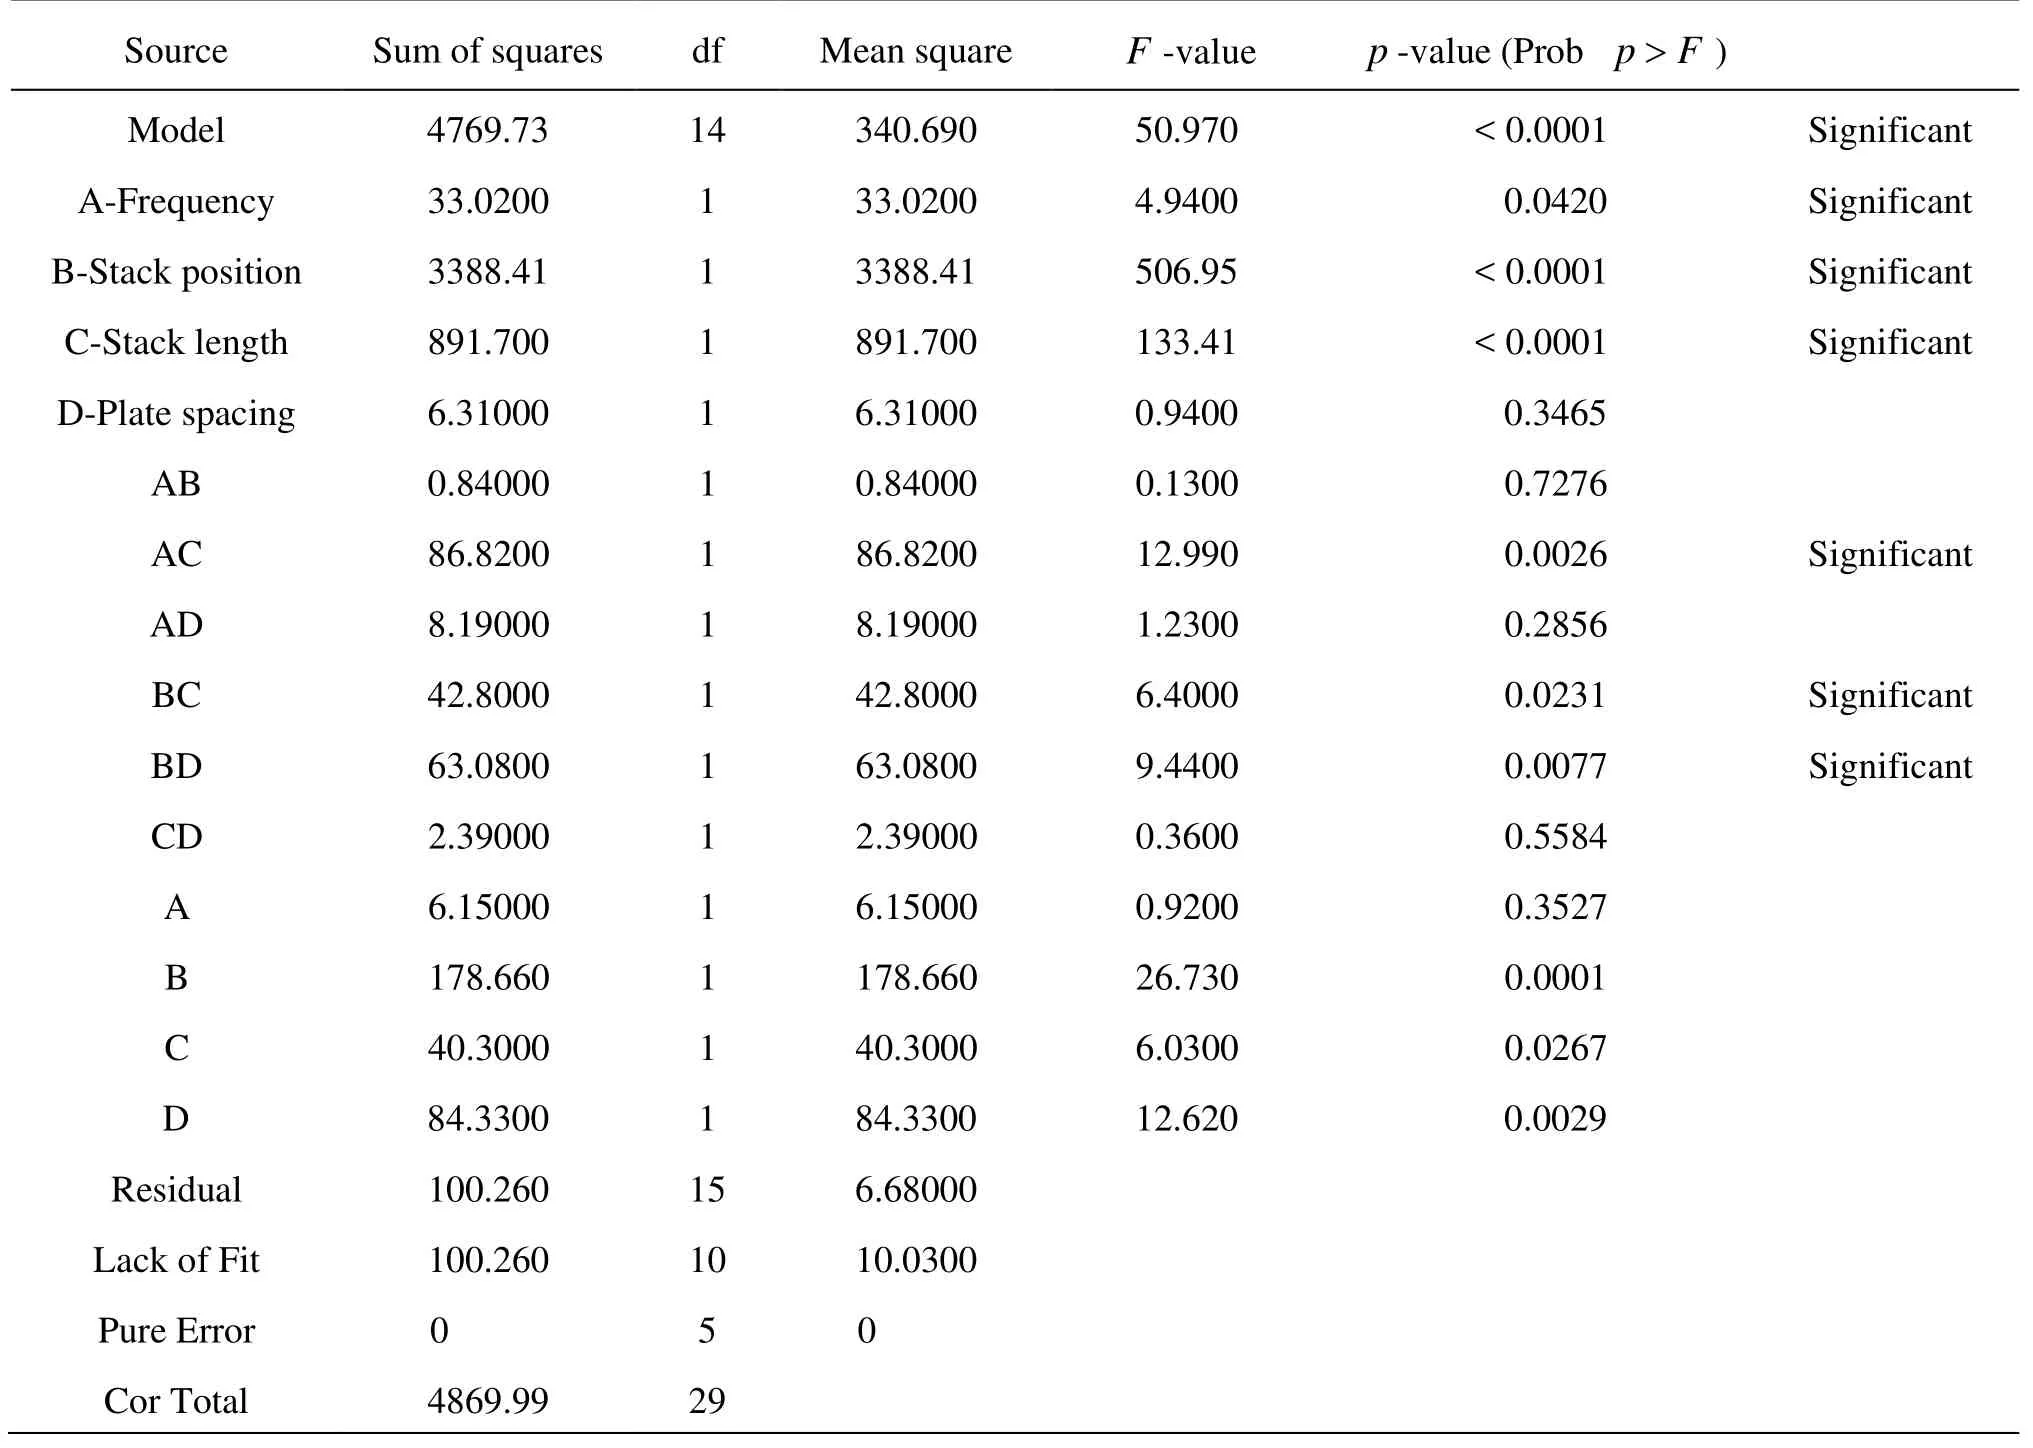
Table 3 ANOVA table for temperature difference

The value of temperature difference calculated from Eq.(4) is presented in the sixth column of Table 2.
3. Results and discussion of rsm
3.1 ANOVA analysis
ANOVA is required to test the significance and adequacy of the model. The ANOVA results of temperature difference across the stack are presented in Table 3, which indicates that the equation effectively represents the relationship between the response (temperature difference) and the significant input variables. The mean squares are obtained by dividing the sum of squares of each of the two sources of variation by the respective degrees of freedom. The Fisher variation ratio, i.e., theF -value, is calculated by dividing the mean square due to model variation by error variance. According to ANOVA (Table 3), the FisherF -value for the model is higher. The largeF -value indicates that most of the variation in the response can be explained by the regression equation. The ANOVA result for the temperature difference from TAR shows theF -value of 50.97, which implies that the terms in the model have a significant effect on the response. The associated p-value is used to estimate whether F is large enough to indicate statistical significance. The p -values lower than 0.05 indicates that the model is statistically significant at 95% of probability level. Any factor or interaction of factors with p<0.05 is significant. Values greater than 0.1000 indicate the model terms are not significant. The ANOVA table obtained from the quadratic model of responsetemperature difference shows that A, B, C, AC, BC, BD, B2, C2and D2are significant, which posses p-valus<0.05. The model gives coefficient of determination (R2)the value 0.9794, which is defined as the ratio of the explained variation to the total variation and an adjusted determination coefficient value (adj- R2)0.9602, which are nearer to unity and encourages a good association between the actual (DeltaEC) and the predicted (RSM) values. This means that regression model provides an excellent explanation of the relationship between the independent variables (factors) and response ΔT. The ANOVA analysis indicates a linear relationship between the responseY , and the input factors A, B and C, and quadratic relationship between the responseY , with that of B, C, D and the product of AC, BC, BD. “Adeq Precision” measures the signal to noise ratio. A ratio greater than 4 is desirable. For the present study, the ratio of signal to noise was found to be 27.27, which indicates adequate signal. Therefore, quadratic model can be used to navigate the design space.
3.2 Interaction effects of process parameters
The interaction effects of process parameters for temperature difference, which was measured across the stack at an open end TAR, were visualized through response surface plots and contour plots shown in Figs.1-6. In order to analyze the performance of cooling demonstrator, the frequency of the signal and the geometrical parameters were varied, and for each case the temperature difference across the stack was noted. It was observed that the stack side closer to the closed end of the tube posses lower temperature than the opposite end of the stack. Therefore the temperature difference across the stack will be ascertained by subtracting the top temperature from the bottom temperature. The maximum temperature difference obtained between the hot and cold ends was 55.20 K which was produced by the combination of the frequency 300 Hz, the stack position 0.05 m, and the stack length 0.1 m with the plate spacing 0.0004 m. The minimum temperature difference of 4.20 K was obtained in the above-mentioned conditions with the stack position of 0.3 m.
3.3 The combined effect of frequency and stack position
The combined effect of frequency and stack position on temperature difference is shown in Figs.1(a) and 1(b) in terms of 3-D surface plot and contour plot respectively. In case of open end TAR, the maximum temperature difference was obtained when the stack was placed nearer to the speaker with higher frequency. The increase in stack position means the stack is placed away from the acoustic driver, which implies that this position is nearer to the pressure node and velocity antinode. The temperature difference decreases with the increase in stack position, whereas it decreases with the increase in frequency up to 340 Hz and then it increases slightly. If the driver’s resonancefrequency is larger than the frequency of resonant tube, then the efficiency of the TAR decreases, leading to higher temperature difference.
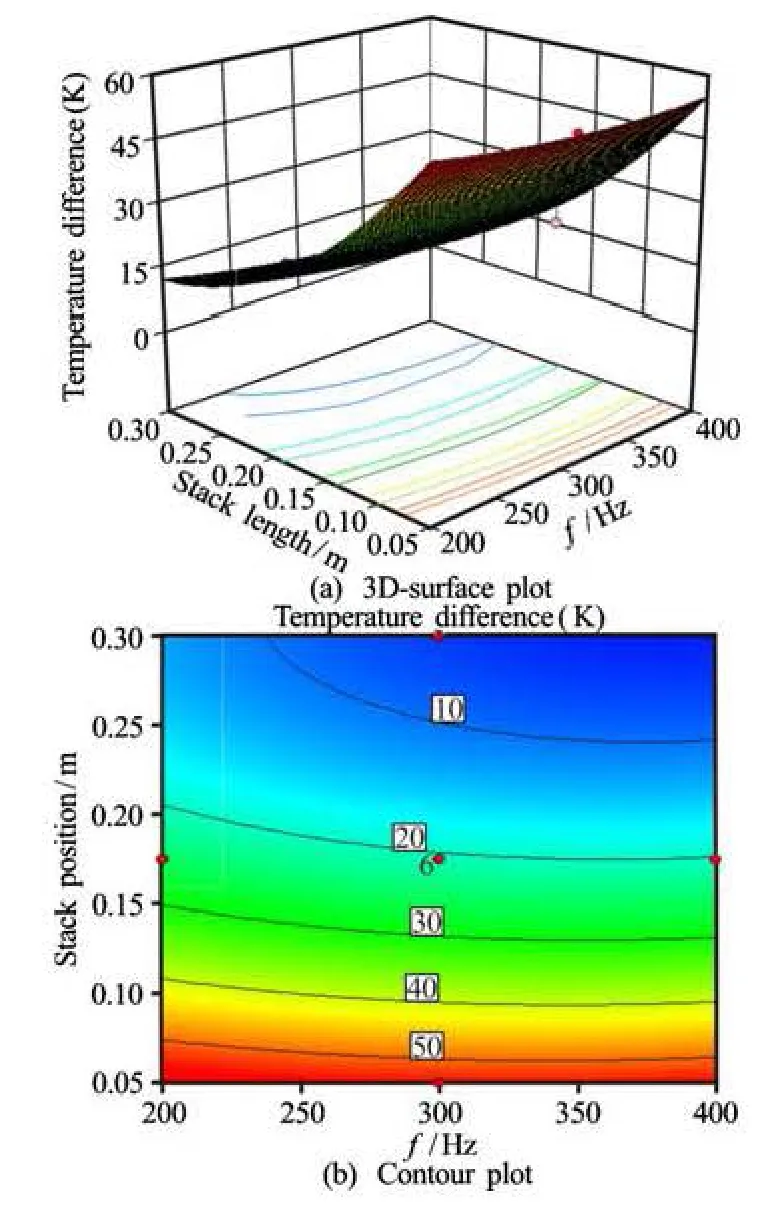
Fig.1 effect of frequency and stack position on temperature difference
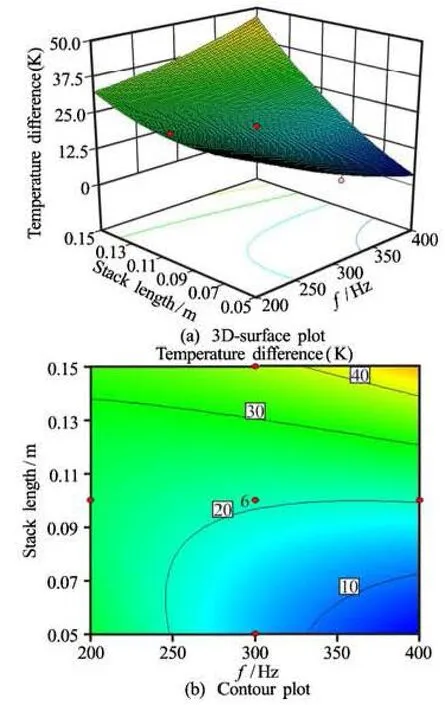
Fig.2 Effect of frequency and stack length on temperature
3.4 The combined effect of frequency and stack length
The frequency of the acoustic wave oscillates inside the resonator which significantly affects the velocity of gas particle inside the stack. The high frequency acoustic wave coerces the gas particles present inside the stack to accelerate which in turn increases the heat transfer rate that leads to better performance. The integrated effect of frequency and stack length on temperature difference is shown in Figs.2(a) and 2(b) in terms of 3-D plot and contour plot respectively. In this interaction effect, the temperature difference decreases with the increase in frequency and then it increases with the increase in stack length. The maximum temperature difference of 40 K was obtained at the frequency greater than 330 Hz with the utmost stack length.

Fig.3 Effect of frequency and plate spacing on temperature
3.5 The combined effect of frequency and plate spacing
The compound effect of frequency and plate spacing on temperature difference is shown in Figs.3(a) and 3(b) in terms of 3-D surface plot and contour plot respectively. In this mixed effect, the temperature difference decreases with the increase in frequency up to 310 Hz at the plate spacing of 0.00025 m and then it increases gradually with the increase in both plate spacing and frequency. The temperature difference is higher at minimum plate spacing, and then it decreases with the increase in plate spacing up to 0.00025 m. Further it increases again with increase in plate spacing.
“阿强——阿强——跟娘回家哦——”夜越发深了,张大娘游荡在一排排田垄上,她心里清楚,必须将迷失的阿强喊回家,而她喊得越久就有可能把阿强走丢的魂带回家。
The decrease in plate spacing means an increase in spiral which increases the stack perimeter. The increase in perimeter results in higher temperature difference. Once the plate spacing becomes too small, there is a reduction in thermoacoustic shuttle effect and the gas between the plates contributes to viscous shear.

Fig.4 Effect of stack position and stack length on temperature
3.6 The combined effect of stack position and stack length
The joined effect of stack position and stack length on temperature difference is shown in Figs.4(a) and 4(b) in terms of 3-D surface plot and contour plot respectively. In this interaction effect the temperature difference decreases with the increase in stack position, whereas it increases with the increase in stack length because the amount of heat transferred by the gas increases for higher stack length. When the stack is placed at a distance greater than 0.15 m from the closed end, the temperature difference is not more than 20 K though the stack length increases. Furthermore, increasing stack length, the maximum temperature difference is obtained when it is nearer to the acoustic source (pressure antinode). This statement confirms the improvement in efficiency of refrigerator. Conversely, the end closer to the acoustic source is also a velocity node, where the gas velocity is higher.The presence of stack at velocity node will diminish the flow of gas inside the stack. So the optimal stack position with defined stack length is needed to achieve the maximum temperature difference. From Fig.4(b), the stack length of 0.1 m is placed at the distance from 0.09 to 0.13 m to attain maximum temperature difference.

Fig.5 Effect of stack position and plate spacing on temperature
3.7 The combined effect of stack position and plate spacing
The thermal contact between the gas and stack should be neither too strong nor too weak. This imperfect contact can be achieved roughly by two to four times of thermal penetration depth. The stack spacing chosen for the present study is in the range prescribed by Tijani et al.[16]. The amalgamated effect of stack position and plate spacing on temperature difference is shown in Figs.5(a) and 5(b) in terms of 3-D surface plot and contour plot respectively. The temperature difference decreases with increase stack position, whereas it decreases initially with increase the plate spacing and then it increases with further increase in plate spacing. The thermoacoustic effect occurs only in the boundary layer of working fluid if its spacing is large, and most working fluids cannot participate in the thermoacoustic effect. If the spacing is too small, then the domination viscous dissipation weakens the thermoacoustic effect. The maximum temperature difference of 60 K was obtained when the stack is placed at a distance less than 0.08 m from the closed end with the plate spacing of 0.0005 m.

Fig.6 Effect of stack length and plate spacing on temperature
3.8 The combined effect of stack length and plate spacing
The unified effect of stack length and plate spacing on temperature difference is shown in Fig.6(a) and 6(b) in terms of 3-D surface plot and contour plot respectively. The temperature difference increases with increase in stack length whereas it decreases with increase in plate spacing upto 0.0004 m and then it increases further with increase in plate spacing.
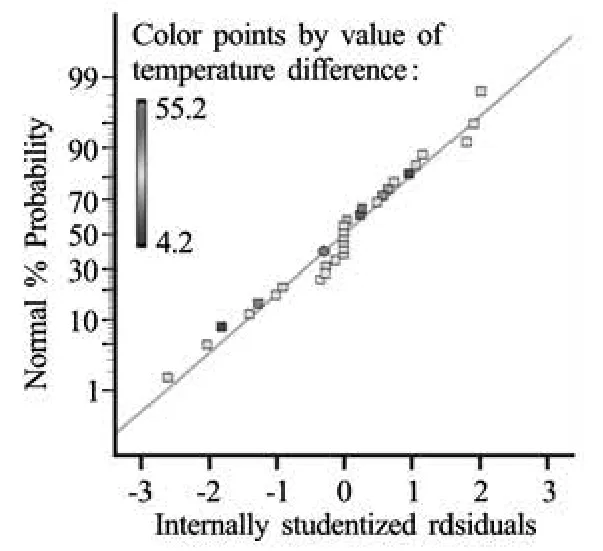
Fig.7 Normal probability plot for temperature
Data were also analyzed to check the normality of the residuals. Figure 7 represents the normal probability plot obtained from RSM. A pattern like “S-shaped” curve on diagonal line indicates that the transformation of the response may provide a better analysis and errors are normally distributed, as all thepoints lie close to the diagonal line. Figure 8 illustrates the graph between actual values obtained from DeltaEC and predicted values obtained from RSM. It is observed from the Fig.8 that there is a good agreement between actual and predicted values, since the points are distributed evenly on the diagonal line, which indicates that the quadratic model developed for temperature difference suits well.

Fig.8 Actual versus predicted values for temperature
4. Case study of optimized parameters

Fig.9 Pictorial representation of open end thermoacoustic refrigerator
4.1 Experimental setup and procedure
The experimental set up of open end standing wave thermoacoustic refrigerator is presented in Fig.9. The refrigerating system consists mainly of the resonator tube or resonator made of fiber reinforced plastic, the stack made of mylar, and the acoustic driver. The pressure is fixed as 1 atm, since the system is an open end TAR. A function generator with frequency range from 1 Hz to 1 MHz was used to produce the acoustic wave that was transmitted to the amplifier. Then the amplified acoustic wave is transferred to the 250 W acoustic driver (loud speaker) which powers the thermoacoustic system. The resonator of 0.5 m length and 0.038 m inner diameter of fiber reinforced plastic has been constructed and it was attached to the acoustic driver by a wooden board. The stack used for the experimental setup is fabricated by rolling a mylar sheet of thickness 0.0001 m as a spiral stack with the plate spacing of 0.0005 m. The length of the stack was 0.08 m and placed at a distance of 0.108 m from the closed end (pressure antinode). Figure 9 shows the locations of thermocouples at the either ends of the stack. The thermocouples installed over the system were capable of measuring temperature up to 573 K. Experimental uncertainty analysis was made using the Coleman and Steele method[17]. The uncertainty for thermocouple was estimated as a maximum of 0.78%. The uncertainty for thickness and length of the stack was estimated as 2% and 1% respectively. Once the system was switched on, the desired frequency of 254 Hz was set and the acoustic wave from the loudspeaker forces the working gas inside the resonator to interact with the spiral from the acoustic driver which was placed in the region of acoustic wave propagation and the temperature difference across the stack was observed using the thermocouples mounted on both the ends of the stack. Figure 10 shows the cross sectional view of the stack.
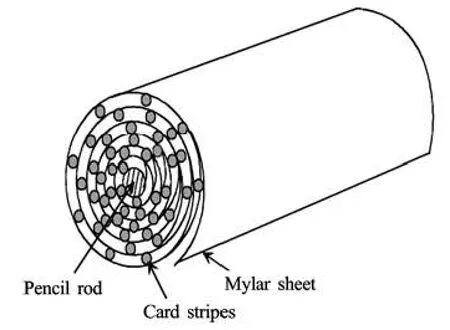
Fig.10 Cross sectional view of the stack
4.2 Experimental results and discussion
Experiment was conducted to examine the temperature difference across the stack in the system under given optimized condition. The temperature of the zone below the stack was found to be decreased whereas the temperature at the other end (above the stack) was increased. It was observed from experiment to start with that the temperature was varied at both the ends at the beginning and then stabilized with
time. After stabilization, the hot end of the temperature was increased up to 323 K and the cold end of the temperature was decreased up to 287 K with the temperature difference of 36 K. The optimized input values obtained from RSM was also fed in simulation DeltaEC software to get the appropriate temperature difference which was found to be 38.6 K and is given in Table 4. From Table 4, it is observed that the experimental and DeltaEC results of temperature difference are closer to the desired target value (40 K) of RSM, indicating the RSM approach working well for optimizing TAR.
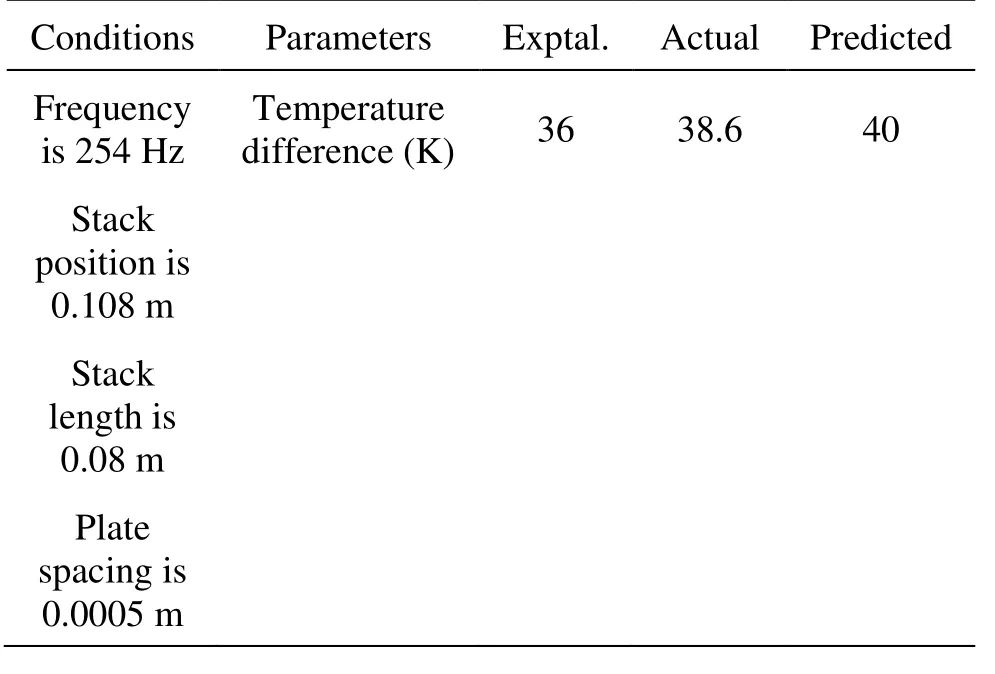
Table 4 Comparison of exptal, actual and predicted values
5. Conclusions
(1) Using thw RSM, the effect of parameters like frequency, stack position, stack length and plate spacing on the performance of TAR, in terms of temperature difference has investigated and the parameters optimized.
(2) From the developed RSM model, the interaction between the process parameters and the response, i.e., temperature difference, is examined and also it is verified using ANOVA analysis.
(3) TheF test,prob>F , the Adeq precision values from the ANOVA analysis shows that the quadratic model generated in the RSM for the response of TAR is significant. From the ANOVA results, it is found that the factors frequency, stack position and stack length are mainly influencing the performance of TAR, which is also confirmed by p-values.
(4) From the above discussions, it is found that geometrical variables chosen for the present investigation on the performance of TAR is inter-dependant. When single factors are considered, the temperature difference decreases with the increase in stack position and frequency, whereas it increases with the increase in stack length. In case of plate spacing, the temperature difference decreases initially up to 0.00035 m and then it increases with the increase in plate spacing.
(5) The present work can also be extended by assuming the pressure of working fluid as one of the factors (process parameter) in the RSM and the experimental design matrix can be gained based on the number of factors which in turn increases the experimental runs.
(6) Experimental and simulation studies are performed for the optimized RSM generated values of frequency, stack position, stack length, and plate spacing for the desired temperature difference of 40 K and their results exhibit similar performance.
Acknowledgements
This project was financially supported by student research fund of National Institute of Technology, Tiruchirapalli–620 015, India.
[1] TIJANI M. E. H., ZEEGERS J. C. H. and De WAELE A. T. A. M. Design of thermoacoustic refrigerators[J].Cryogenics,2002, 42(1): 49-57.
[2] SAKAMOTO S., WATANABE Y. The experimental studies of thermoacoustic cooler[J].Ultrasonics,2004, 42(1-9): 53-56.
[3] ZINK F., VIPPERMAN J. S., SCHAEFER L. A. Environmental motivation to switch to thermoacoustic refrigeration[J].Applied Thermal Engineering,2010, 30(2-3): 119-126.
[4] TU Q., CHEN Z. J. and LIU J. X. et al. Numerical simulation of loudspeaker-driven thermoacoustic refrigerator[C].Proceedings of the Twentieth International Cryogenic Engineering Conference (ICEC 20).Beijing, China, 2005.
[5] ZOONTJENS L., HOWARD C. Q. and ZANDER A. C. et al. Modeling and optimization of acoustic inertance segments for thermoacoustic devices[C].First Australasian Acoustical Societies’Conference: Acoustics 2006: Noise of Progress, Clearwater Resort.Christchurch, New Zealand, 2006, 435-441.
[6] PAEK I., BRAUN J. E. and MONGEAU L. Evaluation of standing-wave thermoacoustic cycles for cooling applications[J].International Journal of Refrigera-tion,2007, 30(6): 1059-1071.
[7] AKHAVANBAZAZ M., KAMRAN SIDDIQUI M. H. and BHAT R. B. The impact of gas blockage on the performance of a thermoacoustic refrigerator[J].Experimental Thermal and Fluid Science,2007, 32(1): 231-239.
[8] NSOFOR E. C., ALI A. Experimental study on performance of thermoacoustic refrigerating system[J].App-lied Thermal Engineering,2009, 29(13): 2672-2679.
[9] WU F., CHEN L. and SHU A. et al. Constructal design of stack filled with parallel plates in standing-wave thermo-acoustic cooler[J].Cryogenics,2009, 49(3-4): 107-111.
[10] KE H.-B., LIU Y.-W. and HE Y.-L. et al. Numerical simulation and parameter optimization of thermo-acoustic refrigerator driven at large amplitude[J].Cryoge-nics,2010, 50(1): 28-35.
[11] PICCOLO A. Numerical computation for parallel plate thermoacoustic heat exchangers in standing wave oscillatory flow[J].Internatinal Journal of Heat andMass Transfer,2011, 54(21-22): 4518-4530.
[12] BERSON A., POIGNAND G. and BLANC-BENON P. et al. Nonlinear temperature field near the stack ends of a standing-wave thermoacoustic refrigerator[J].International Journal of Heat and Mass Transfer,2011, 54(21-22): 4730-4735.
[13] THAKUR C., SRIVASTAVA V. C. and MALL I. D. Electrochemical treatment of a distillery wastewater: Parametric and residue disposal study[J].ChemicalEngineering Journal,2009, 148(2-3): 496-505.
[14]SIVALINGAM A., HARIHARAN N. M. and KANNADASAN T. et al. Mass transfer studies in three-phase fluidized bed using response surface method[J].Chemical and Biochemical Engineering Quarterly,2011, 25(2): 171-179.
[15] HARIHARAN N. M., SIVASHANMUGAM P. and KASTHURIRENGAN S. Optimization of thermoacoustic primemover using response surface methodology[J].HVAC&R Research,2012, 18(5): 890-903.
[16] TIJANI M. E. H., ZEEGERS J. C. H. and De WAELE A. T. A. M. The optimal stack spacing for thermoacoustic refrigeration[J].Journal of the Acoustical SocietyAmerica,2002, 112(1): 128-133.
[17] COLEMAN H. W., STEELE W. G.Experimentation and uncertainty analysis for engineers[M]. Second Edition, New York: Wiley and Sons, 1989, 189-199.
10.1016/S1001-6058(13)60340-6
* Biography: HARIHARAN N. M. (1986-), Male, Ph. D. Candidate
SIVASHANMUGAM P., E-mail: psiva@nitt.edu
猜你喜欢
学与玩(2022年2期)2022-05-03 09:46:45
辽河(2021年7期)2021-08-23 00:54:59
中国生殖健康(2020年2期)2021-01-18 02:51:12
音乐教育与创作(2020年9期)2021-01-04 01:01:22
——歌剧《田垄之上》 选曲
音乐教育与创作(2020年8期)2020-09-17 05:03:36
幽默大师(2020年6期)2020-06-22 08:24:38
幽默大师(2020年4期)2020-04-13 14:10:16
幽默大师(2020年3期)2020-04-01 12:01:10
中国生殖健康(2018年2期)2018-11-06 07:10:32
科技知识动漫(2017年8期)2017-08-09 20:24:30

- 水动力学研究与进展 B辑的其它文章
- Critical size effect of sand particles on cavitation damage*
- Hydrodynamic performance of flexible risers subject to vortex-induced vibrations*
- Numerical simulation of rolling for 3-D ship with forward speed and nonlinear damping analysis*
- A new methodology for the CFD uncertainty analysis*
- The direct numerical simulation of pipe flow*
- Experimental study and finite element analysis of wind-induced vibration of modal car based on fluid-structure interaction*