Investigation of Sea Wave and Structure Modelling for Fatigue Assessment of Offshore Structures
JIA Jun-bo
(Aker Solutions,Bergen,Norway)
1 Introduction
Offshore structures are designed to resist continued wave loading which may lead to significant fatigue damage on individual structural members,and other types of loads due to winds,severe storms,corrosion,fire and explosion,etc.The fatigue life is one of the major concerns for the offshore tubular structures since the utilization of tubular members give rise to significantly high stress concentrations in the joints.Most steel offshore support structures are three dimensional frames fabricated from tubular steel members.This gives the best compromise in satisfying the requirements of low drag coefficients,high buoyancy and high strength to weight ratio[1].The most common used offshore structure is jacket structure,which comprises a prefabricated steel support structure(jacket)extended from the sea bed(connected with piles at sea bed)to some height above the water surface level,and a steel deck(topside)on the top of the jacket.It is reported by Stacey and Sharp[2]that fatigue cracking has been a principal cause of damage to North Sea structure and in service experience has shown that there have been several incidents of fatigue cracking requiring repair.In some cases,fatigue cracking has led to member severance,resulting in a consequent reduction in overall structural integrity.
By modelling a rotationally symmetric structure as a vertical circular cylinder,Vugts[3]studied the influence of the wave directions on the fatigue life of this simplified cylinder.He shows that the reduction in fatigue damage is 50% for unidirectional seas and 40% for spread sea conditions.However,for a realistic structure and data of wave environment,this conclusion is unlikely to be representive.
Note the fact that the frequency domain analysis can hardly properly take the non-linear load effects induced from the Morison’s equation,the variation of the water surface causing the intermittency of the wave loading on members in the splash zone,and large structural deformation into account,and also because the power spectrum of the critical stress due to the dynamic wave loading may not be narrow banded,to overcome these challenges,the current author has proposed a calculation procedure for assessing the fatigue damage for fixed offshore structures[4].Based on this procedure,and by adopting different number of inputs at discrete frequency of the wave spectrum,and making the frequency spacing with uneven distance,the effects of wave directions,parameters in the wave spectrum,the significant wave height,and the modal wave period on the fatigue damage of a jacket structure are identified.Furthermore,a statistical investigation of the local response has been performed and its characteristics influenced by the adverseness of sea states are elaborated.
2 Description of the adopted wave spectrum
The wave environment comprises sea states,which are random processes described by random wave model using wave spectrum.The model may be visualized as the summation of a large number of periodic wavelets,each of these wavelets has its own direction,amplitude and frequency.
In shallow waters with limited fetch and for extreme wave conditions,JONSWAP spectrum developed by the Joint North Sea Wave Project can be adopted.It is expressed by enhancing the peak of the PM spectrum as shown in Eq(1):


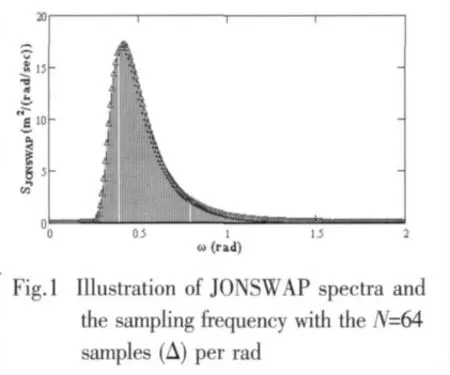
By discretising the wave energy spectrum into N number of componentsΔS(ωn)between ωn-Δω/2 andωn+Δω/2 as shown in Fig.1,the relation between the wave energy spectrum and the amplitude of wave components can be approximated as Eq.(3):

where n=1,2,…,N.
Provided thatΔωis constant,the wave elevation will be repeated with a period of 2π/Δω.In order to increase this period,a large number of discrete frequencies as well as making the frequency spacing with uneven distances should be used as the energy inputs to calculate the wave loads.In the current study,after setting up the number of the discrete frequencies N,the uneven distance is decided based on the criteria that each number of componentΔS(ωn)has the same zero spectral moments(area under the energy spectrum for each number of component).This implies that more sample values are chosen near the peak frequency region than those far from the peak frequency.This is generally preferred.However,the main drawbacks of this is that if the number of discrete frequencies N is not high,one may miss very important contribution of the wave energy spectrum tail in the high modal wave period range.In the current study,the window of the wave energy spectrum is chosen between the frequency of 0.05 Hz to 0.33 Hz.
3 Analysis model
3.1 Structural modelling
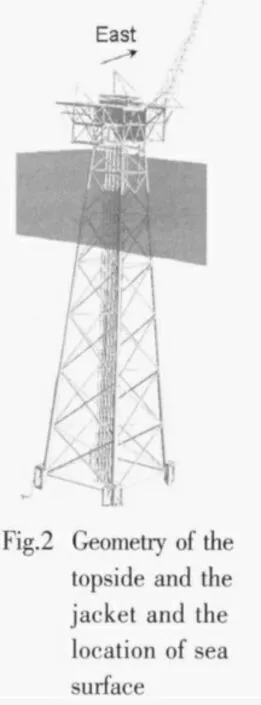
The prototype jacket structure considered in the current study is Oseberg East operated by StatoilHydro.It is located in North Sea and lies 25 kilometers northeast of the Oseberg Field Center.The structure comprises both the topside and the jacket with four legs as shown in Fig.2.The elevation(EL)of the jacket part is from EL-156.4 m to EL+22 m.The weight for the topside and jacket is 12 904 tonnes and 7 100 tonnes,respectively.The flare tower towards the direction of the East.In total 1 789 two node beam elements were used to model both the topside and the jacket.The structure is modelled as the material of steel with the Young’s modulus of 210 GPa,Poisson’s ratio of 0.3,and the density of 7 850 kg/m3.Lumped masses are modelled on the topside to represent the weight of the equipment and other non-structural in stallations.The Rayleigh damping of the structure is set up by providing the relative damping of 1% for the modes at eigenfrequency of 0.1 Hz and 10 Hz,respectively.
For the fatigue analysis,it is required by NORSOK Standard N-004[5]that the structureto-ground connections may normally be simulated by linear stiffness matrices.And the matrices shall account for the correlation between the rotational and translational degrees of freedom,this may be important for proper calculation of fatigue damage in the lower part of the structure.Linear springs at sea bed are then modelled to simulate both the pile-soil stiffness and the conductor connection with the sea bed.
In the current study,the HHT-αmethod is adopted for direct time integration analysis.This method is a one parameter multi-step implicit method and it employs some sort of time averaging of the damping,stiffness and load term expressed by theα-parameter[6].The advantage of this method is that it introduces the numerical damping of higher frequency modes without degrading the accuracy.
3.2 Hydrodynamic coefficients
The hydrodynamic forces on a tubular component are calculated by Morison’s equation[7].In the current study,the hydrodynamic drag and inertia coefficients are used according to latest version of NORSOK N-003[8]as illustrated in Table 1.Note that compare with the original version of NORSOK Standard[9]released in 1999,the inertia coefficient for the latest version of NORSOK Standard[8]is significantly decreased while the drag coefficient is slightly increased.Since the fatigue of the jacket or jack-up structure is mainly influenced by the inertia dominated wave loads with small amplitude of wave height,the fatigue life according to the latest version of NORSOK may then be increased significantly compared with that of the original one[9].This change may have more influence on fixed offshore structures than on floaters.In addition,the flooded members and the water inside are specified in the model.

Tab.1 Hydrodynmaic drag and inertia coefficients used in the calculation
3.3 Wave modelling
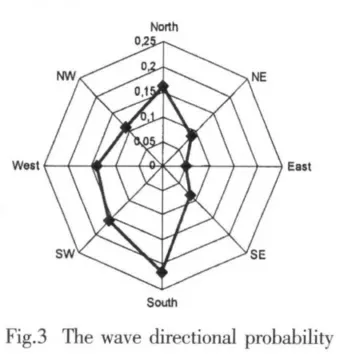
A design wave is described by the wave height,the modal wave period and direction.In the current study,the jacket is analysed for 22 sea states and 8 wave directions for each sea state.The probability for each sea state is shown in Table 2.Directional probability of the wave is illustrated in Fig.3.The total number of load cases is then 22×8=176.From Fig.3 it is observed that the most dominant wave directions with respect to the probability of occurrence are South,South West and North,while the directions of East,North East and South East show the least probability of occurrence.The JONSWAP spectrum is used to generate the wave energy input.The directional spreading(short wave crest)and the current are not taken into the account in the current modelling.
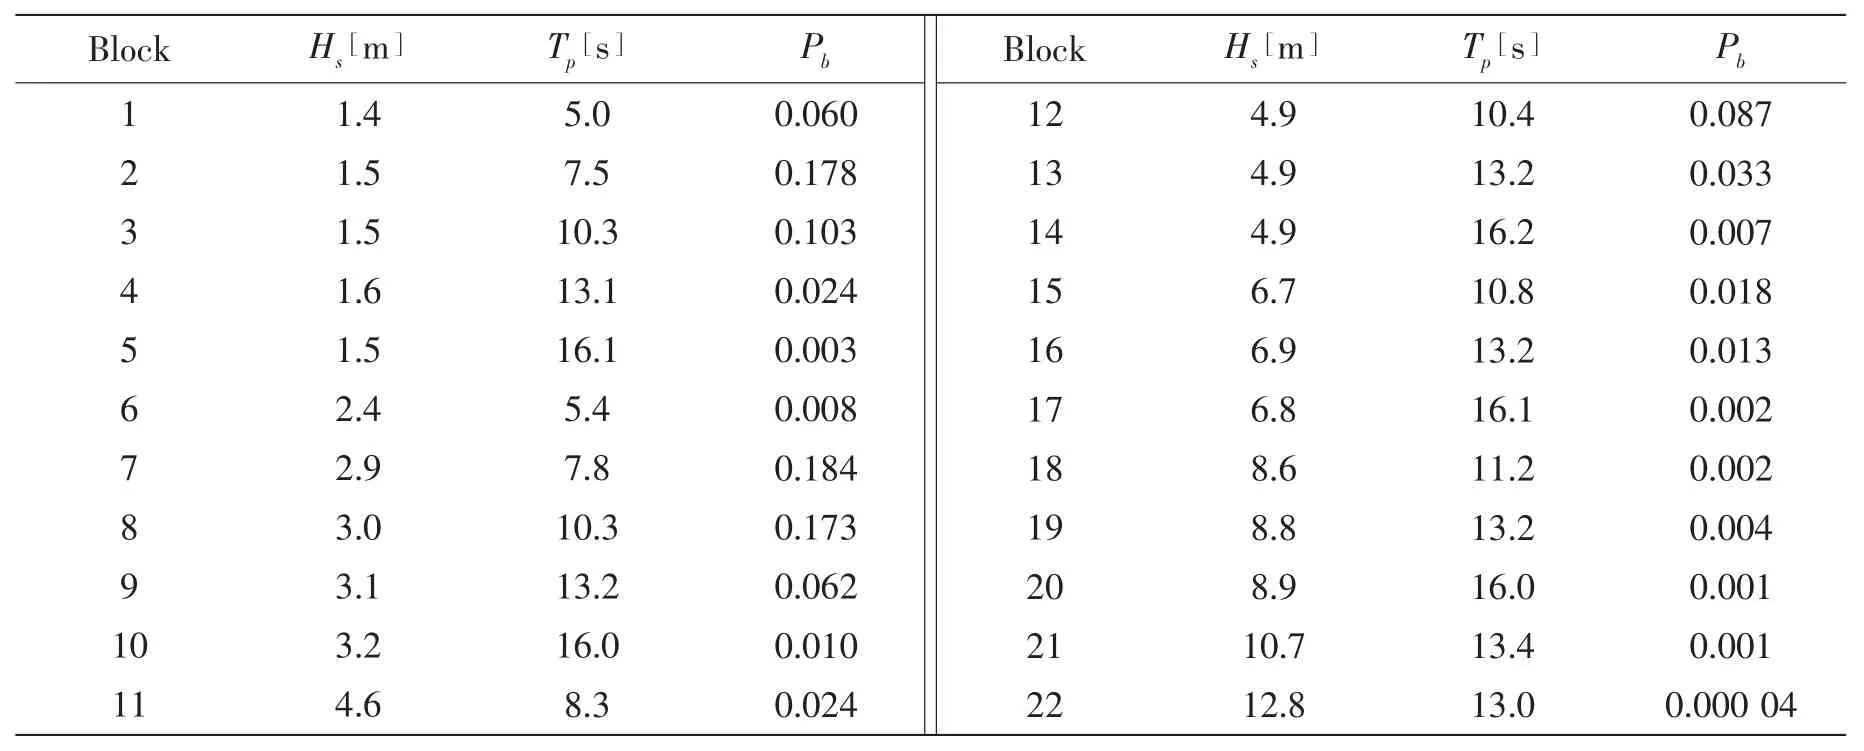
Tab.2 The probability of 22 sea states used in the fatigue analysis
3.4 Marine growth,splash zone,and buoyancy effect
Marine growth is a common designation for a surface coat on marine structures,caused by plants,animals and bacteria.It may cause increased hydrodynamic actions,increased weight and added mass,which may influence the hydrodynamic instability as a result of vortex shedding and possible corrosion effects[8].Table 3 shows the modelling of marine growth at different elevations on the jacket structure.The splash zone is defined to be between EL-5.0 m to+7.9 m.The buoyancy effect is calculated up to the sea level.

Tab.3 Marine growth profile data used in the modelling
4 Parameters for investigation
In the current study,the parametric influence on the fatigue damage of the jacket structure from(1)The directions of waves,(2)The values ofγin the JONASWAP wave spectrum,(3)The numbers of input(N)at discrete frequencies of the wave energy spectrum,(4)The time step length(Δt)in the dynamic simulation using the HHT-αtime integration algorithm,(5)The significant wave heightand(6)The modal wave period Tmare investigated.Table 4 shows the matrix of the parameters for investigation.As a basis for the parametric investigations,reference values forγ,N andΔt are set as 2,30,and 0.25 s,respectively.

Tab.4 Matrix of the parameters for investigation
5 Analysis procedure
The fatigue analysis is normally performed with the following procedures:(1)calculate the stress variations during the lifetime,(2)count the stress amplitudes using certain counting methods,(3)calculate the fatigue damage for each stress amplitude range according to the material data(S-N curves),and,(4)sum them up to estimate the total fatigue damage during the structure’s entire fatigue life.

The total fatigue damage is based on the nonlinear dynamic analyses of 22 sea states for one hour durations from 8 wave directions.In total 176 simulations are then carried out to calculate the total fatigue damage.The influence from the variation of theγvalue and the directional effects of waves are first studied.After identifying the dominant wave directions for the selected positions on the jacket structure,the influence from other parameters are further studied in the dominated wave direction.The FE program USFOS was used to carry out the dynamic analysis in the time domain.In each time step,the hydrodynamic forces are recalculated according to the updated structural deformation results.The code FATAL is adopted to count the stress amplitude cycle and calculate the fatigue damage.The analysis procedure is summarised below and the corresponding flow chart is illustrated in Fig.4.
6 Modal analysis
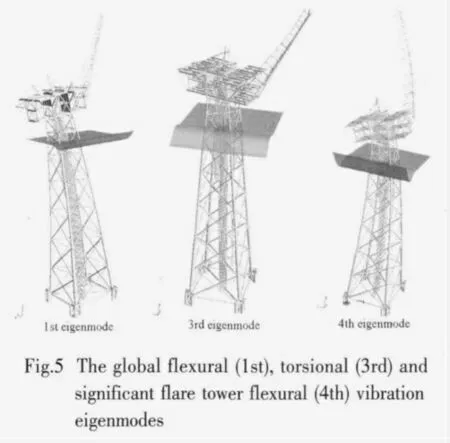
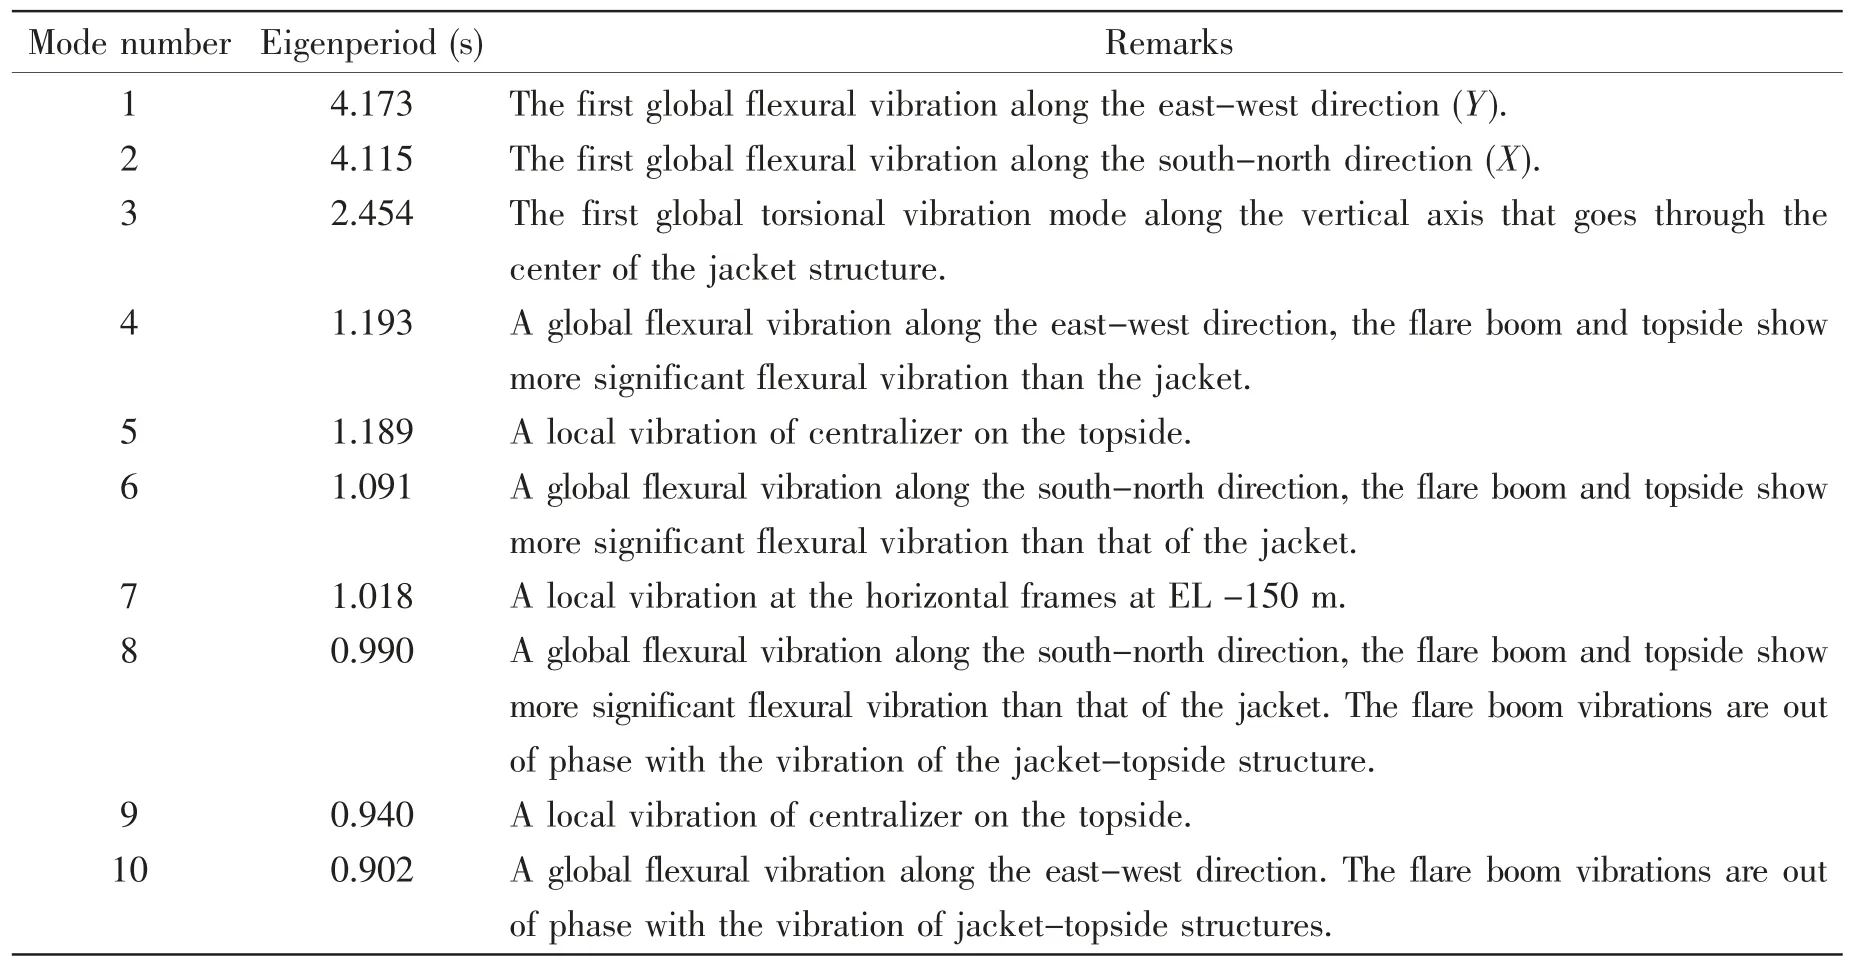
Table 5 shows the first ten eigenperiods of the jacket-topside-flare tower structure involving the influence from the hydrodynamic added masses.The description of each mode shape and some representive mode shapes are shown in Table 5 and Fig.5,respectively.It should be noted that the first two eigenperiods are very close to the low values of modal wave period.In addition,the structure also shows large vibrations near the water surface.The significant dynamic magnification responses are then expected when the structure encounters low period of waves.It is also noticed that the periods for the high order of eigenmodes are more closely spaced than that of the low order of eigenmodes.This may indicate redundancy of the structure.
Tab.5 First ten eigenperiods of the jacket-topside-flare tower structures(hydrodynamic added masses are included)
7 Calculation of the fatigue life
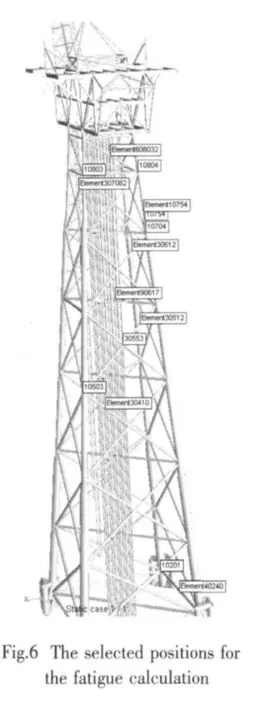
The fatigue life at 772 selected positions on the jacket members is calculated.Table 6 shows the calculated fatigue life at 8 selected positions(Fig.6)for the condition of N=30,Δt=0.25 s,withγ=2 or 4.1,respectively.It is found that the fatigue life for the condition ofγ=4.1 is mostly slightly higher than that ofγ=2.An exception is found on a leg joint with the node number 10 804,in which the fatigue life forγ=2 is higher than that ofγ=4.1.Note that the fatigue damage is proportional to the third power of the stress amplitude:a slightly different wave loading may give significantly different fatigue life.By investigating Table 6 it is also found that,generally,among the selected positions in the table,the fatigue life decreases with the decrease of the depth from the sea surface,and the most critical positions are mainly located at EL-11 m from the sea surface.

Tab.6 The fatigue life at selected positions for the condition ofγ=2 or 4.1,N=30,Δt=0.25 s with the new wave spectrum input
8 Influence from theγvalues and wave directions
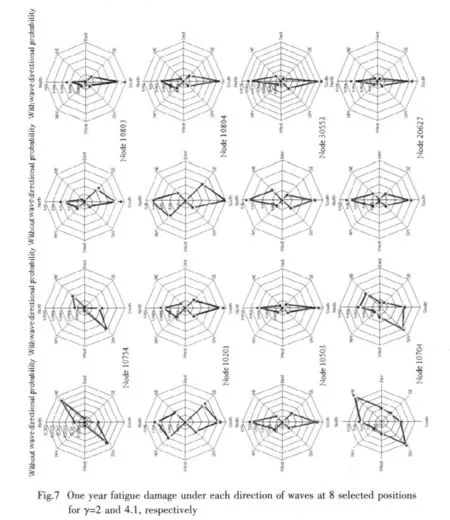
In order to identify the wave directional effect on the fatigue damage,the one year fatigue damage dominated under each direction of waves for the selected 8 positions is computed as shown in Fig.7.The left of each individual figure illustrates the one year fatigue damage under each individual wave direction without considering the directional wave probabilities(Fig.3).The right one indicates the one year fatigue damage by considering the directional wave probability of occurrence.For both two conditions described above,the fatigue damage at most of the selected positions is significantly influenced by the waves coming from the South.This may be mainly due to the fact that the waves from the south can most effectively excite the global flexural structural vibrations along the north-south direction.On positions at node 10754 and 10704,the waves from south-west direction contribute to the fatigue damage most significantly.This may be due to the contribution from the flexural vibrations along both X and Y directions.By comparing the fatigue damage between the joints at node 10803(in the north west of the center of the jacket)and 10804(in the south west of the center of the jacket),it shows that the former joint has a lower fatigue damage than that of the latter one.This may be due to the reason that the center of gravity of the topside structure is closer to the South-West Leg than to the North-West Leg,this induces additional compressive forces on the members at south west of the jacket,which shift the local member vibration at the south-west of the jacket to a lower fundamental eigenfrequency compared with the other parts of the structure.Generally,the curves of the fatigue damage without taking the wave directional probability into account show symmetry around the center of the original coordinate.It is also observed that the difference of fatigue damage between the cases forγ=2 and 4.1 set ups is not significant.For a structure with higher natural period close to the modal wave periods of the dominated sea states,the wave peak enhancement effects may be significant.
9 Influence from the number of sample inputs N of the wave energy spectrum
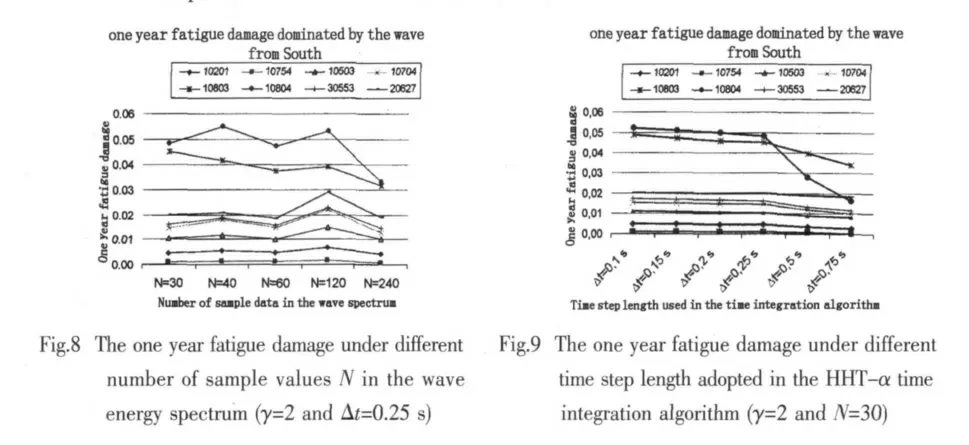
By keepingγ=2 andΔt=0.25 s,the one year fatigue damage due to the variation of N at the dominant wave direction-south,is studied as shown in Fig.8.It can be observed that the trend of the variation of the fatigue damage due to the variation of the sample inputs N can not be identified.At the range between N=30 and N=240,the maximum calculated fatigue damage generally occurs when N=120.However,the fatigue damage at N=40 also shows a local maximum.This may due to the reason that when N=40,at certain sea states,there is one or more selected discrete sample frequencies energy inputs significantly increasing the dynamic structural responses compared with the case when this/those frequencies are not chosen.The ratio of total computation time for N=30,40,60,120,and 240 is 1:1.07:1.18:1.47:2.09.
10 Influence from the time step length
Numerical stability and accuracy can be achieved if the time step length in the direct time integration algorithm is small enough to integrate accurately the response in the lowest period component.However,this may require a rather small time step and,consequently,demanding computation cost.In reality,the vibration in the lowest period range may not be a necessary contributor to the dynamic response.Therefore,the sensitivity analysis of fatigue damage with the variation of the time step length is performed.
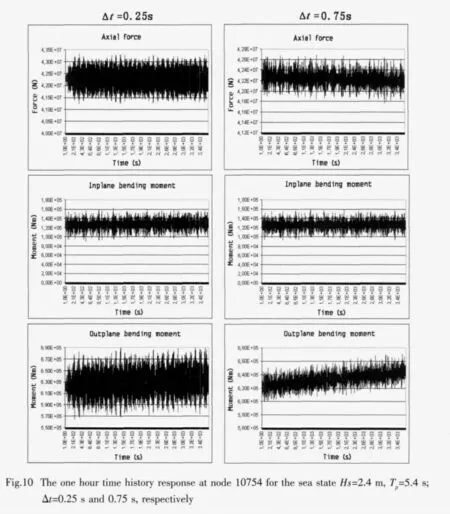
Fig.9 shows the one year fatigue damage under different time step length adopted in the HHT-αtime integration algorithm for the conditions ofγ=2 and N=30.It is observed from the figure that the larger the time step is,the lower the one year fatigue damage gives.This may be mainly due to the reason that when the time step length is increased,some of the stress variation histories will be filtered out by the larger time step.It shows that when the time step is below 0.25 s,the variation of the time step length does not significantly change the fatigue damage.The largest and smallest difference betweenΔt=0.1 s and 0.25 s is 8.36 % and 2.07 %for the positions with node numbers of 10803 and 20627,respectively.The largest and smallest difference betweenΔt=0.2 s and 0.25 s is 3.36 % and 0.51 % for node numbers of 10804 and 20627,respectively.Fig.10 shows the time history response at node 10754 of sea state blocks 6(Hs=2.4 m Tp=5.4 s)forΔt=0.25 s and 0.75 s,respectively.It is observed that both the response amplitudes and cycles are significantly lower forΔt=0.75 s than those forΔt=0.25 s.Especially for the out of plane bending moments,the average value of the moments increased with time,which shows a sorts of“instable”phenomenon in the numerical computation,this may mainly due to the increased numerical damping due to the large time step set up.Thus it is recommended that the time step length should be below 0.25 s,which gives about 17 calculations per fundamental eigen-period.Note that the computation time and the required computer memory to save the time history results are approximately proportional to the inverse of the time step length,in order to optimize these,a properly larger time step length should be chosen without losing required computational accuracy.
11 Influence from significant wave height and modal wave period
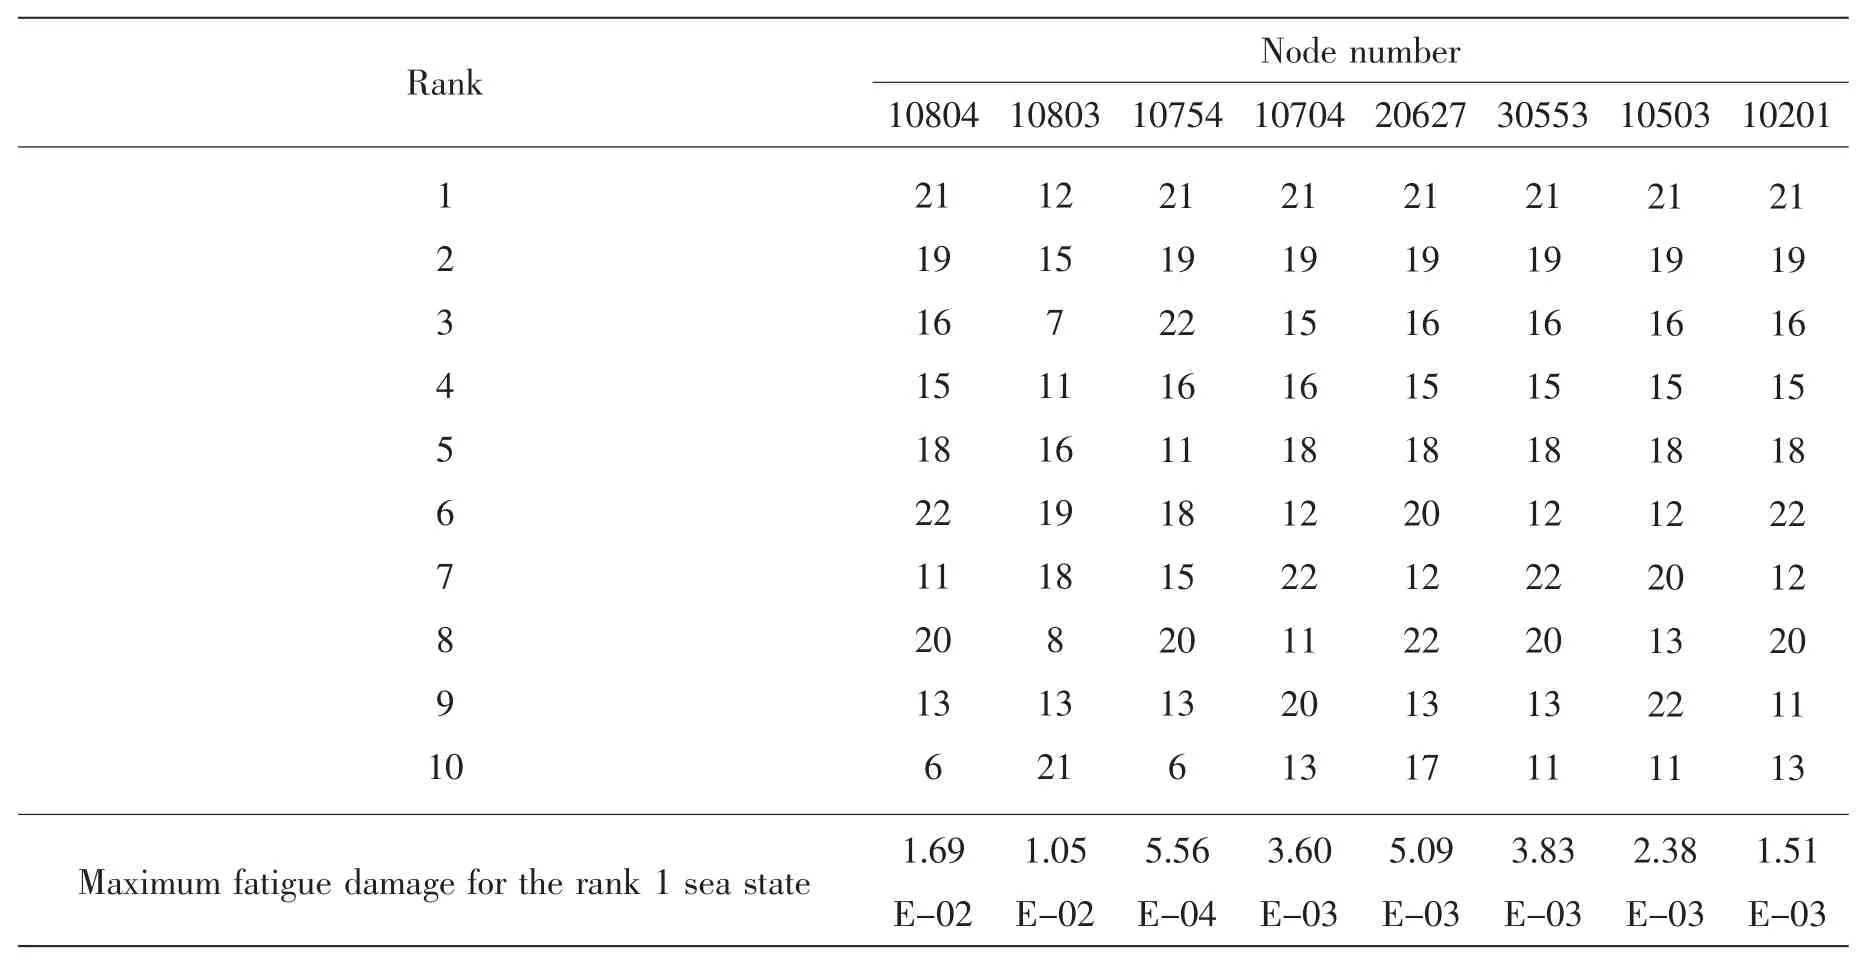
The most significant sea states contributing to the fatigue damage of the 8 selected positions are shown in Table 7 and Table 8 for the conditions for without and with taking the sea state probability into consideration,respectively.The block number corresponds to the sea state illustrated in Table 2.

Tab.7 The most relevant 10 sea states(blocks)contributing to the fatigue damage at the selected positions(without taking the probability of sea states into account)
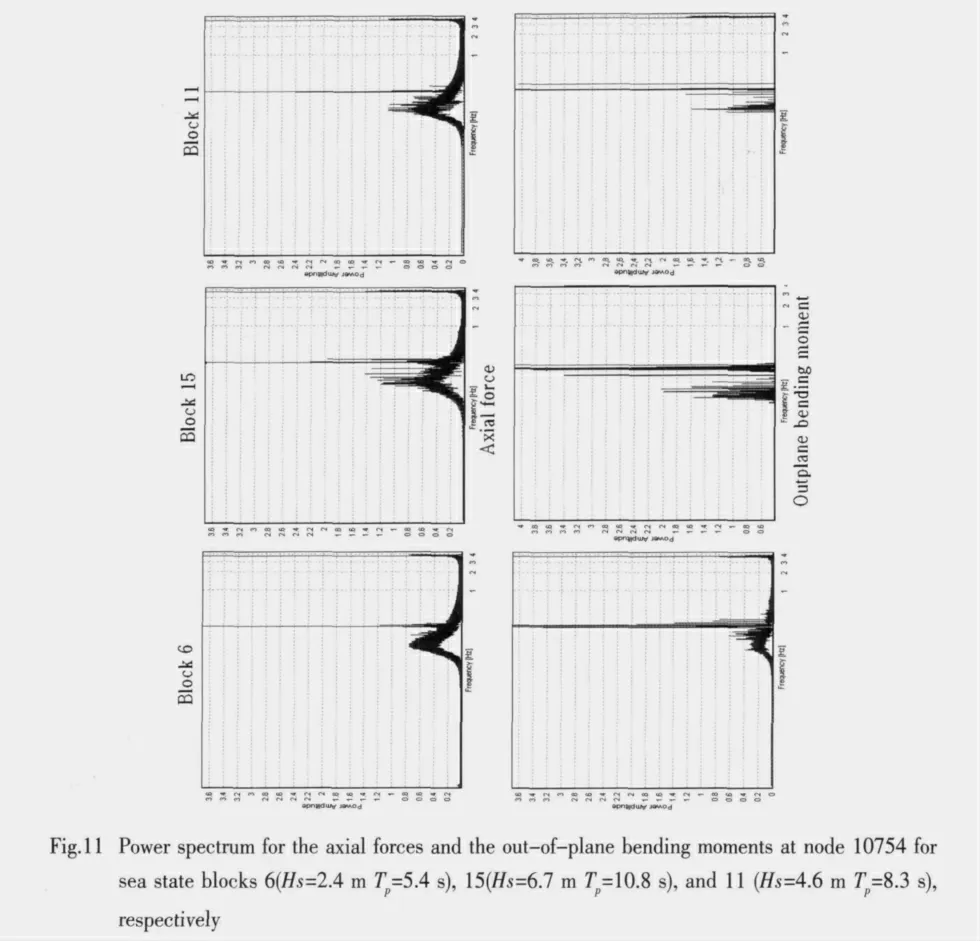
By investigating Table 7,it is observed that,the fatigue damage increases with the increase of the significant wave height or the decrease of modal wave period.Generally,the fatigue damage is dominated by the significant wave height.However,it is also partially influenced by the modal wave period.This is due to the reason that,the shorter the modal wave period is,the larger the numbers of stress amplitude cycles and the structural response are.Even if the block 20 has a 0.1 m higher of significant wave height,while its modal wave period is 2.8 s longer than the block 19,thus its contribution to the fatigue damage for all selected positions on the jacket is lower than that of the sea state block 19.Furthermore,by comparing the responses between block 15(Hs=6.7 m Tp=10.8 s)and block 11(Hs=4.6 m Tp=8.3 s),the axial force and the bending moment amplitudes for the two sea states are found to be in the same range due to the short modal wave period for the former one.In addition,the force amplitude cycles for the block 11 are larger than those of the block 15,thus the block 11(with lower significant wave height)yields an even higher fatigue damage than that of the block 15.The influence from the variation of modal wave period is due to the hydrodynamic forces applied on the tubular components as well as the vibrations of the structure.It should also be no-ticed that the free vibrations of the jacket structures also contribute to the fatigue damage of the structure.
Tab.8 The most relevant 10 sea states(blocks)contributing to the fatigue damage at the selected positions(take the probability of each sea state into account)
The responses of node 10754 are further studied by investigating the power spectrum(through Fourier transformation)of the axial forces and the out-of-plane bending moments as shown in Fig.11.The maximum value of the spectrum occurs between the period range of 4.16 s and 4.20 s,which is very close to the first two eigenperiod(4.173 s and 4.115 s)of the jacket structures shown in Table 5.Since the waves come from south,so the global flexural vibration mode along the north-south(second eigenmode)is believed to be more relevant to the dynamic response for node 10754 than that of the first eigenmode.Note that the period at the peak of the power spectrum for each case is higher than the second eigenperiod of 4.115 s.This is mainly due to the contribution from stress softening and the damping,which increase the peak power spectrum periods compared with the case without the damping.Since all the modal wave periods in the adopted sea states are higher than the jacket’s first two eigenperiod,the free vibration of jacket is believed to be a significant contributor to the fatigue damage of the structure.The power spectrum at the period below the peak power spectrum period is much higher than that above the peak power spectrum period.This is mainly due to the contribution of wave loads at the corresponding period.In addition,the magnitude of this part of power spectrum increases with the increase of the significant wave height.By considering the sea state probability,the block with the number 21 contributes to the fatigue damage most.This is due to the combination of both structural response and the high probability of occurrence of this sea state.
12 Statistical analysis of the time history
The statistical properties of the wave induced structural response are studied through the investigation of the variance,skewness and kurtosis of the local structural response(force components).Note that skewness characterizes the degree of asymmetry of a distribution around its mean.Compare to a Gaussian(normal)distribution with skewness equal to 0,positive skewness indicates a distribution with an asymmetric tail extending toward more positive values.Negative skewness indicates a distribution with an asymmetric tail extending toward more negative values.Kurtosis characterizes the relative peakness or flatness of a distribution compared with the normal distribution.A kurtosis of more than 3 indicates a relatively peaked distribution.A kurtosis of less than 3 indicates a relatively flat distribution.The nonGaussian distribution of the response can be identified by a nonzero skewness and a kurtosis unequal to 3 of the response.A larger deviation of the kurtosis from the value of 3 indicates more significant devia-tion of the response from that of a Gaussian distribution.Compared with a Gaussian distribution of the stress response,the nonGaussian distribution can significantly change the overall distribution of rainflow cycles,greatly affecting the probability of occurrence of the largest cycles’amplitude.Especially for a kurtosis larger than 3,the nonGuassian spectrum attributes great probability of occurrence to the largest amplitudes(with a thicker tails in the probability density function diagram)than its Gaussian counterpart,which results in a shorter fatigue life.The opposite trend can be expected when the kurtosis is less than three.This difference is particularly evident for large stress amplitude.
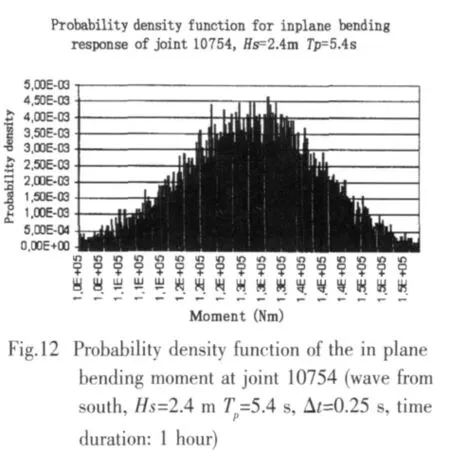
Table 9 illustrates an example of the variance,skewness and kurtosis of the force components for joint 10754 at three different sea state blocks.Obviously,the variance increases with the increase of the significant wave height,and is directly related to the contribution to fatigue damage.The skewness of each force component shows a distribution with a tail slightly towarding positive values,which can also be observed from an example of probability density function in Fig.12.It is obvious that for a simple offshore mono pile structure,the higher the sea states,the higher the non-Gaussian trend will be observed.However,for the current jacket structure,the variation trend of kurtosis influenced by the wave height can not be clearly identified.This indicates that the extent of nonGaussian structural response is not directly related to the adverseness of sea states.It agrees with the observation from on site measurements.This may be due to the reason that the jacket is a complex structure system than a mono pile structure,when it is subjected to the wave loading,different components of response interact with each other.

Tab.9 The skewness and kurtosis of the response for joint 10754(wave from south withΔt=0.25 s and time duration of 1 hour)
13 Conclusions and future studies
An efficient nonlinear dynamic analysis approach with wave loads generated from a new type of wave energy spectrum input has been introduced to calculate the fatigue damage of offshore structures.By using this approach,the directional effects and the peak enhancement of waves on the fatigue damage of the jacket structure were identified for the target jacket structure.It is found that in the reasonable range of wave peak enhancement,both the fatigue damage and directional wave induced fatigue for the target fixed offshore jacket are not sensitive to the variation of wave enhancement amplitude in JONSWAP wave spectrum.The fatigue damage at the selected positions on the jacket structure is mainly caused by the waves from the south and south west.It is also observed that the fatigue damage on the target jacket structure is not sensitive to the variation of the number of sample points of the wave spectrum as well as the time step length under certain limits.The fatigue damage is dominated by the wave height,while also highly influenced by the low value of modal wave period and the positions relative to the sea surface.It is suggested that the time step length should be carefully chosen in order to save the computation time as well as the computer memory without losing sufficient accuracy.Compared with the fatigue life calculated from the traditional wave spectrum input,the new wave energy input approach is more efficient for capturing the essential wave characteristics with rather limited number of wave energy spectrum input samples.
The extent of sea state adverseness directly influences the variance of the local response,but its influence on the nonGaussian trend of the response can not be clearly identified.
Even though in the direct time integration calculations,the eigenpairs are not required to compute,in order to identify structural characteristics and essential factors contributing to the dynamic structural responses,a modal analysis is highly recommended.The eigenfrequency analysis can also provide suggestion on how large the time incrementΔt should be.From the frequency analysis of the structural response,it is found that the peak frequency response occurs at the frequency close to the first two eigenfrequency of the jacket structure.Since all the modal wave periods in the adopted sea states are higher than the jacket’s eigenperiod,the free vibration of jacket is believed to be a significant contributor to the fatigue damage of the structure.
In the current study,by dividing the wave scatter diagram into only 22 blocks,one may miss some of the critical sea states which contribute significantly to the fatigue damage of the jacket structure.Thus a sensitivity analysis of the fatigue damage influenced by the quantity of the sea states blocks is recommended to carry out in the future study.
The input parameters in the JONSWAP spectra are varied with the change of sea states and areas.In order to identify the correlation between the fatigue damage and the variation of these parameters,a thorough parametric study using response surface analysis are recommended.
In addition,the sensitivity analysis of the fatigue damage due to the scatter effects of the environment data,material data(elastic modulus,S-N curves),and manufacture tolerance are recommended to carry out to obtain a reliability based fatigue life calculation,which can be useful for inspection purposes.
[1]Narayanan R,Roberts T M.Structures subjected to repeated loading:Stability and strength[M].Elsevier applied science,London,1991.
[2]Stacey A,Sharp J V.Safety factor requirements for the offshore industry[J].Engineering Failure Analysis,2007,14(3):442-458.
[3]Vugts J H.Fatigue damage assessments and the influence of wave directionality[J].Applied Ocean Research,2005,27(3):173-185.
[4]Jia Junbo.An efficient nonlinear dynamic approach for calculating the wave induced fatigue damage of offshore structures and its industry applications for the lifetime extension purpose[J].Applied Ocean Research,2008,30(3):189-198.
[5]NORSOK STANDARD(2004).Design of steel structures NO-004,rev.2[S].Norwegian Technology Standards Institution,Oslo,2004.
[6]Søreide T H,Amdahl J,Eberg E,Holmås T,HellanØ.USFOS-A computer program for progressive collapse analysis of steel offshore structures[R].Theory Manual.Report No.F88038,SINTEF,Trondheim,1993.
[7]Morison J R,O′Brian M P,Johnson J W,Schaaf S A.The force exerted by surface waves on piles[J].Petroleum Transactions,AIME,1950,189:149-154.
[8]NORSOK STANDARD(2007).Actions and action effects,N-003[S].Norwegian Technology Standards Institution,Oslo,2007.
[9]NORSOK STANDARD(1999).Actions and action effects,N-003[S].Norwegian Technology Standards Institution,Oslo,1999.
[10]Dowling N E.Mechanical behaviour of materials[M].Prentice-Hall,London,1999.
- 船舶力学的其它文章
- Experimental Study on Resistance and Longitudinal Motion of High-speed Air Cavity Craft in Regular Waves
- Numerical Simulation of Pressure Distribution in Vertical Water-entry Cavity
- Study of a Hybrid Method Based on FDM and MLSFD Method
- Parametric Identification of AUV’s Maneuvering Motion Based on Support Vector Machines
- Research on Calculation Methods of Hydrodynamic Coefficients for Sections with Complex Shape

