Numerical Simulation of Pressure Distribution in Vertical Water-entry Cavity
HE Chun-tao,WANG Cong,WEI Ying-jie,WANG Bai-qiu
(Harbin Institute of Technology,Harbin 150001,China)
1 Introduction
When a projectile enters water from the air,a water-entry cavity is formed.During the water-entry cavitating flow,air rushes in from above the water to fill the cavity,at the same time the natural cavitation may be triggered,when the speed of the projectile is sufficient to make the local pressure of water lower than the saturation pressure of water at local thermodynamic state.The present of the cavity will affect the subsequent trajectory of the projectile.Accurate prediction models for hydrodynamic behavior of the water-entry cavity are essential for the effective design of air-to-sea projectiles,which may be used to target underwater mines,torpedoes,or enemy vessel[1].
For a review of literature,the studies related to the water-entry problem can date back to one century ago.Worthington and Cole[2]pioneered to use single-spark photography in studies on the water-entry splashes,cavities,and jets of solid spheres into water and so pioneered the scientific investigation of solid-liquid impacts.Subsequent studies by Richardson[3]delineated the shape of air cavity and resistance of solid spheres into water at comparatively low entry speed.Birkhoff and Caywood[4]observed the velocity field of water-entry cavitating flow induced by the entry of solid missile by using a new photographic technique-chronophotography.The dependence of the vertical water-entry cavities on the atmospheric pressure over the water surface was investigated by Gilbarg and Anderson[5].Experimental and numerical simulation studies on water-entry cavity and hydrodynamics of missiles after water-entry were performed by Chen Jiu-xi[6-7]in China Ship Scientific Research Center.The most extensive studies on water-entry cavities were conducted by May[1,8-12]with a view to naval ordnance applications.A series of experimental studies on pressure in the water-entry cavity were performed by Abelsom[13].Early studies related to water-entry problems have been performed largely by experiments and at lower water-entry speeds.With the development of the image and flow sensing techniques,several experimental studies have focused on high-speed water-entry problems[14-18].Splashes from the different wettability sphere were be demonstrated by Cyril Duez et al[19].And the early theoretical models for water-entry cavity dynamics were based partially on empirical data and potential flow theory[17-18,20-21].
In the present paper,numerical simulation of vertical water-entry cavitating flow,based on solving the Navier-Stokes equations with cavitation model and turbulence closure,was carried out.The free water surface and the mass transfer from water to vapor due to cavitation were taken into account in the simulation.The experimental data conducted by Abelsom was used to validate the computational methodology used in the paper.Particular attention has been given to the pressure distribution in the vertical water-entry cavity for various entry speeds and cone angle of noses.The time evolution of airflow velocity field in cavity prior to the surface has also been analyzed in the paper.
2 Governing equations and numerical technique
2.1 Governing equations
The set of governing equations for water-entry cavitating flow under the homogeneousfluid modeling consists of the conservative form of the Favre-averaged Navier-Stokes equations,the k-εtwo-equation turbulence closure,and transport equations for the vapor and air volume fraction.The continuity and momentum equations are given below.

whereρmis the mixture density,uiis the velocity vector,agand avare the volume fractions of air and vapor respectively,p is the pressure,μmis the mixture viscosity,μt=ρmCμk2/εis the turbulent viscosity.The mixture density,mixture viscosity,and turbulent viscosity are expressed as:

whereρl,ρgandρvare the density of liquid,gas,and vapor phases,respectively,al=1-ag-avis the liquid volume fraction.
Transport equation for vapor volume fraction[22]was used to simulate vapor generation and condensation rates in the cavitating flow,expressed as follows:

where RB=10-6m is the bubble radius,anuc=5×10⁻⁴is the nucleation site volume fraction,Fvap=50 and Fcond=0.001 are the empirical evaporation and condensation coefficients,respectively.
Tracking of the interface between liquid and air phases is accomplished by solving a transport equation for the air volume fraction,expressed as follows:

A high Reynolds number form standard k-εmodel with standard wall functions is implemented to provide turbulence closure.

whereσk=1.0 andσε=1.3 are the turbulent Prandtl numbers for k andε,respectively.Cμ=0.09,C1ε=1.44,and C2ε=1.92 are constants.represents the generation of turbulence kinetic energy due to the mean velocity gradients.
2.2 Computational methodology and validation
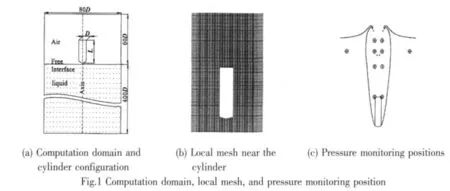
The configurations of water-entry cylinder projectile geometry and computational domain are shown in Fig.1a.D and L are the diameter and the length of cylinder projectile,respectively.A 5-block structure grid(32 4750 cells)is used and the local mesh is shown in Fig.1b.Three other grids consisting of 107 000,168 800,and 515 000 cells were also used to check grid sensitivity of solutions.Numerical results of the water-entry cavity size for the two grids with 324 750 and 515 000 cells are almost same and consistent with the results of ideal waterentry cavity model[1].
The working fluids were water and air at 300 K,with liquid,vapor,and air densities of 998.2 kg/m3,0.025 6 kg/m3,and 1.225 kg/m3,saturation pressure of 3 540 Pa and surface tensionσ=0.074 N/m.Atmospheric pressure,turbulence quantities and air mass fraction were specified at the top boundary(outlet).The right and left boundaries were wall.The axis-symmetry boundary condition was used in the simulations.The bottom of the computation domain is the pressure outlet and the static pressure and turbulence quantities were specified.A schematic representation of the pressure monitoring points placement was shown in Fig.1c.
The time-dependent governing equations are discretized by using the finite volume method and the PISO scheme is used for the pressure-velocity coupling algorithms.The QUICK upwind scheme is used for the convection terms and the central-differenced scheme for the diffusion terms in the momentum equations and transport equations for k andε.The PRESTO(pressure staggering option)scheme is used for the pressure interpolation.The QUICK scheme is used for the transport equation for vapor and air volume fractions.A non-dimensional physical time-step tU0/D=0.001,was used for this computation.
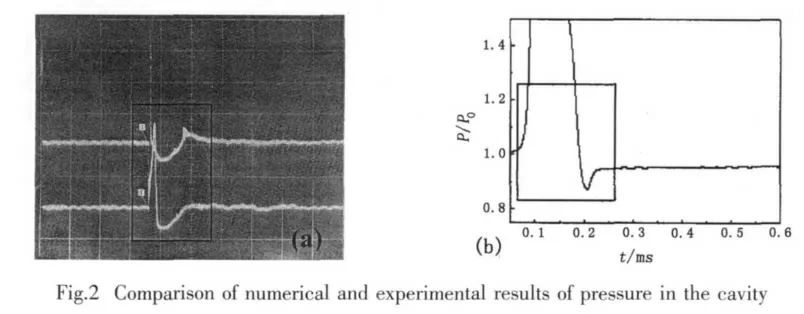
In order to validate the computational methodology in the present paper,the comparison between the numerical result and experimental data is carried out.Because of the natural of the problem,the only quantitative experimental data of pressure in the water entry cavity was obtained by Abelsom in U.S.Naval Ordnance Laboratory[13](Fig.2a),which shows that the rapid rise and fall in pressure at right the impact,after that moment the pressure falls below the ambient value because the probes penetrated the cavity wall.Although the right values of the pressure drop in the cavity are complicated to get and not have precision results up to now,the history of the pressure drop prior to surface closure is acceptable.The computation case of a 150°cone nose cylinder projectile vertically entry water at 50 m/s is conducted.The history of the pressure after the impact moment is from the monitor point at 0.5D depths from the undisturbed free surface,and 1.2D from the axis of entry trajectory(Fig.2b).It can be seen that there are both a rapid rise and fall of pressure in the experimental and numerical results just after impact.And before the water-entry cavity closure occurred,the pressure in the cavity drops below the atmospheric pressure.The result shows that the trend of time evolution of pressure in water-entry cavity from the numerical results agrees well with that of experimental results,which validated the computational methodology in the paper.
3 Results and discussion
3.1 Pressure in the cavity at different water-entry speeds
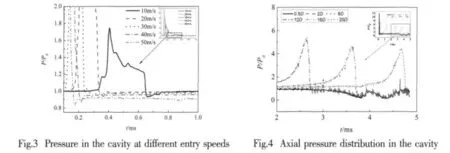
First of all,numerical simulations of vertical water-entry at different constant speeds for a 150°cone-nosed cylinder projectile have been conducted.The pressure in the cavity was monitored at the same position,0.5D depths and 1.2D from the axis of entry trajectory.The time evolution of the pressure at the monitor position is shown in Fig.3,and the reference pressure P0=101 325 Pa.
It is noted that when the monitor point presented in the cavity,the pressure drops below the ambient pressure due to the increase of the airflow velocity and so on.During the opencavity period,the pressure in the cavity is always below the ambient pressure.Then with the development of the cavity,the pressure presented a steady trend.As expected,the higher entry speeds,the drop of pressure increases.
3.2 Axial and transverse distribution of pressure in the cavity
Computations for the axial and transverse pressure distribution in the vertical water-entry cavity of a 120° cone-nosed cylinder projectile at the entry speed of 50 m/s have been done in this part.For presenting the axial pressure distribution,these pressure monitor points have the same distance from the axis of entry trajectory,and for the transverse distribution,these pressure monitor points have the same distance from undisturbed free surface.
The time evolutions of the pressure in the cavity at different depths(0.5D,2D,6D,12D,16D,and 20D),and 1.2D away from the axis of the entry trajectory between the impact moment and the surface closure are shown in Fig.4.It can be seen that the rapid rise and fall of pressure were observed at all monitor points,and as the depth increases the overshoot decreases.From the beginning of the surface closure,the pressure preformed the fluctuation features(Fig.4),due to the aperture area becomes smaller and then the airflow velocity increases rapidly.Comparing all these signals,only small pressure differences are observed when the monitor points are in the cavities,which means that there is no great difference of the pressure distribution in the axial depths of 120° cone-nosed cylinder projectile at 50 m/s.
Fig.5 shows the time evolutions of pressure in the cavity from these points at the same depth(2D)from the undisturbed free surface,and various distances from the axis of entry tra-jectory(1.2D,2D,and 4D).The pressure signals from the very start of impact phase are presented in Fig.5a.The signals show overshoots for all of these three monitor points,but the longer transverse distance from the axis,the lower overshoot.The pressure signals show a nearly constant value below the ambient pressure after the overshoot.The pressure oscillates under the ambient pressure with the same frequency at the time of nearly surface closure(Fig.5b).From the whole time evolutions of pressure from those three monitor points,it is noted that the pressure signals agree with each other except for the beginning of the water entry,and keep nearly constant value between the end of the overshoot and the beginning of the surface closure.

3.3 Effect of nose shape on the pressure in the cavity
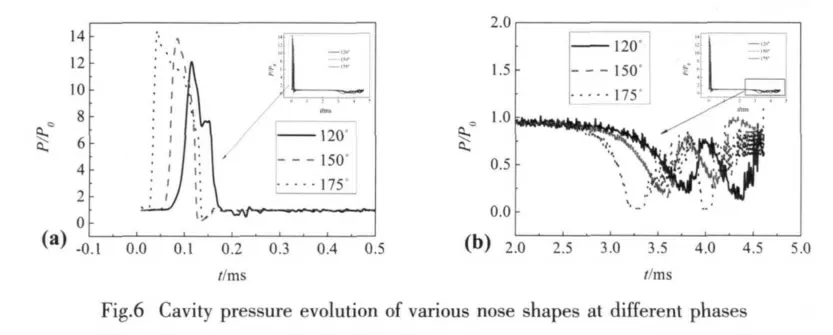
To determine the dependence of the pressure in vertical water-entry cavity on the nose shape,numerical simulations of water-entry cavitating flow around cylinder projectiles with different nose shapes(cone angles are 120°,150°,and 175°,respectively)were conducted.Fig.6 shows the pressure in the vertical water-entry cavity for these three nose-shape cylinder projectiles at the same entry speed(50 m/s).Where the monitor points were placed at 0.5D depth from the undisturbed free surface and 1.2D from the axis of entry trajectory.Fig.6a presents the time evolution of pressure in the cavity of impact period from various nose shape projectiles.It shows that the overshoot of P/P0increases as the cone of projectiles nose increases.The pressure evolution presents the feature of fluctuation from the beginning of surface closure(Fig.6b)for all those three nose-shape projectiles,and nearly with the same frequency.It can be seen from the whole time evolution of pressure of the three nose shape projectiles,the value of P/P0keeps nearly constant value between the end of overshoot and the beginning of the surface closure.
3.4 Airflow velocity contours in the cavity
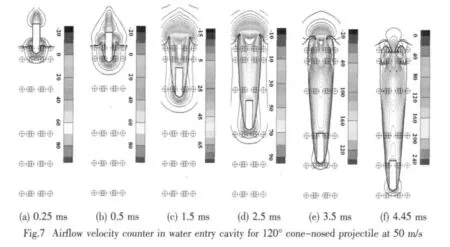
Computations for vertical water entry of 120° cone-nosed projectile at 50 m/s are carried out in this section.Specific attention is given to the velocity field of airflow in the cavity before surface closure occurred completely.Because of the lower initial entry speed[23],the compressible effect of the air and water are neglected in the computations.The contours of airflow velocity at different moment in water entry cavity are presented in Fig.7.The figure shows that from the beginning of the formation of the water-entry cavity,the air rushes in from above the water surface to fill it with largely greater speed than entry speed of the projectile,which is in good agreement with experimental results[24-25].And the beginning of the surface closure causes a restriction in the opening,while the aperture area becomes smaller,the airflow velocity increases rapidly,and lead to the fluctuations of the pressure when the time closes to the moment of surface closure.
4 Conclusions
Numerical simulation of vertical water-entry cavitating flow was conducted,based on solving the Navier-Stokes equations with cavitation model and turbulence closure.The free surface was taken into account and particular attention has been given to the spatial distribution and time evolution of pressure in the cavities.The results show that the pressure drop in the vertical water-entry cavity prior to the surface closure was found to be strongly affected by the entry speed.As the entry speed increases,the pressure drop prior to surface closure decreases.There is no distinct axial and transverse pressure gradient inside the vertical water-entry cavity,which is in good agreement with the experimental results of Abelson.At the open-cavity period,the pressure evolution is independent on the angle of the cone nose.The airflow ve locity was found,when the surface closure occurring,to be greater than the entry speed,and may be many times greater near the opening aperture,and the pressure history during this time interval performed complicated fluctuation features.
[1]May A.Water entry and the cavity-running behavior of missiles[R].Washington:AD A020429,1975.
[2]Worthington A M,Cole R S.A study of splashes[M].New York:Longmans Green and Company,1908.
[3]Richardson E G.The impact of a solid on a liquid surface[J].Proc.Phys.Soc.,1948,61:352-367.
[4]Birkhoff G,Caywood T E.Fluid flow patterns[J].Journal of Applied Physics,1949,20:646-659.
[5]Gilbarg D,Anderson R A.Influence of atmospheric pressure on the phenomena accompanying the entry of spheres into water[J].Journal of Applied Physics,1948,19:127-139.
[6]Zhang Qingming,Chen jiuxi.Cavity simulation study for early water entry of revolution body[J].Journal of Hydrodynamics,1984(1):102-118.
[7]Chen jiuxi,Yan Kai.The calculation of vertical constant-speed water entry cavity of flat-nosed body using the MAC-Method[J].Journal of Hydrodynamics,1985(1):17-26.
[8]May A,Woodhull C J.Drag coefficient of steel spheres entering water vertically[J].Journal of Applied Physics,1948,19:1109-1121.
[9]May A.Effect of surface condition of a sphere on its water-entry cavity[J].Journal of Applied Physics,1951,22(10):1219-1222.
[10]May A.Water entry of missiles into water[J].Journal of Applied Physics,1952,23(12):1362-1372.
[11]May A.The cavity after vertical water entry[R].Washington:AD679905,1968.
[12]May A.Review of water-entry theory and date[J].Journal of Hydrodynamics,1970,4(4):140-142.
[13]Abelson H.Pressure measurements in the water-entry cavity[J].J Fluid Mech.,1970,44:129-144.
[14]Truscott T T,Techet A H.Water entry of small spinning spheres[J].J Fluid Mech.,2009.(in press)
[15]Hrubes J D.High-speed imaging of supercavitating underwater projectile[J].Experiments in Fluids,2001,30(1):57-64.
[16]Klomfass A,Salk M.Numerical analysis of the supercavitating supersonic flow about blunt bodies[C].Proc.25th Int.Symp.On Shock Waves,2005:1232-1a:997-1002.
[17]Airstoff J M,Bush J W M.Water entry of small hydrophobic sphere[J].J Fluid Mech.,2009,619:45-78.
[18]Aristoff J M,Truscott T T,Techet A H,et al.The water entry of decelerating spheres[J].Physics of Fluids,2010,22(3),032102:1-7.
[19]Duez C,Ybert C,Clanet C,Bocquet L.Making a splash with water repellency[J].Nature physics,2007,3:180-183.
[20]Lee M,Longoria R G,Wilson D E.Cavity dynamics in high-speed water entry[J].Phys.Fluids,1997,9:540-550.
[21]Logvinovich G V.Hydrodynamics of free-boundary flows[M].Jersualem,Israel Program for Scientific Translation,1972.
[22]Zwart P J,Gerber A G,Belamri T.A two-phase flow model for predicting cavitation dynamics[C]//In Fifth International Conference on Multiphase Flow.Yokohama,Japan,2004.
[23]Neaves M D,Edwards J R.All-speed time-accurate underwater projectile calculations using a preconditioning algorithm[J].Journal of Fluids Enginnering,2006,128:284-296.
[24]Stephan Gekle,et al.Supersonic air flow due to solid-liquid impact[J].Physics.Fluid Dynamics,2010,104:1-5.
[25]Stephan Gekle,Jose Manuel Gordillo.Compressible air flow through a collapsing liquid cavity[J].Numerical Methods in Fluids,2010.
- 船舶力学的其它文章
- Experimental Study on Resistance and Longitudinal Motion of High-speed Air Cavity Craft in Regular Waves
- Study of a Hybrid Method Based on FDM and MLSFD Method
- Parametric Identification of AUV’s Maneuvering Motion Based on Support Vector Machines
- Research on Calculation Methods of Hydrodynamic Coefficients for Sections with Complex Shape
- Investigation of Sea Wave and Structure Modelling for Fatigue Assessment of Offshore Structures

