
Ferroptosis biomarkers predict tumor mutation burden's impact on prognosis in HER2-positive breast cancer
2024-05-06 09:59JinYuShiXinCheRuiWenSiJiaHouYuJiaXiYiQianFengLingXiaoWangShiJiaLiuWenHaoLvYaFenZhang
Jin-Yu Shi,Xin Che,Rui Wen,Si-Jia Hou,Yu-Jia Xi,Yi-Qian Feng,Ling-Xiao Wang,Shi-Jia Liu,Wen-Hao Lv,Ya-Fen Zhang
Abstract BACKGROUND Ferroptosis has recently been associated with multiple degenerative diseases.Ferroptosis induction in cancer cells is a feasible method for treating neoplastic diseases.However,the association of iron proliferation-related genes with prognosis in HER2+breast cancer (BC) patients is unclear.AIM To identify and evaluate fresh ferroptosis-related biomarkers for HER2+BC.METHODS First,we obtained the mRNA expression profiles and clinical information of HER2+BC patients from the TCGA and METABRIC public databases.A fourgene prediction model comprising PROM2,SLC7A11,FANCD2,and FH was subsequently developed in the TCGA cohort and confirmed in the METABRIC cohort.Patients were stratified into high-risk and low-risk groups based on their median risk score,an independent predictor of overall survival (OS).Based on these findings,immune infiltration,mutations,and medication sensitivity were analyzed in various risk groupings.Additionally,we assessed patient prognosis by combining the tumor mutation burden (TMB) with risk score.Finally,we evaluated the expression of critical genes by analyzing single-cell RNA sequencing (scRNA-seq) data from malignant vs normal epithelial cells.RESULTS We found that the higher the risk score was,the worse the prognosis was (P <0.05).We also found that the immune cell infiltration,mutation,and drug sensitivity were different between the different risk groups.The highrisk subgroup was associated with lower immune scores and high TMB.Moreover,we found that the combination of the TMB and risk score could stratify patients into three groups with distinct prognoses.HRisk-HTMB patients had the worst prognosis,whereas LRisk-LTMB patients had the best prognosis (P <0.0001).Analysis of the scRNAseq data showed that PROM2,SLC7A11,and FANCD2 were significantly differentially expressed,whereas FH was not,suggesting that these genes are expressed mainly in cancer epithelial cells (P <0.01).CONCLUSION Our model helps guide the prognosis of HER2+breast cancer patients,and its combination with the TMB can aid in more accurate assessment of patient prognosis and provide new ideas for further diagnosis and treatment.
Key Words: HER2+breast cancer;Ferroptosis;Tumor mutation burden;Single-cell RNA sequencing;Prognosis
INTRODUCTION
Breast cancer (BC) is the most prevalent malignancy in the world and the primary cause of cancer-related deaths in women[1].As a highly heterogeneous disease,BC has four molecular subtypes: Basal/triple-negative,luminal A,luminal B,and HER2-positive[2].HER2 is an orphan tyrosine kinase receptor that regulates cell proliferation and survival when activated.Located at chromosome 17q12,the HER2 oncogene is amplified in 15-20% of all BCs[3].The primary and essential mechanism of HER2 receptor overexpression is amplification[4,5].Due to its role in cell proliferation,invasion,and survival,this mechanism confers a poor prognosis.Standard treatment modalities include surgery combined with chemotherapy,radiotherapy,endocrine therapy,and HER2-targeted therapy which are widely used in clinical practice[5].For the HER2-positive subtype,HER2-targeted treatments,such as trastuzumab,pertuzumab,T-DM1,DS8201,and tyrosine kinase inhibitors (TKIs),can significantly improve disease-free survival and overall survival (OS)[6,7].Notably,not all patients derive equal benefits from existing anti-HER2 therapies,and HER2-positive BC is inherently heterogeneous.Although numerous studies have focused on investigating the prognostic significance of ferroptosis-related genes in BC[8-10],analyses specific to BC subtypes are lacking.A more comprehensive understanding of tumor biology and the HER2 signaling pathway is essential for advancing novel strategies to improve patient outcomes.
A new type of controlled cell death known as ferroptosis differs from apoptosis,necrosis,and autophagy in morphology,biochemistry,and genetics[11].It is characterized by disruption of the intracellular redox balance and nonapoptotic cell death.Previous studies revealed that the NAD (P)H/FSP1/CoQ10 and cyst (e)ine/GSH/glutathione peroxidase 4 (GPX4) signaling pathways control ferroptosis.Ferroptosis is caused by the buildup of lipid peroxidation products and reactive oxygen species generated from iron metabolism.Increasing evidence suggests that ferroptosis is closely related to many diseases,especially HER2+BC[12].Thus,ferroptosis has gained popularity as a potential therapeutic strategy to promote cancer cell death.Various studies have reported ferroptosis induction by afatinib and lapatinib[13].However,the association between iron proliferation-related genes and prognosis in HER2+BC patients has yet to be determined,hindering practical clinical assessment before treatment.
This research systematically analyzed HER2+BC expression data and clinical information from the TCGA and METABRIC cohorts.Furthermore,we identified genes associated with ferroptosis that were differentially expressed in patient tissues compared with normal tissues,screened four signatures related to survival,and constructed a consistent prediction model.We also explored the associations of ferroptosis with immune cell infiltration,mutations,and immune checkpoints in HER2+BC patients.These results provide a foundation for developing comprehensive therapeutic strategies for HER2+BC patients.
MATERIALS AND METHODS
Data collection
We used HER2+BC datasets downloaded from the TCGA (https://protal.gdc.cancer.gov/repository) and the METABRIC databases (www.cbioportal.org/).The downloaded data were filtered using the following criteria: (1)Histologically diagnosed with malignant BC;(2) complete corresponding clinical data;and (3) available OS data for more than 90 d.Additional average breast tissue mRNA expression data (n=91) were obtained from GTEx (https://gtexportal.org/home/datasets).The final sample included 168 patients from the TCGA cohort and 126 patients from the METABRIC cohort with complete follow-up information.A total of 259 genes associated with ferroptosis were retrieved from the FerrDb website (http://www.zhounan.org/ferrdb/current/) and are reported in Supplementary Table 1(marker: 111;Driver: 108;suppressor: 69).The single-cell RNA sequencing (scRNA-seq) dataset was assessed from the Gene Expression Omnibus (GEO) database (http://www.ncbi.nlm.nih.gov/geo).

Table 1 Clinical characteristics of patients in different risk groups in TCGA and METABRIC cohorts,n (%)
Construction of a prognostic ferroptosis-related gene signature
The TCGA and METABRIC cohorts were selected as training and validation sets,respectively.First,the log2 transformation approach was used after the raw count data had been normalized using the transcripts per million method.The number of DEGs was calculated using the “DESeq2” package (P<0.05) in R.Venn was used to identify DEGs associated with ferroptosis.Univariate Cox regression analysis was performed to identify ferroptosis-related prognostic genes,and relevant genes were selected using a cutoff ofP<0.05.In total,18 genes were chosen for the minor absolute shrinkage and selection operator (LASSO) Cox regression.Multivariate Cox regression analysis was subsequently applied to further assess the significant factors.We used lasso-penalized Cox regression analysis with the"glmnet" package in R to choose prognostic ferroptosis-related genes and construct a predictive model.The following formula was used to generate the risk score: Risk score=sum (corresponding coefficient × expression level of the gene).The expression levels of the genes were normalized,and the regression coefficients were calculated from the training set.Patients were then categorized into high-or low-risk groups according to the median risk score.The "Rtsne" package was used to run t-SNE to investigate the distribution of various groups.Using the "survminer" package in R,Kaplan-Meier (KM) curves were created to predict OS.The "survival receiver operating characteristic (ROC)" package in R was used to run a time-dependent ROC curve analysis to evaluate the ability of the signature genes to predict survival.
Integrated analysis of combined clinical and multiomics data from the risk-scoring model
To determine the relevant immune cell infiltration patterns and immunological characteristics,the CIBERSORT algorithm was used.The "ESTIMATE" program was applied to estimate the tumor purity scores.We examined the expression of immune-related signal transduction pathway components in various risk groups.We compared the estimated immune and stromal scores between the high-and low-risk groups.We also examined the underlying mechanisms in two risk subgroups using TCGA gene mutation data.The "MAFtools" package of R was used to evaluate SNP mutations and visualize the results.The tumor mutation burden (TMB) was subsequently determined.Patients were separated into two groups based on the median TMB value: The high TMB group and the low TMB group.Subsequently,the TMB score was combined with the risk score to form a new subgroup.
Our study included specific well-known immune checkpoint genes to evaluate gene expression levels across various risk score groups.Drug susceptibility was predicted using information from the GDSC database (https://www.cancerrxgene.org/celllines).The half-maximal inhibitory concentration (IC50) indicated the patient’s drug response and was calculated using the "pRRophetic" package.
Hub gene mRNA expression validation in the scRNA-seq data
scRNA-seq data (GSE161529) from 6 HER2-positive BC patients and 13 healthy controls were obtained from the GEO database (https://www.ncbi.nlm.nih.gov/geo/).Subsequently,low-quality cells were removed using the following criteria: (1) Had a number of expressed genes lower than 500;(2) Had a number of expressed genes higher than 2500;or(3) Had a proportion of mitochondria larger than 10%.The R "Seurat" package was used for cell cluster analysis.Cellular regions were manually annotated based on marker gene expression patterns and cell subset grouping patterns.The expression levels of the hub genes were subsequently displayed in each cell subset.Additionally,we validated the differential expression profiles of prognostic genes in the epithelial cells of patients and healthy controls using the tool“FindMarkers.”
Statistical analysis
R 4.1.0 was used to perform all the statistical analyses.A log-rank test and K-M analysis were used to compare OS among various risk subgroups.The primary prognostic variables connected to OS were identified using univariate and multivariate Cox regression analyses.Continuous and categorical variables were compared in the training and verification sets using Spearman correlation analysis.Unless otherwise stated,all the statistical tests were two-sided,and values withP<0.05 were considered to indicate statistical significance.
RESULTS
A flowchart of our research is shown below (Figure 1).In this study,168 patients with the HER2+subtype of BC from the TCGA database served as the training cohort,whereas 126 patients from the METABRIC cohort were enrolled as the validation cohort.Supplementary Table 2 summarizes the clinical features of the two cohorts.
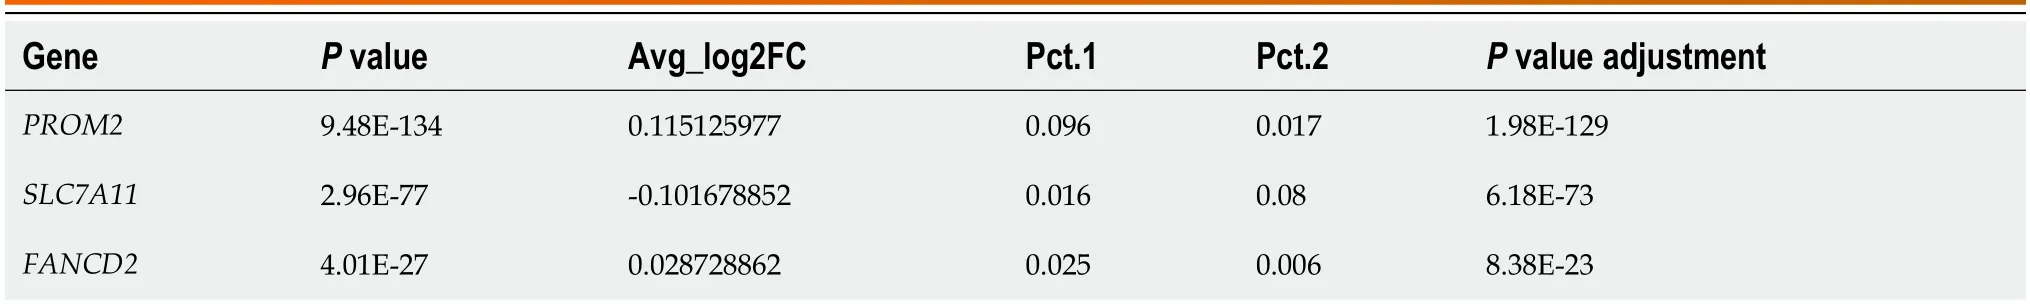
Table 2 Hub gene differentially expressed between normal and cancer epithelial cells
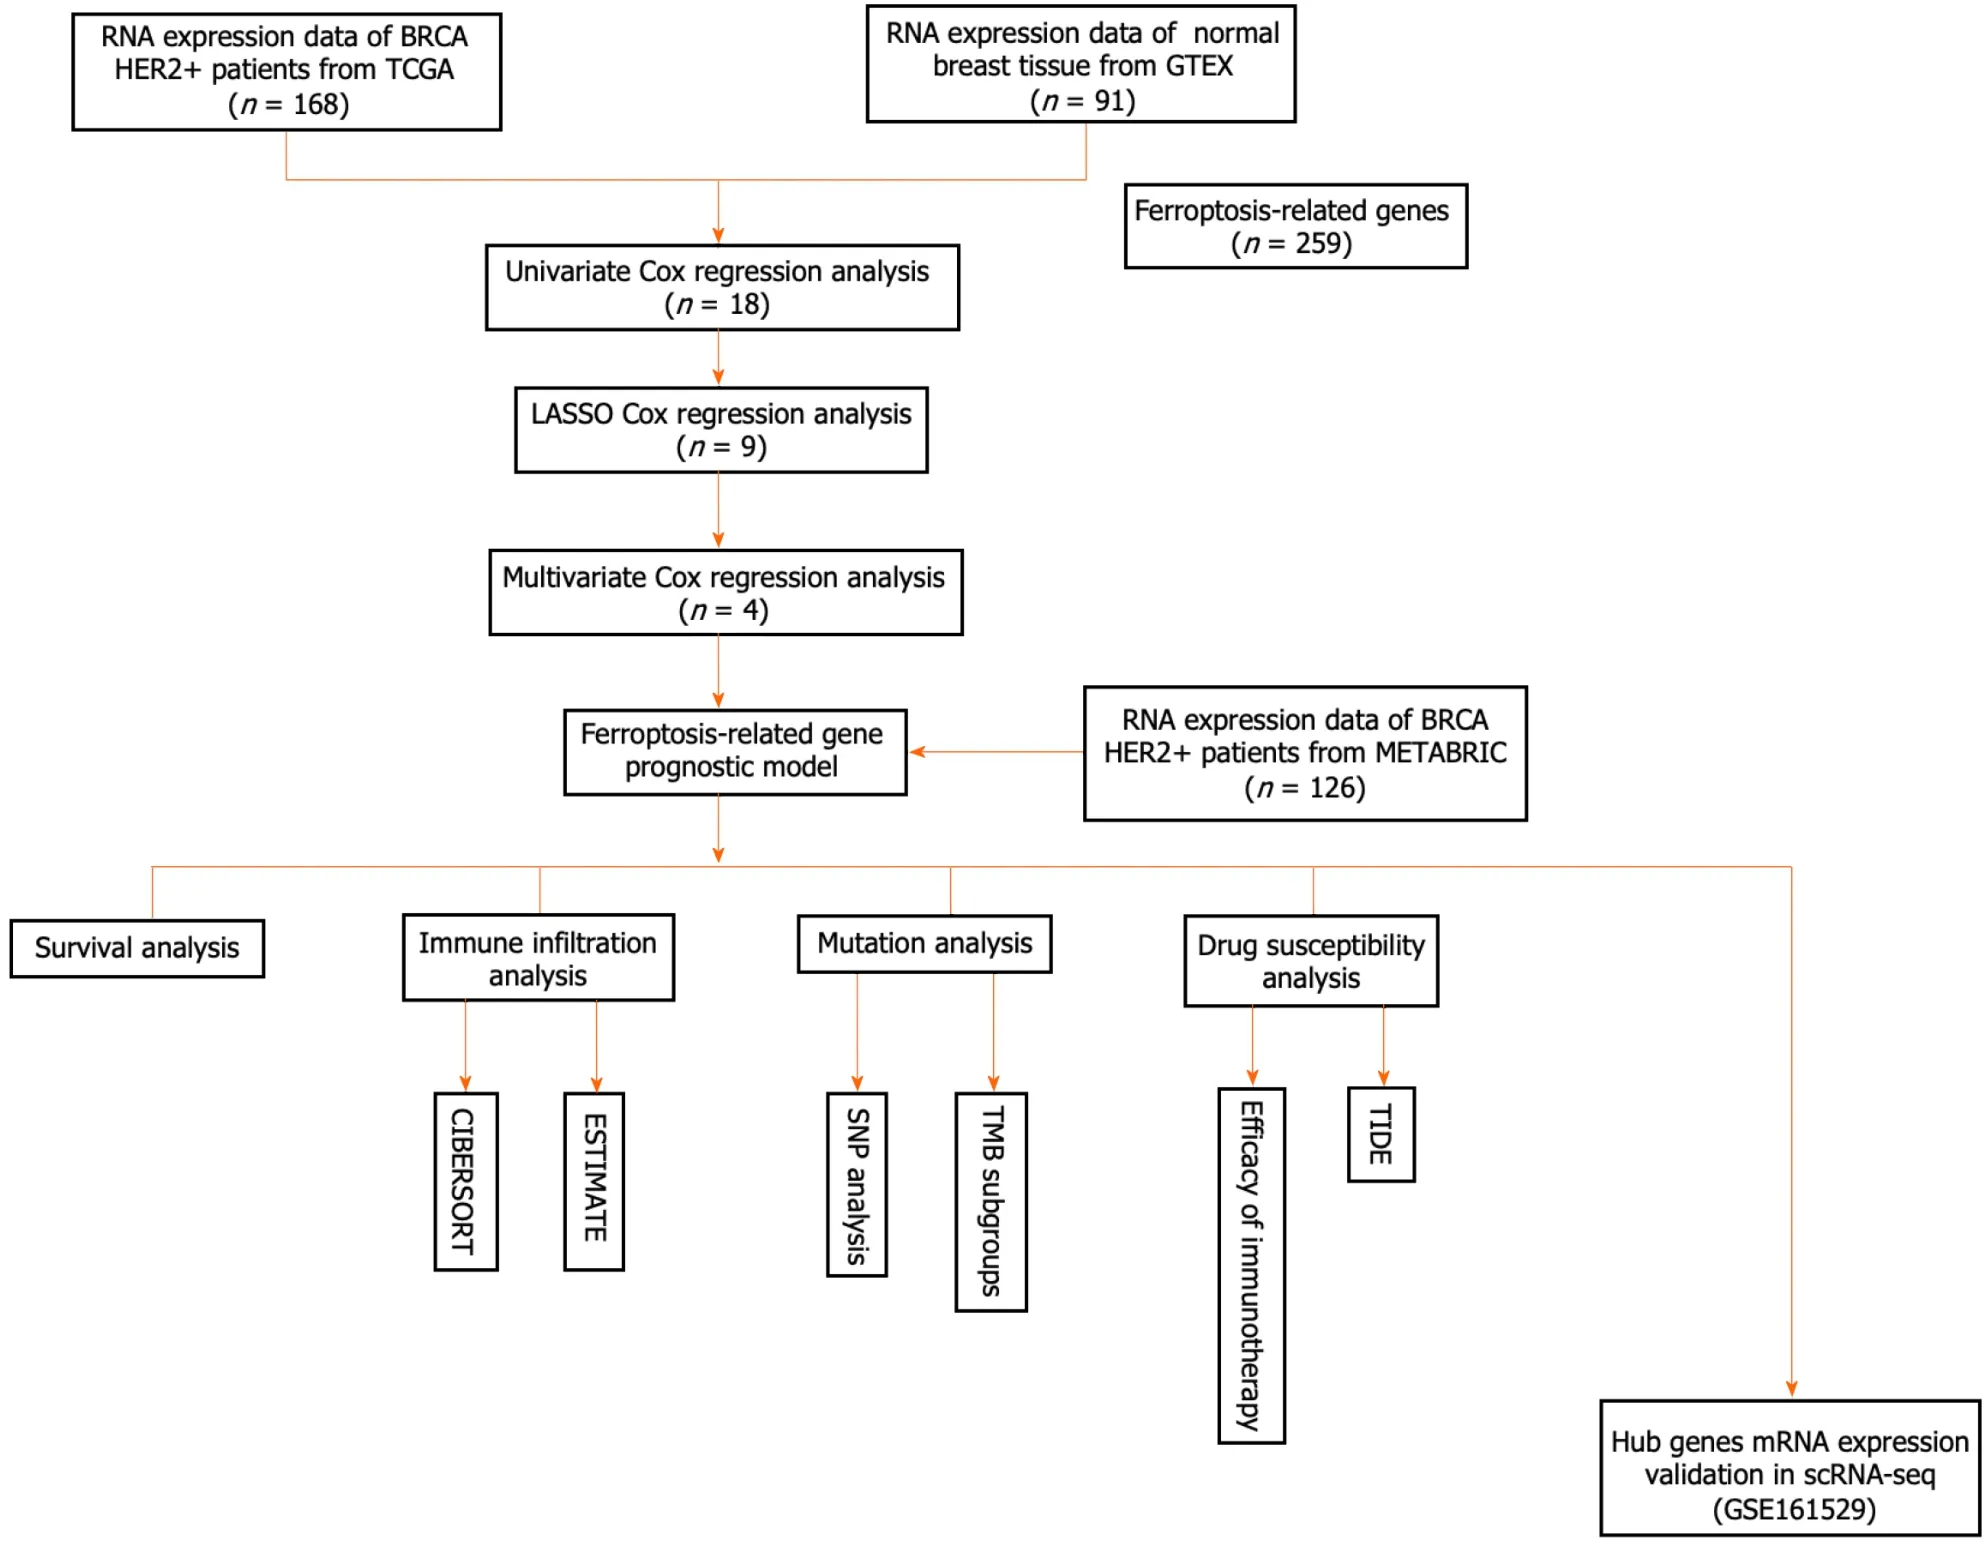
Figure 1 Flowchart for collecting and analyzing data from TCGA and METABRIC databases. scRNA-seq: Single-cell RNA sequencing;TMB: Tumor mutation burden.
Characterization of the ability of the ferroptosis risk score to predict HER2+ BC prognosis
The ferroptosis-related gene expression profiles of the patients in the high-and low-risk groups are displayed in a heatmap (Figure 2A).In addition,the volcano plot showed 5481 upregulated genes and 3766 downregulated genes in tumor tissues (Figure 2B;P<0.05).A total of 128 genes were differentially expressed in ferroptosis and tumor tissues(Figure 2C).Of the 128 ferroptosis-related genes,18 were identified using the univariate Cox regression model as significantly associated with patient OS (P<0.05).The results are shown as forest plots (Figure 2D).Lasso-penalized Cox regression analysis was further conducted to limit the scope of the gene screening (Figure 3A).The nine candidate gene markers had the best lambda values (Figure 3B).Finally,multivariate regression analysis revealed that four DEGs were significantly correlated with OS.
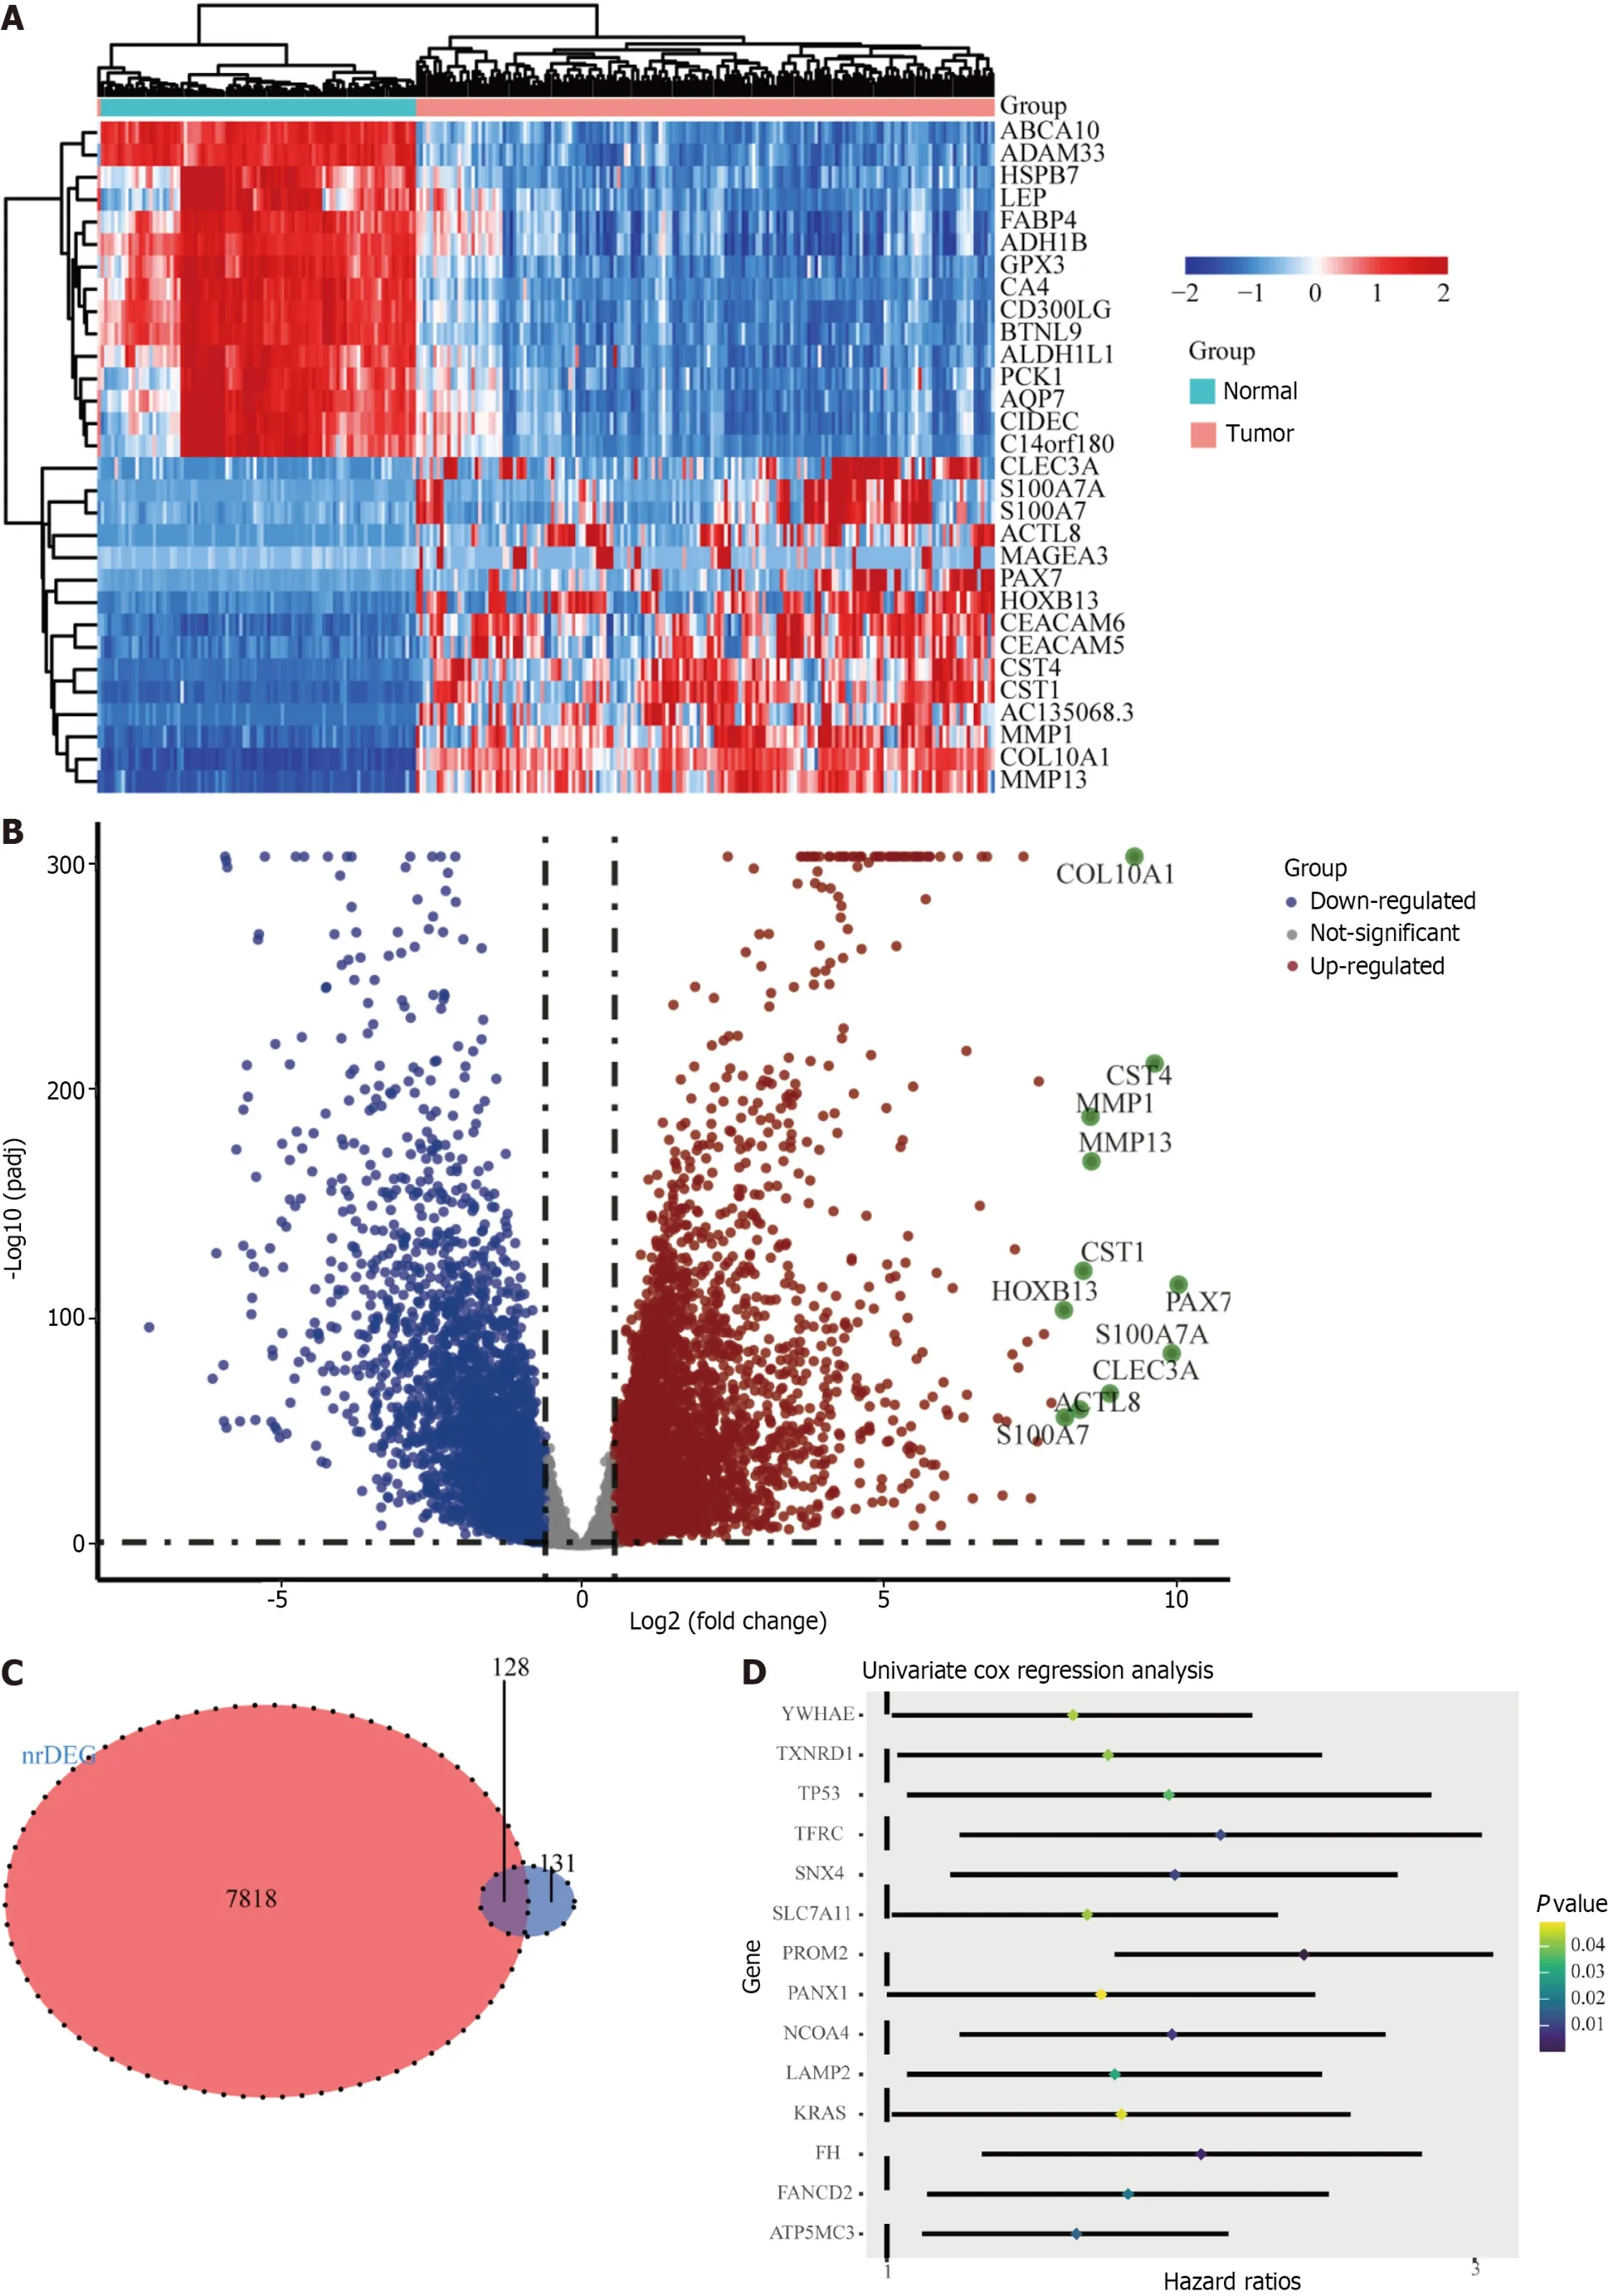
Figure 2 Identification of candidate genes associated with ferroptosis in the TCGA cohort.A: Heatmap of candidate gene expression differences between tumor and normal tissues;B: Volcano map showing up-regulated and down-regulated genes;C: A Venn diagram to identify differentially expressed genes associated with ferroptosis between tumor and normal tissues;D: Forest plot showing univariate Cox regression analysis results of correlation between candidate gene expression and overall survival.

Figure 3 Prognostic analysis of four ferroptosis-related gene signature models in the TCGA cohort. A: The optimal lambda resulted in nine nonzero coefficients;B: The partial likelihood deviation curve was plotted vs lambda;C: Risk curves were plotted in the TCGA cohort;D: Kaplan–Meier curves for the overall survival of patients in the high-risk and low-risk groups in the TCGA cohort;E: The area under the curves of time-dependent receiver operating characteristic curves verified the prognostic performance of the risk score in the TCGA cohort;F: T-SNE analysis of the TCGA cohort.OS: Overall survival.
With respect to the TCGA cohort,a risk score was developed to determine the predictive power of the 4 genes associated with ferroptosis.The risk score was calculated using the formula below: Risk score=1.05 × expression level ofPROM2+0.532 ×SLC7A11+0.447 ×FANCD2+0.453 ×FH.Patients were classified into high-risk (n=84) and low-risk (n=84) groups based on the median risk score cutoff (Figure 3C;Table 1).
According to K-M curves,patients in the TCGA cohort with lower risk scores had better prognoses (Figure 3D;P<0.05).Using time-dependent ROC curve analysis,the area under the curve (AUC) was evaluated.The AUCs of the four ferroptosis-related genes at 3,5,and 8 years were 0.797,0.770,and 0.664,respectively (Figure 3E),with the third year having the most significant AUC.These four genes are anticipated to be associated with OS.Patients in different risk groups were dispersed in both directions according to the t-distributed stochastic neighbor embedding (t-SNE) analysis(Figure 3F).
External validation of the prognostic gene signature
We chose the independent database METABRIC for validation to confirm the ability of the four-gene signature to predict survival.The patients were divided into high-risk and low-risk groups using the same algorithm used for the TCGA cohort (Table 1,Supplementary Figure 1A).Those in the high-risk group demonstrated significantly worse OS than did those in the low-risk group (Supplementary Figure 1B,P<0.05),consistent with the findings in the TCGA cohort.The AUC for 3-,5-,and 8-year OS were 0.653,0.648,and 0.560,respectively (Supplementary Figure 1C).Additionally,T-SNE analysis verified that the two patient subgroups spread in opposite directions (Supplementary Figure 1D).These findings showed that the four-gene signature could accurately predict OS in patients with the HER2+subtype of BC.
Independent prognostic role of the gene signature
Patients with complete data,including age,stage,radiation therapy,and risk score,were enrolled for additional analysis.The risk score was identified as a significant prognostic risk factor in the TCGA cohort [P<0.001,hazard ratio (HR)=2.72,95%CI=1.889-3.912] and in the METABRIC cohort (P<0.001,HR=1.17,95%CI=1.024-1.337) by univariate Cox analysis (Figure 4A).The risk score was also found to be an independent predictive factor for OS in the TCGA cohort (P<0.001,HR=2.62,95%CI=1.815-3.785) and the METABRIC cohort (P<0.001,HR=1.16,95%CI=1.011-1.322) according to multivariate Cox regression analysis (Figure 4B).Consequently,the risk score derived from the four-gene profile was an independent prognostic factor.

Figure 4 Results of univariate and multivariate Cox regression analyses. A: Results of the univariate and multivariate Cox analyses of overall survival(OS) in the TCGA derivation cohort;B: Results of univariate and multivariate Cox analyses of OS in the METABRIC derivation cohort.aP <0.05,bP <0.01,cP <0.001.HR: Hazard ratio.
Constructing and validating a predictive nomogram
We subsequently developed a nomogram employing three independent prognostic parameters,cancer stage,age,and risk score,to predict 3-,5-,and 8-year OS in 168 HER2+BC patients (Figure 5A).The calibration plot showed that the nomogram might under-or overestimate mortality (Figure 5B).The C-index of the model,which considered risk score,age,and stage,was 0.87 (Figure 5C).In addition,we repeated these steps in the METABRIC cohort to validate the efficacy of the training cohort.It is important to note that there was significant agreement between the predicted and observed survival rates,suggesting that the nomogram has excellent predictive value (Supple-mentary Figure 2).

Figure 5 The four ferroptosis-related prognostic gene signature models for predicting 3-,5-,and 8-year overall survival in HER2+breast cancer patients. A: Independent risk factors were used to build a risk estimation nomogram to predict the probability of overall survival in HER2+breast cancer patients;B: Calibration plots for 3-,5-,and 8-year survival probabilities in the TCGA cohort;C: Restricted mean survival time Curve in the TCGA cohort.aP <0.05,bP<0.01,cP <0.001.OS: Overall survival;RMS time: Restricted mean survival time.
Immune-related characteristics in the low- and high-risk score groups
The four-gene signature may be correlated with the immunological characteristics of cancer patients,providing future guidance for immunotherapy for HER2+BC patients.A significant association between the risk score and essential immune cell infiltration or immunological aspects was assessed using the CIBERSORT algorithm.We discovered that the high-and low-risk groups had distinct immune cell infiltration rates.The infiltration of M2-type macrophages,activated dendritic cells,and eosinophils was greater than that of CD8+T cells and resting mast cells in the high-risk group(Figure 6A).We also constructed heatmaps to evaluate the correlation between immune cells and prognostic genes(Figure 6B).In the present analysis,the ESTIMATE score also revealed higher immune,stromal,and ESTIMATE scores in the low-risk subgroup than in the high-risk subgroup (Figure 6C-E).In addition,the distribution of immune-related signal transduction pathways was significantly different between the two risk subgroups,with lower infiltration of cytokine receptors,cytokines,the BCR signaling pathway,interleukin receptors,antimicrobials,chemokines,interleukins,T cell receptor signal transduction pathways and tumor necrosis factor receptors in the high-risk subgroup(Figure 6F).

Figure 6 The immune-related analysis of the four ferroptosis-related prognostic gene signature models in HER2+breast cancer. A: The Immune cells infiltration of differential risk groups in TCGA;B: Heatmaps represent the correlation between immune cells and prognostic genes;C-E: The immune,stromal,and estimate scores were significantly distinct statistically between low-and high-risk subgroups;F: Expression of immune cell pathways in low-and highrisk subgroups;G:The seven well-known immune checkpoint genes were differentially expressed between low-and high-risk subgroups;H: Correlation chord diagram of 7 immune checkpoints.aP <0.05,bP <0.01,cP <0.001.
Our analysis also included genes related to immune checkpoints,PD-1 (PDCD1),BTLA,TIGIT,GZMA,HLA-DRA,HLA-DPB1,and CD40.The expression of these seven well-known immune checkpoint genes varied between the low-and high-risk groups.Figure 6G indicates that immune checkpoint mRNA expression was decreased in HER2+BC patients with higher risk scores.In addition,there was a significant positive correlation between the mRNA levels of the seven immune checkpoint receptors (Figure 6H).
Relationships between risk groups and mutation profiles
SNP analysis was performed on 155 samples comprising 80 samples in the high-risk group and 75 samples in the low-risk group,with significant mutation frequency genes screened out using the “MAFtools” package.Supplementary Figure 3A and B lists the top 10 mutated genes in samples from the high-and low-risk groups,with TTN and TP53 mutations being the most frequent in the two groups.Supplementary Figure 3C and D lists the top 20 genes in the sample,revealing that the most significant mutation types were missense,nonsense,missense,and multihit mutations.In patients,TP53,PIK3CA,and TTN were strongly associated with the development of HER2+BC.
We also extracted the TMB subgroups in the high-risk and low-risk groups.We found a positive correlation between risk score and TMB (P<0.01;Figure 7A and B).However,there was no significant difference in the TMB between the two risk groups (Figure 7C).Therefore,to explore whether combining the TMB and risk score provides better predictive ability,we combined the TMB and risk score to form a new subgroup.Kaplan-Meier survival curves for the new subset revealed significant differences in survival outcomes.The prognosis was worst for patients with HRisk-HTMB but best for those with LRisk-LTMB (P<0.0001;Figure 7D).
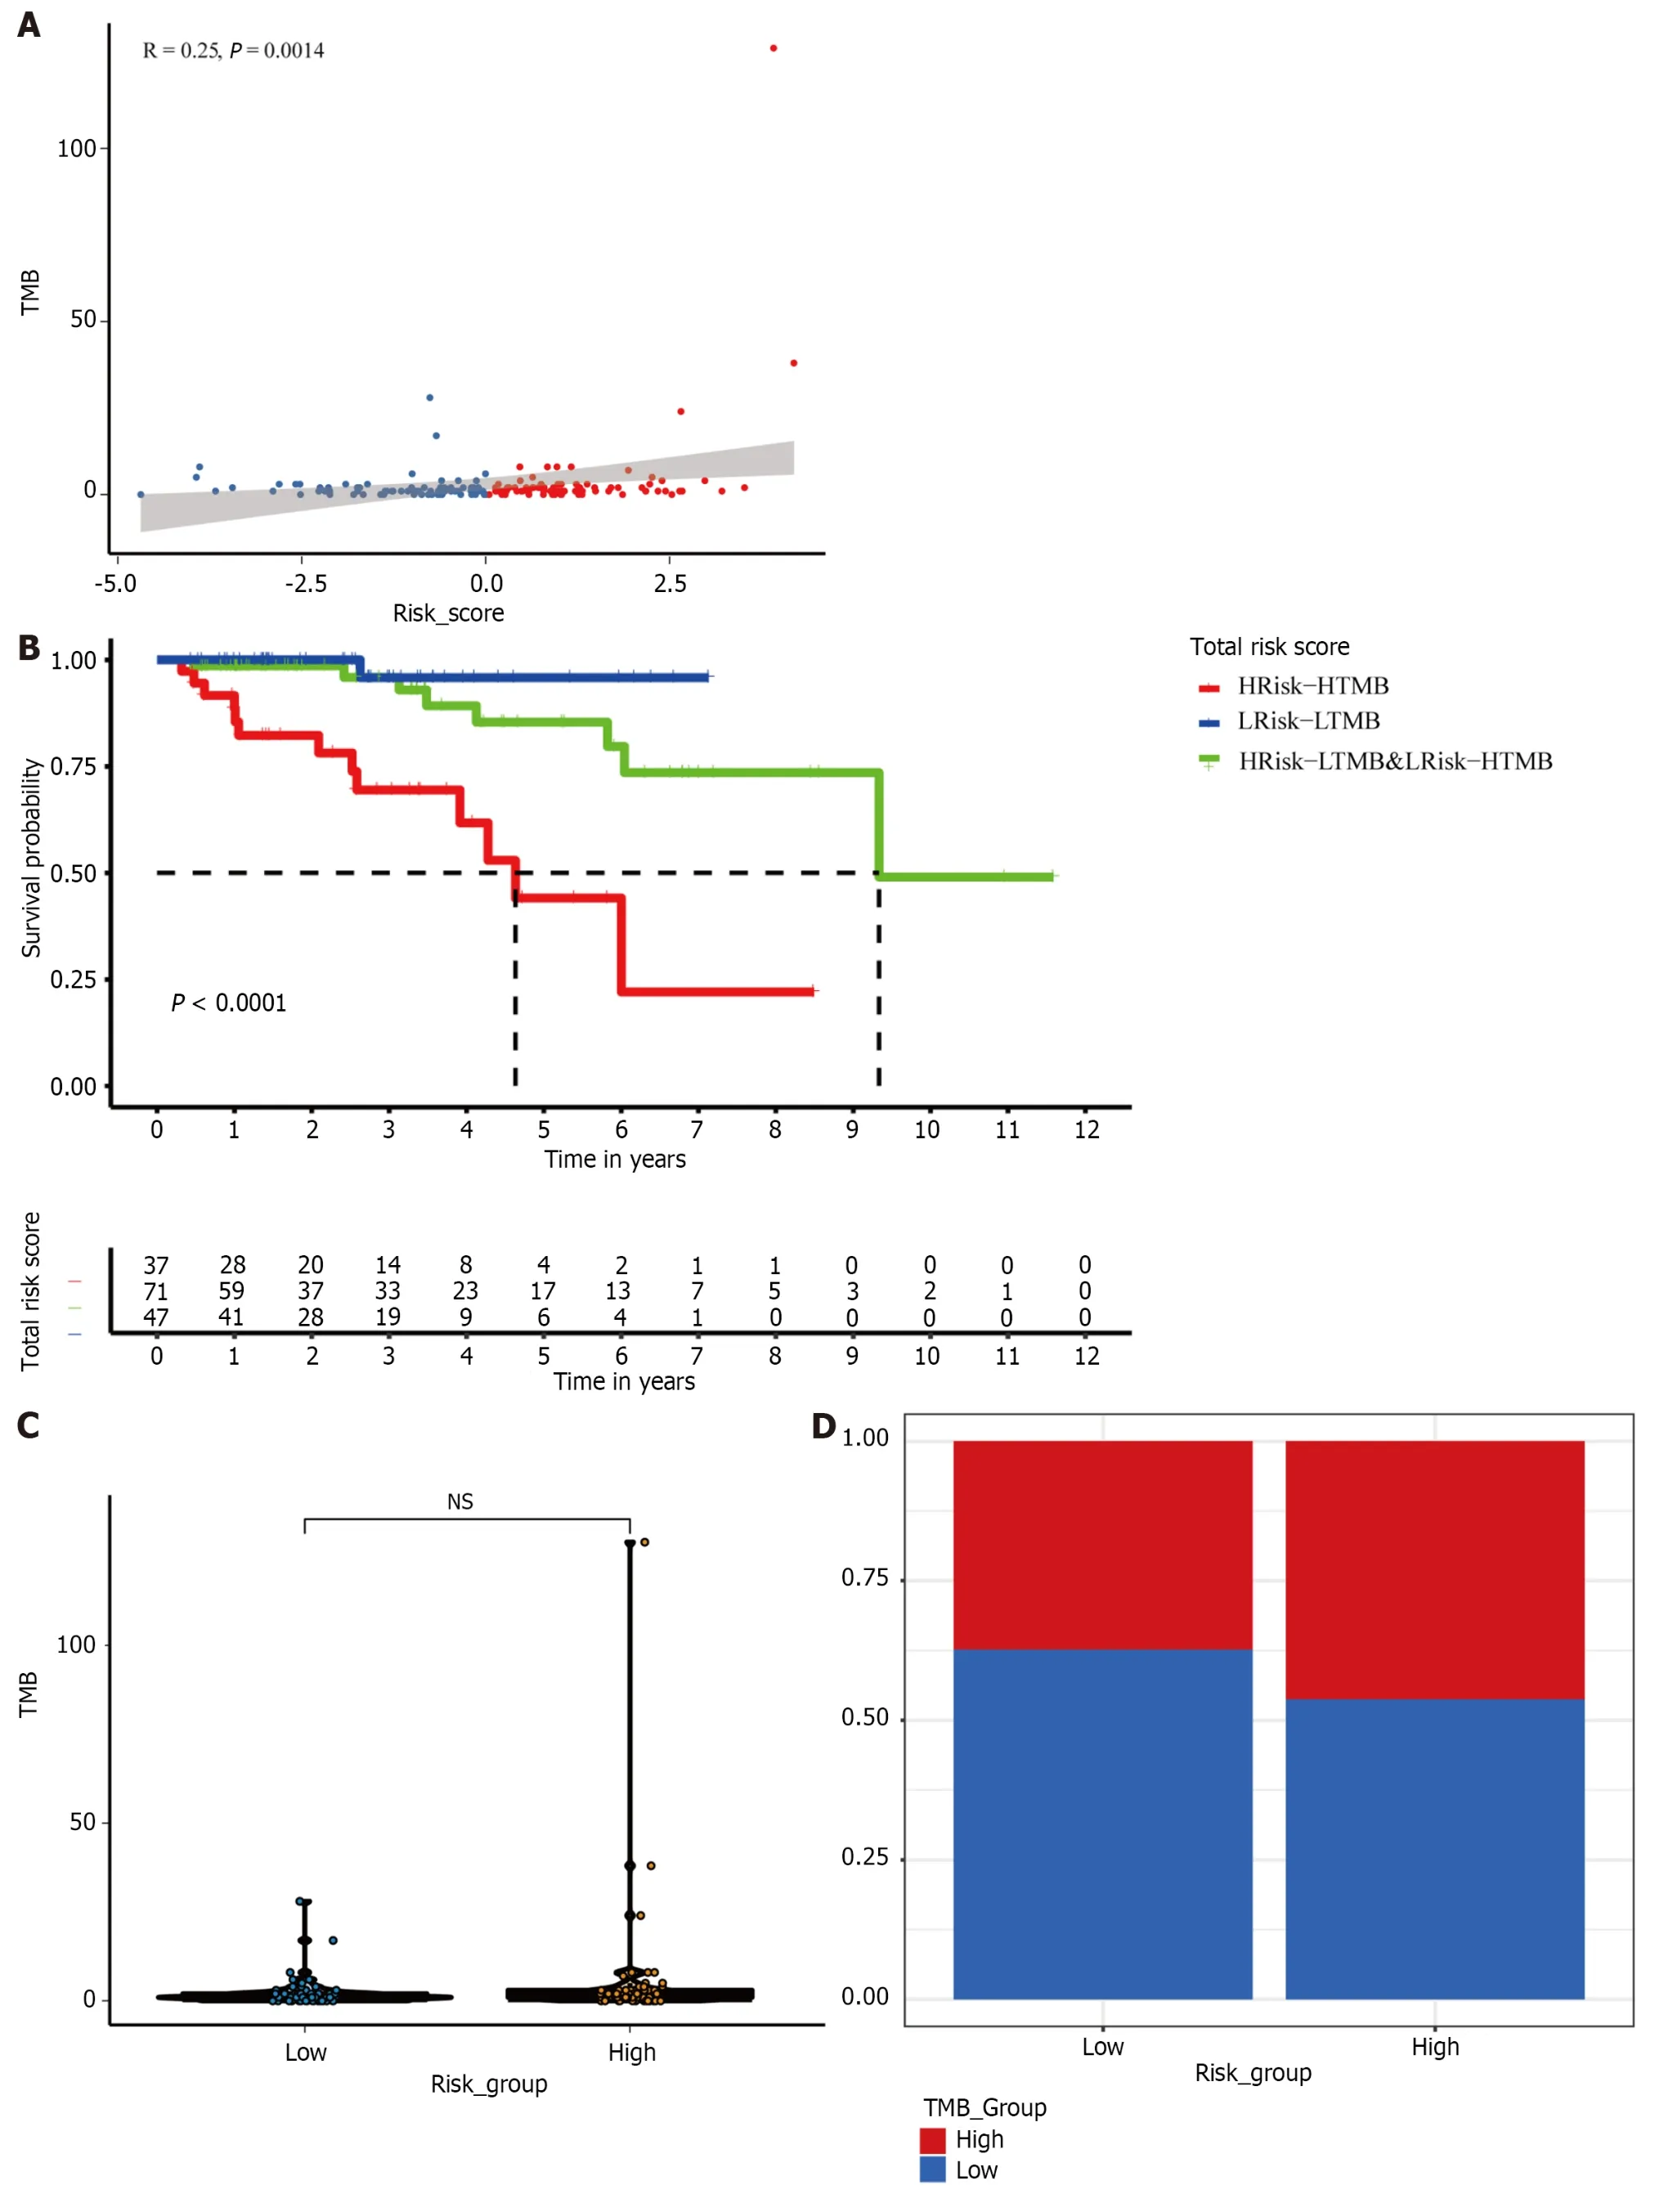
Figure 7 The mutation profile of different subgroups in the TCGA cohort. A: Relationship between tumor mutation burden (TMB) and risk scores;B:Relationship between TMB groups and risk groups;C: TMB in low-and high-risk subgroups;D: Kaplan–Meier survival analysis of a new subset in a cohort of HER2+breast cancer patients combined with the risk group and TMB.TMB: Tumor mutation burden;NS: Not significant;BC: Breast cancer.
Drug sensitivity analysis
We then extracted data on 138 drugs from the GDSC database and analyzed patient sensitivities to 138 medications between the high-and low-risk cancer groups.We found 13 drugs with significantly different sensitivities between the two risk groups (Supplementary Figure 4;P<0.05).
Hub gene mRNA expression validation via scRNA-seq
The scRNA-seq dataset (GSE161529) was used to characterize HER2+BC heterogeneity from the GEO database.After gene filtering and normalization,the “Seurat” package of the FindCluster function was used to cluster cells into 42 clusters (Figure 8A and B).The identified clusters were labeled as cell types using marker genes (Supplementary Table 3).We ultimately annotated these clusters into three main clusters (Figure 8C,Supplementary Table 4),and Figure 8D shows the proportions of cell types in patients and healthy individuals.According to the scRNA-seq analysis,Figure 8E-H demonstrates that the identified prognostic genes were primarily expressed in epithelial cells.Differences in the expression of the four marker genes between healthy controls and patients were further verified in epithelial cells.Specifically,PROM2,SLC7A11,andFANCD2but notFHwere significantly differentially expressed,indicating that these genes were expressed in cancer epithelial cells (Table 2).However,theSLC7A11results did not correspond to the trend observedviaBulk RNA-seq.This difference is most likely related to the somewhat small sample size.
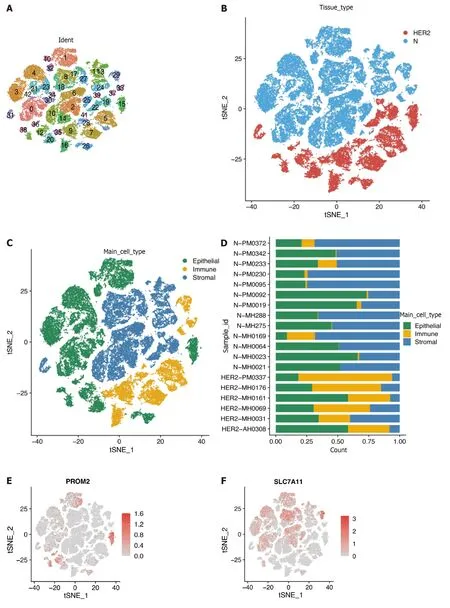
Figure 8 Overview of single cells from tumor samples and standard samples. A: Umap of 42 cell clusters;B: Umap of two different types of samples;C: Marker genes identified cell types;D: Proportion of cell types in patients' and normal people's samples;E-H: Expression of essential marker genes.
DISCUSSION
Ferroptosis is a type of cell death distinguished by iron-dependent lipid peroxidation.It interferes with the progression of tumors,neurological diseases,and chronic inflammatory diseases.There has been much research recently on the role and mechanisms of ferroptosis under various conditions,particularly in the tumor research and treatment domains.Ferroptosis pathway activation increases the susceptibility of cancer cells to chemotherapy.One study demonstrated the importance of ferroptosis in tumor therapy by showing that combining the ferroptosis inducer erastin with cisplatin can significantly boost antitumor efficacy[14].Using ferrostatin-1 (a ferroptosis inhibitor) knockdown,Chenet al[15] reported that cystine (Cys) starvation induces ferroptosis in TNBC cells[15].Therefore,ferroptosis could advance our understanding of tumor suppressors and reveal new therapeutic targets.From the perspective of different BC subtypes,the incidence of HER2+BC varies little among different ethnic groups.Therefore,the results of this study have particular applicability to various ethnic groups[16].Systematic and comprehensive analyses of ferroptosis are lacking to support malignant progression and treatment elucidating strategies for HER2+BC.
This study systematically investigated the potential mechanisms of action of 259 iron death-associated genes in HER2+BC patients.Four ferroptosis-related genes were included in the new prognostic model,and the validity of the model was tested in an external cohort.The association of these genes with OS was also explored.In addition,the immune microenvironment and mutations were enriched in our study.Nearly half of the iron apoptosis-related genes (129/259) were differentially expressed between 91 normal cells and 168 HER2+cells,18 of which were associated with OS according to univariate Cox regression analysis.Finally,a four-gene signature was obtained from the model using LASSO regression analysis and multivariate Cox regression analysis.These results demonstrated that iron-induced cell death plays a significant role in HER2+BC patients,and prognostic features based on iron-induced cell death-related genes could be constructed.
Four ferroptosis-related genes were included in the prognostic model in this investigation.PROM2,SLC7A11,FANCD2,andFHwere highly expressed in HER2+BC patients.The expression levels of these genes were positively correlated with patient survival risk.Previous studies have shown that iron,lipid,and antioxidative metabolism are the three key pathways regulating iron-related apoptosis[17].In addition,energy metabolism is associated with iron-related apoptosis.Consistent with our four-gene prognostic model,PROM2,SLC7A11,andFANCD2were previously reported to be involved in iron metabolism[18,19].ThePROM2gene is significantly upregulated in tumor tissues.PROM2contributes to iron transport and the inhibition of iron death by forming iron-containing multivesicular bodies and exosomes in BC cells[11,20].SLC7A11is an essential component of the glutamate/Cys antiporter (also known as xCT).SLC7A11increases glutathione production and Cys absorption,reducing oxidative stress and iron cell death[21].Depletion ofSLC7A11significantly reduces glutathione concentrations and triggers iron-related apoptosis.In addition,SLC7A11is a central target of iron death regulation,and at high concentrations,it downregulates sensitivity to iron death in cancer cells[22,23].BothPROM2andSLC7A11are regulated by GPX4,which increases the amount of peroxyl radicals required for lipid peroxidation,causing iron death.The regulation ofFANCD2gene expression helps maintain normal DNA replication,which prevents cancer progression by influencing the iron-related death process[24,25].FANCD2expression correlated with the characteristics of aggressive cancer: HER2 amplification,hormone receptor negativity,elevated p53 expression,proliferation,and high grade[26].Several studies have demonstrated the positive association betweenFANCD2and Ki-67 expression in BC cells[27].Furthermore,highFANCD2expression could independently predict a poor prognosis in patients in the sporadic BC cohort[28].The fumarate complex enzymeFHbelongs to three TCA cycle enzyme families.Some studies have indicated that theFHdouble allele is inactivated in BC patients and that mutations in theFHgene may affect the progression of BC[29,30].The role of these genes in inducing iron-related death in HER2+BC patients needs further investigation,as few relevant studies have reported the regulatory function of these genes.Moreover,the patterns of the relationships among TMB,risk score,and the combination of TMB grouping and risk grouping indicated the synergistic effect of TMB and the risk score in prognostic stratification.These findings may provide new insight into cancer prognosis.
The treatment landscape for HER2-positive BC has undergone significant advancements in recent years.A comprehensive understanding of tumor biology and the intricate signaling pathways associated with HER2 has played a pivotal role in developing novel therapeutic strategies to improve patient outcomes.Prominent among these emerging approaches is dual-HER2 inhibition utilizing monoclonal antibodies,exemplified by the combination of trastuzumab and pertuzumab.Additionally,antibody–drug conjugates,including T-DM1 and trastuzumab–deruxtecan[31],and TKIs,such as tucatinib and neratinib,have emerged as promising therapeutic options[32,33].In this study,we selected 13 drugs from a list of 138 drugs by analyzing and visualizing their IC50s in high-risk and low-risk groups;these drugs included bibw2992 (afatinib) and ABT.263 (navitoclax),which have been previously reported to be effective treatments for HER2 +BC[34,35].Bibw2992 (afatinib) is a tyrosine kinase and an irreversible blocker of the ErbB family[36].It has been reported to be necessary for treating HER2+BC[34,37].Abt.263 (navitoclax) is a small molecule Bcl-2 inhibitor that induces apoptosis and treats HER2+BC by blocking the interaction of Bcl-2 and Bcl XL with apoptotic precursor proteins[35].Vinorelbine is an antimitotic semisynthetic drug that acts primarily by binding to tubulin,causing cells to become disorganized within microtubules during mitosis.It has been reported in the relevant literature that this approach is an effective treatment for metastatic BC.Vinorelbine is commonly used in combination therapy with trastuzumab and pyrotinib in HER2+BC[38,39].A-443654 is a potent pan-Akt inhibitor that has been reported to prolong survival in patients with HER2+BC when combined with other medicines[40].A c-Jun N-terminal kinase inhibitor called JNK.Inhibitor.VIII (TCS JNK 6o) inhibits invasive BC by reducing JNK activity.It can be used in combination with lapatinib[41].
CONCLUSION
In conclusion,our study developed a novel,previously unreported four-gene signature-associated prognostic model,which may be a useful prognostic classification tool for HER2+BC patients.These genes were correlated with OS in the training cohort,and the association was confirmed in the validation cohort.A nomogram that combined our predictive signature with traditional clinical factors such as age and clinical stage performed noticeably better.As a result,the nomogram we developed can successfully direct clinical practice and help build a more individualized clinical follow-up approach.
In addition,some limitations relevant to our study should be noted.First,only four prognostic genes from the TCGA database were used to calculate the prognostic risk score;their somatic mutations or methylation status should have been considered.Second,the sample size of the single-cell expression data was relatively small;future analyses with larger sample sizes are needed to validate and explore the present results.Third,the database lacks targeted therapy information within its clinical data,limiting its contents to radiotherapy and chemotherapy information exclusively.However,the mechanism underlying the four-gene signature and its therapeutic implications for treating HER2+BC require further study.
ARTICLE HIGHLIGHTS
Research background
Our study identified a 4-gene model that,when combined with the tumor mutation burden (TMB) score,may have critical implications for clinical medical decisions and personalized treatment of patients with HER2-positive breast cancer.
Research motivation
This study aimed to identify and evaluate fresh ferroptosis-related biomarkers for HER2+breast cancer (BC).
Research objectives
Identifying reliable prognostic biomarkers can direct clinical practice and help develop a more individualized clinical follow-up approach.
Research methods
The prediction model was constructed using data from the TCGA and METABRIC databases.Subsequently,patients were categorized into high-risk and low-risk groups according to their median risk scores,independent predictors for overall survival (OS).We investigated immune infiltration,mutations,and drug sensitivity across risk groups.Moreover,we integrated tumor mutational burden (TMB) with risk scores to assess patient prognosis.Finally,we analyzed vital gene expression through single-cell RNA sequencing (scRNA-seq) in cancerous and normal epithelial cells.
Research results
Our model helps guide the prognosis of HER2+breast cancer patients,and its combination with the TMB can aid in more accurate assessment of patient prognosis and provide new ideas for further diagnosis and treatment.
Research conclusions
By analyzing the RNA expression data of HER2-positive breast cancer patients,we constructed a risk score model (PROM2,SLC7A11,FANCD2,andFH) for ferroptosis and evaluated the relationship between the high-risk score and patient prognosis.We verified that the high-risk group was associated with poorer immune infiltration and a greater tumor mutation load.By combining the risk score with the TMB,we found that patients with a high TMB-score had the worst prognosis,while patients with a low TMB-score had the best prognosis.
Research perspectives
The prediction model was constructed using data from the TCGA and METABRIC cohorts.Patients were subsequently categorized into high-risk and low-risk groups according to their median risk score,an independent predictor of overall survival.We investigated immune infiltration,mutations,and drug sensitivity across risk groups.Moreover,we integrated the TMB with risk scores to assess patient prognosis.Finally,we analyzed vital gene expression through single-cell RNA sequencing in cancerous and normal epithelial cells.
FOOTNOTES
Author contributions:All authors participated in the conception and design of the study;conceptualization: Shi JY,Zhang YF,Wang LX;Methodology: Wen R,Shi JY,Formal analysis and investigation: Wen R,Hou SJ,Shi JY,and Che X;Writing -original draft preparation:Feng YQ and Xi YJ;Writing -review and editing: Liu SJ and Lv WH;Funding acquisition: Zhang YF;Resources: Zhang YF;Supervision:Zhang YF and Wang LX;All authors read and approved the paper.
Supported byThe Science and Technology Commission of Shanxi province,No.201901D111428.
Institutional review board statement:The study was reviewed and approved by the Shanxi Provincial People's Hospital Institutional Review Board,Approval No.2022-240.
Informed consent statement:All study participants or their legal guardians provided informed written consent before enrollment.
Conflict-of-interest statement:All the authors report no relevant conflicts of interest for this article.
Data sharing statement:The public datasets to support the results can be obtained from TCGA (https://portal.gdc.cancer.gov/),METABRIC (www.cbioportal.org/),GTEx (https://gtexportal.org/home/datasets),FerrDb (http://www.zhounan.org/ferrdb/current/),GDSC (https://www.cancerrxgene.org/celllines) and GEO database (https://www.ncbi.nlm.nih.gov/geo/).
Open-Access:This article is an open-access article that was selected by an in-house editor and fully peer-reviewed by external reviewers.It is distributed in accordance with the Creative Commons Attribution NonCommercial (CC BY-NC 4.0) license,which permits others to distribute,remix,adapt,build upon this work non-commercially,and license their derivative works on different terms,provided the original work is properly cited and the use is non-commercial.See: https://creativecommons.org/Licenses/by-nc/4.0/
Country/Territory of origin:China
ORCID number:Ya-Fen Zhang 0009-0003-6058-1177.
S-Editor:Li L
L-Editor:A
P-Editor:Zhang XD
 World Journal of Clinical Oncology2024年3期
- World Journal of Clinical Oncology的其它文章
- Current interventional options for palliative care for patients with advanced-stage cholangiocarcinoma
- Clinical application of reserved gastric tube in neuroendoscopic endonasal surgery for pituitary tumor
- Nomogram based on multimodal magnetic resonance combined with B7-H3mRNA for preoperative lymph node prediction in esophagus cancer
- Establishment of a prognosis predictive model for liver cancer based on expression of genes involved in the ubiquitin-proteasome pathway
- Transarterial chemoembolization plus stent placement for hepatocellular carcinoma with main portal vein tumor thrombosis: A meta-analysis
- PD-1 antibody in combination with chemotherapy for the treatment of SMARCA4-deficient advanced undifferentiated carcinoma of the duodenum: Two case reports