A multi-source information fusion layer counting method for penetration fuze based on TCN-LSTM
Yili Wng , Chngsheng Li ,*, Xiofeng Wng
a Nanjing University of Science and Technology, Nanjing 210094, Jiangsu, China
b State Key Laboratory of Explosion Science and Technology, Beijing Institute of Technology, Beijing 100081, China
Keywords:Penetration fuze Temporal convolutional network (TCN)Long short-term memory (LSTM)Layer counting Multi-source fusion
ABSTRACT When employing penetration ammunition to strike multi-story buildings, the detection methods using acceleration sensors suffer from signal aliasing, while magnetic detection methods are susceptible to interference from ferromagnetic materials, thereby posing challenges in accurately determining the number of layers.To address this issue, this research proposes a layer counting method for penetration fuze that incorporates multi-source information fusion, utilizing both the temporal convolutional network (TCN) and the long short-term memory (LSTM)recurrent network.By leveraging the strengths of these two network structures,the method extracts temporal and high-dimensional features from the multi-source physical field during the penetration process, establishing a relationship between the multi-source physical field and the distance between the fuze and the target plate.A simulation model is developed to simulate the overload and magnetic field of a projectile penetrating multiple layers of target plates,capturing the multi-source physical field signals and their patterns during the penetration process.The analysis reveals that the proposed multi-source fusion layer counting method reduces errors by 60% and 50% compared to single overload layer counting and single magnetic anomaly signal layer counting, respectively.The model's predictive performance is evaluated under various operating conditions, including different ratios of added noise to random sample positions, penetration speeds, and spacing between target plates.The maximum errors in fuze penetration time predicted by the three modes are 0.08 ms,0.12 ms,and 0.16 ms,respectively,confirming the robustness of the proposed model.Moreover,the model's predictions indicate that the fitting degree for large interlayer spacings is superior to that for small interlayer spacings due to the influence of stress waves.
1.Introduction
Penetration weapons are highly effective in engaging high-value targets such as deeply buried fortifications and multi-layer command centers.Within these weapons, the hard target penetration fuze plays a critical role in detecting and processing information rapidly during the penetration process.Furthermore, following a predetermined detonation control strategy, the fuze governs the timely detonation of the warhead to destroy the intended targets[1].Various initiation control strategies are employed depending on the penetration environment and targets, including delayed initiation, distance-counting initiation, and layer-counting initiation.Layer counting is a crucial function of penetration fuzes,wherein the acceleration overload signal characteristics of the fuze during the warhead's penetration into the target are utilized to identify the projectile's penetration process.This enables the initiation control of detonation points as predetermined.The advantage of this control strategy lies in the distinctive change characteristics exhibited by the overload generated during the penetration process, along with the ease of obtaining its signal.Currently,it serves as the primary detection method for hard target penetration fuzes [2].However, during high-speed penetration of multiple complex targets by the warhead, the structural response of the projectile body gives rise to numerous high-frequency oscillations that overlap with the acceleration overload signal of the fuze.Consequently, the stacking of layer counting overload signals and oscillation signals occurs.In certain scenarios, the overload signal may become obscured within the oscillation signals,leading to the fuze misjudging the number of target layers and inaccurately determining the explosion location.This significantly undermines the warhead's damage efficiency [3-6].
Presently,there are two primary approaches to address the issue of inaccurate layer counting when using acceleration sensors to penetrate multiple layers of targets.First, one can optimize the design of the acceleration sensor.Previous research [7] explored a sensor that combined switching and analog output characteristics,resulting in the effective reduction of high-frequency oscillation signals generated by the projectile.Second,signal processing can be applied to enhance the differentiation of layer-passage signals derived from the output signals of the acceleration sensor.Commonly employed methods include mechanical filtering,wavelet algorithms,integral denoising methods,and time window processing [8-10].However, these signal processing techniques require adjustments based on parameters such as the projectile body,target,and sensor.Consequently,their adaptability is limited when encountering unknown multiple targets.Furthermore,regardless of whether the approach involves optimizing sensor design or utilizing signal processing methods, it is impossible to completely eliminate the oscillation signals originating from the projectile body itself.
An approach to address the aforementioned challenges involves exploring the dynamic characteristics of different physical fields during the penetration process.Magnetic detection, an emerging target detection technology, has gained prominence due to advancements in magnetic sensor measurement accuracy and the increasing demand for high-tech military weapons development.This technology offers several advantages, including high positioning accuracy, low cost, strong discrimination capabilities, and high reliability.Magnetic detection has found applications in various domains, such as trajectory correction projectiles [11-13]and the detection and positioning of underwater ferromagnetic targets like submarines, cables, and torpedoes [14-18].Given the disturbances caused by steel bars in the target plate to the magnetic field surrounding the fuze, the utilization of magnetic detection in the field of penetration fuzes becomes viable.In 2022, our team proposed an innovative method for detecting magnetic anomaly signals during the penetration process, which served as the foundation for layer counting.Accurate layer counting was achieved by detecting changes in the geomagnetic field signals near the reinforced concrete target plate along the fuze's penetration path.The feasibility of this approach was preliminarily demonstrated through simulation and laboratory tests [19].However, in real battlefield scenarios involving the penetration of multiple layers of targets, various types of ferromagnetic materials may be present between the layers.The aforementioned method proves sensitive to interlayer ferromagnetic metals,which can significantly interfere with magnetic field detection.Therefore, it becomes necessary to integrate and leverage both the overload signal and magnetic anomaly signals to ensure reliable layer counting throughout the penetration process.
Currently, fusion algorithms can be categorized into two main types: numerical and deep learning algorithms.Numerical fusion algorithms encompass approaches such as the weighted average method[20],Kalman filter method[21],multi-Bayesian estimation method [22], and Dempster-Shafer (D-S) evidential reasoning method [23].On the other hand, deep learning methods include fuzzy logic theory[24] and neural networks.The process of a projectile penetrating a multi-layer target can be viewed as a pseudoperiodic activity that is associated with time series.Recurrent neural networks (RNNs) possess the capability to capture time series characteristics from data[25].However,RNNs are prone to the issues of gradient vanishing or exploding.To overcome these problems,long short-term memory(LSTM)networks utilize gating mechanisms and effectively capture long-term dependencies in data samples [26].Additionally, the temporal convolutional network (TCN) combines causal convolution, dilated convolution,and residual blocks to expand the receptive field, extract highdimensional features from time series, and uncover deep connections within the sample data [27].
This study integrates the strengths of TCN and LSTM networks to develop a multi-source information fusion prediction model for penetration fuzes.The model utilizes the overload signal and simulated triaxial magnetic anomaly signals of the fuze during the penetration process as input, while predicting the distance between the fuze and target plate as the output.Through this approach,a mapping relationship is established between the multisource information and the distance, enabling accurate layer counting.The fusion method proposed in this study is compared to a single network model and a single physical field layer to validate its superiority in terms of layer counting results.Furthermore, the robustness of the proposed method is confirmed through experiments involving the addition of noise to the samples and variations in working conditions.
2.Methodology
In this research,a TCN-LSTM network was employed to establish the temporal correspondence between the multi-source information and the distance between the fuze and target plate during the penetration process.By leveraging the model's temporal prediction performance, the working condition of the projectile penetration process was assessed, leading to accurate layer counting.Traditional overload layer counting methods suffer from limitations such as poor anti-interference capabilities and reliance on a single information acquisition source.To address these issues, the multisource information from the fuze penetration process was inputted into the TCN-LSTM network.This allowed for an exploration of the internal relationship between different physical quantities in the penetration process,expanding the fuze's multiphysics sensing range and enhancing the reliability of the fuze's penetration process judgment.
In this study, the axial overload signal and triaxial magnetic anomaly signals received by the fuze during the penetration process were utilized as the network input,while the distance between the fuze and target plate served as the output.The network model was trained using typical multi-layer working conditions.Fig.1 illustrates that the projectile penetration process was treated as a pseudo-periodic activity, with the central axis between the two target plates acting as the boundary.When the fuze crossed the central axis,it was considered to have entered the range of the next target plate, resulting in a decrease in the distance between the fuze and target plate.When the fuze reached the steel bar, the relative distance was considered as 0.To accommodate different working conditions, the distance between the central axis and the steel bar (representing the maximum distance between the fuze and the target plate) was defined as 1.Therefore, the process of penetrating multiple layers of targets can be viewed as a range in which the distance changes from 0 to 1.
2.1.TCN

Fig.1.Schematic diagram of the distance between the fuze and target plate during the penetration process.
TCN is a convolutional neural network (CNN) variant that incorporates three distinct structures: causal convolution, dilated convolution, and residual connection modules.Causal convolution in TCN ensures the preservation of causal relationships within the input sequence,preventing any leakage of future data.This ensures that the model's output at any given moment depends only on the current and past inputs.To address the problem of linear superposition arising from information capture, TCN introduces the dilated convolution module.Unlike standard convolution kernels,the dilated convolution kernel employs interval reading to access data, expanding the receptive field and capturing more historical information.Consequently, it can capture higher-dimensional feature information from data at various intervals.The s-th neuron of the dilated convolution can be mathematically represented by the following equation:
where*represents the convolution operation,k represents the size of the convolution kernel, d represents the dilation rate, f(i) represents the i-th element in the convolution kernel, and xs-d·irepresents the element multiplied to the convolution kernel correspondingly.
In order to address the issue of gradient vanishing during the training process, a residual module is incorporated.This module comprises two dilated convolutions, batch normalization, the dropout layer, and the rectified linear unit (ReLU) activation function, as depicted in Fig.2.The inclusion of this structure enables direct input of data across layers,mitigating excessive information loss during feature extraction.Consequently, it enhances the performance of the model and significantly improves prediction accuracy.

Fig.2.Schematic diagram of the residual module.
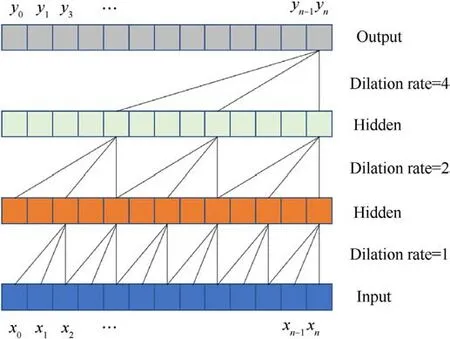
Fig.3.Schematic diagram of the dilated convolution.
Fig.3 illustrates a schematic diagram of dilated convolution with a convolution kernel size of 3.In this configuration,the output y at each time is solely influenced by the input x at the current and previous moments,effectively preventing information leakage.The first hidden layer is obtained through causal convolution of the input,employing a dilation rate of 1,which ensures that every data point is considered.The second hidden layer is generated through dilated convolution of the previously hidden layer,using a dilation rate of 2, indicating a difference of 2 in the sequence number of sampled points.Similarly, the output layer is obtained by dilated convolution of the last hidden layer,employing a dilation rate of 4,representing a difference of 4 in the sequence number of sampled points.As the number of layers increases,the dilation rate exhibits exponential growth, expanding the network's receptive field and extracting high-dimensional features from the input data with just a few layers.
2.2.LSTM network
The LSTM network was first introduced by Hochreiter et al.[28]in 1997.This network incorporates the concept of a"control gate"to enable real-time monitoring of data flow inputs,outputs, and unit states.This advancement effectively mitigates the issues of gradient vanishing and exploding encountered in traditional RNN networks.The structure of the LSTM network is depicted in Fig.4.
The network architecture depicted in Fig.4 can be partitioned into three components:the forget gate,input gate,and output gate.Here, ht-1is the hidden state of the previous moment, xtis the input of the current moment, and ct-1is the cell state of the previous moment.Based on ht-1and xt,ftdecides the information that needs to be forgotten in ct-1,and the calculation can be done using the following equation:
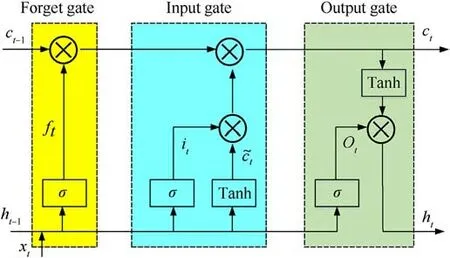
Fig.4.Schematic diagram of the LSTM network.
where σ is sigmoid activation function, while Wfand bfare the corresponding weight and offset.
Based on ht-1and xt,itand ˜ctdecide the information that needs to be updated in ct-1, and the calculation can be done as follows:
where Wiand biare the weight and bias corresponding to it;tanh is the activation function; Wcand bcare the weight and offset corresponding to ˜ct.
After updating the information in the previous cell state ct-1,the current cell state ctis obtained,and the calculation formula is as follows
here,based on ht-1and xt,Otdecides the information that needs to be fed into ct.Then, the hidden state htat the current moment is generated,and the values Otand htcan be determined as follows:
where Woand boare the weight and bias corresponding to Ot.
2.3.Construction of the TCN-LSTM network
LSTM relies on memory units to preserve its memory capacity and capture temporal dependencies in time series data.However,it exhibits limitations in acquiring high-dimensional and multi-scale features from the data.This deficiency can be addressed by integrating a multi-layer convolutional network that effectively extracts hidden high-level features within the sample data.By combining both approaches, the input sequence data can traverse the temporal convolutional layers, extracting high-dimensional features, and subsequently feeding them into the LSTM.This integration significantly enhances the processing efficiency of the memory unit.The network architecture of TCN-LSTM is illustrated in Fig.5.
The input to the network consists of continuous time series multi-source information acquired during the fuze penetration process.As the input comprises various physical quantities, it is important to normalize the features with varying dimensions.The normalized data is then processed using a sliding window approach to generate corresponding samples.In this study,a sliding window size of 16 was employed.The first residual block extracts convolutional features from the sample data using a convolutional kernel size of 3, 32 convolutional kernels, and a dilation rate of 1.These features are then fed into LSTM for further processing, and the resulting low-dimensional features serve as input to the second residual block.The second residual block applies dilated convolution with a convolutional kernel size of 3,32 convolutional kernels,and a dilation rate of 2 to extract middle-dimensional features.These features are processed by LSTM, and the resulting features are inputted into the third residual block.The third residual block employs a convolutional kernel size of 3,16 convolutional kernels,and a dilation rate of 4 to extract high-dimensional features.The high-dimensional features obtained from the last residual block are fed into LSTM,where the number of LSTM neurons is set to 128.The network architecture includes three LSTM layers followed by a fully connected layer to produce the final output.To ensure efficient convergence and proper learning,an Adam optimizer is used in this study.The parameters for the optimizer are set as follows:MaxEpochs = 250, InitialLearnRate = 0.005, and LearnRateDropPeriod = 125.
The combined network model in this study involved the calculation of multi-layer convolution.Notably, the features produced by the last convolutional layer were not trained individually.Instead, the training focused on the multi-dimensional features obtained through the multi-layer convolution process.This approach effectively leveraged the benefits of multi-dimensional features present in the data samples.Furthermore, the integration of residual blocks expanded the initial sequence information within the input to the LSTM, thereby enhancing the model's receptive field and improving its capacity to capture long-term dependencies.
3.Acquisition of multi-source signal data for penetration fuzes and feature analysis
The proposed model utilized multi-source signals as inputs,comprising the axial overload signal and triaxial magnetic anomaly signals obtained during the fuze penetration process.These signals were obtained through simulation methods, with simulation parameters selected to represent classic multi-layer penetration conditions.The selection of these parameters took into account the correlation and complementarity of different physical quantities during the penetration process.By overcoming the limitations of relying on a single signal and considering the fusion results, the model achieved layer counting decision-making.Theoretically,the sample data size is directly proportional to the performance of the trained network,while the increase in sample data size may cause increase in the running time of the simulation software.By comparisons and verifications, 50 ksps was taken as the sampling rate of overload signal and tri-axial magnetic anomaly signal in this study, that is, the time interval between two adjacent data points was 0.02 ms.
3.1.Penetration overload signal analysis
In this research,the focus was on a warhead penetrating multilayer concrete target plates,characterized by a diameter of 155 mm and a length of 0.7 m.To expedite calculations while accounting for the axial symmetry of the projectile body and target plates, a 1/4 model of the projectile target was created using LS-DYNA software.The combat guidance system is depicted in Fig.6.
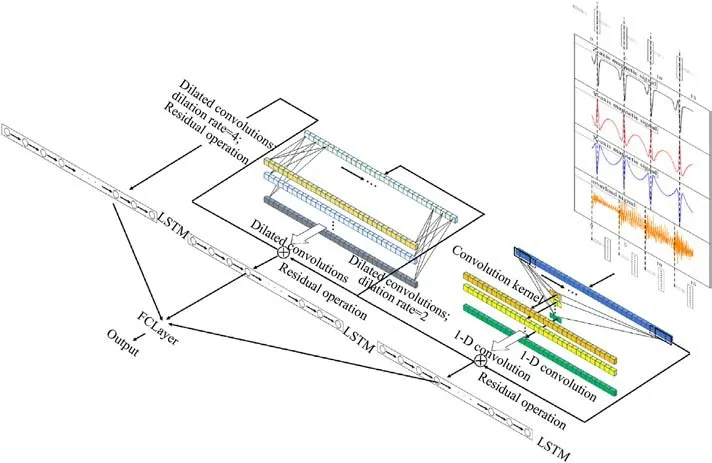
Fig.5.Architecture of the TCN-LSTM network.
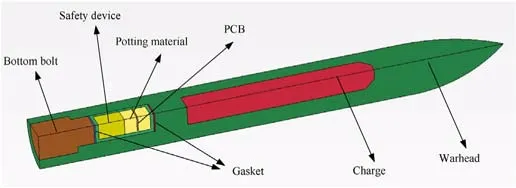
Fig.6.1/4 model of the warhead-fuze system.

Fig.7.1/4 model of the target.
The projectile was composed of various components, including the warhead, body, main charge, fuze, and bottom bolt.The fuze was simplified and comprised of the potting material, printed circuit board(PCB), and safety device.Gaskets were employed at the interface between the fuze and the projectile body to offer overload buffering.The projectile body was constructed using high-strength steel alloys: 30CrMnSiA, the fuze housing was made of aluminum alloys, and the bottom bolt was fabricated using titanium alloys.

Fig.8.Fuze overload curve at a speed of 900 m/s.
The target structure consisted of four layers of 2 m×2 m square reinforced concrete plates with a strength of C60.The initial target plate had a thickness of 300 mm,while the subsequent target plates had a thickness of 180 mm.The spacing between the target plates was set at 3 m.Fig.7 displays the 1/4 model representation of the target structure.
The material parameters of the projectile and fuze are shown in the Table 1.
The projectile successfully penetrated the reinforced concretetargets at a velocity of 900 m/s, and the acceleration signal of the tail fuze's overload is illustrated in Fig.8.

Table 1 Material parameters.
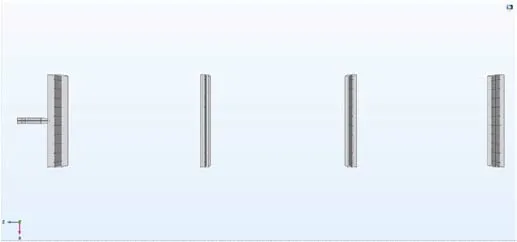
Fig.9.Schematic diagram of the projectile target model.
During the high-speed penetration of the projectile into the target plates,the overload signal of the fuze became contaminated with a significant number of high-frequency oscillation signals.This phenomenon was primarily attributed to the propagation of stress waves generated during the rapid projectile penetration, which traveled back and forth along the projectile axis.Additionally,micro-displacements and mechanical vibrations of the fuze contributed to the oscillation signals.Consequently, the overload signal encompassed a complex mixture of the true overload signal and oscillations,posing a risk of misjudgment.The maximum peaks of overload observed during the penetration of the four layers of target plates were 71,792 g, 104,201 g, 91,754 g, and 122,722 g.However, due to the propagation and overlapping of stress waves,the maximum overload peak might occur after the projectile has already penetrated the target plates.This greatly undermined the reliability of utilizing the overload threshold for layer counting and made it challenging to accurately determine the number of target layers.
3.2.Analysis of magnetic anomaly signal during penetration
The magnetic anomaly signal at the fuze during the penetration of the multi-layered target was simulated using the COMSOL software.The size, material, penetration speed, and other parameters of the projectile target model were kept consistent,with a steel bar diameter set at 12 mm.Fig.9 depicts the schematic diagram of the model.
A background geomagnetic field was incorporated into all domains of the model,with magnitudes of-3.45 μT in the x direction,32.78 μT in the y direction, and -37.71 μT in the z direction.The relative magnetic permeability of each material component is provided in Table 2.
The transient research module within the software was chosen to solve the simulation model and acquire the triaxial magnetic anomaly signals throughout the fuze penetration process, as illustrated in Fig.10.
Upon penetration of the target plate by the projectile, clear peaks were observed in the triaxial magnetic anomaly signals of the fuze, indicating distinct penetration characteristics.When the projectile hits the target, the magnetic field in the vicinity of the reinforcement is distorted due to the magnetic congregate effect of the reinforcement in the target plate.The X-axis and Y-axis directions of the fuze corresponded to the radial direction of the projectile, so the magnetic field intensity changes in these two directions were generally the same.Depending on the direction and size of geomagnetism, the fuze caused changes in different directions and size in the magnetic field intensity on the X-axis and Y-axis.Taking the X-axis magnetic field signal as an example,as thefuze approached the steel mesh, magnetic field intensity was detected.As the fuze penetrated the surface of the steel mesh,the magnetic field abruptly increased due to the weakening of the steel mesh's magnetic concentrating effect, followed by a gradual decrease.The subsequent layers exhibited a magnetic field intensity change consistent with that of the first layer.Conversely,the Z-axis, representing the axial direction of the projectile, displayed asymmetric changes in the signal.

Table 2 Relative permeabilities of simulated materials.

Fig.10.Triaxial magnetic anomaly signals of the fuze at a speed of 900 m/s.
Thus, in scenarios without interlayer ferromagnetic metal interferences, magnetic anomaly detection exhibited a notable advantage in the reliable identification of different layers.Unlike the issues of oscillation and aliasing encountered in overload signals, a distinct correspondence was observed between the variations in magnetic anomaly signals and the process of target penetration.However, a drawback of this approach was that the presence of ferromagnetic materials between the layers caused disruptions and disturbances in the magnetic anomaly signals.
4.Verification of network model performance
4.1.Data preprocessing
The model utilized the axial overload signal and triaxial magnetic anomaly signals obtained from the previous simulation of the fuze penetration process as input data.The overload signal exhibited a larger variation range compared to the magnetic anomaly signals.Training the model directly with data of different dimensions would significantly impact the effectiveness and speed of training.Thus, it was necessary to mitigate the dimensionality influence by scaling all data proportionally and compressing them within the range of [0,1].The normalization formula employed in this study is presented as follows:
4.2.Evaluation indexes of prediction performance
The evaluation criteria used in this study were the mean absolute error (MAE) and root-mean-square error (RMSE).Smaller values of these metrics indicate better alignment between the predicted results and the actual observations.The calculation formulas for MAE and RMSE are as follows
where yiand ^yiare the estimated and actual values of the output,respectively.
4.3.Model training
During range tests or in a real battlefield environment, the presence of other nearby ferromagnetic interferences can significantly disrupt the magnetic anomaly signals at the fuze.To enhance the model's generalization ability and improve its resistance to interference, Gaussian noise was introduced into the training set samples.Specifically, Gaussian noise was added to the triaxial magnetic anomaly signals when the projectile penetrated the second and third layers of the target plates.For instance, as depicted in Fig.11, a simulated scenario of a certain layer being interfered by ferromagnetic objects in an actual battlefield environment was created.The training set consisted of multi-source information from the first three penetrated layers, along with the corresponding distance between the fuze and the target plate.The test set,on the other hand,encompassed the working conditions of the final layer.
In order to investigate the ideal Gaussian noise value for model training,we employed a noise variance of 0.1,with the mean range set between 0 and 0.2,at intervals of 0.01.The prediction accuracy of the model was evaluated using the RMSE under varying mean noise values, the number of training samples of each noise is 100 and the average value of their evaluation indices is taken.The prediction accuracies corresponding to different mean values are presented in Fig.12.Notably, the model achieved the highest prediction accuracy when the mean value was set to 0.1.Consequently,the mean value of Gaussian noise incorporated into the training samples was established as 0.1.The subsequent analysis was conducted using the network model trained in this particular section.
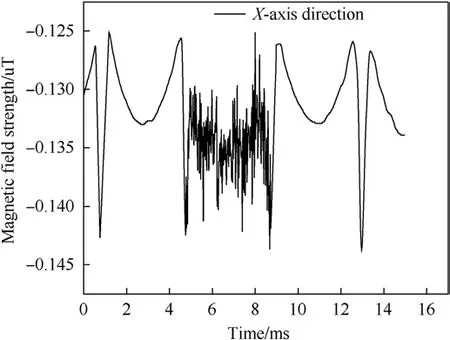
Fig.11.Schematic diagram of magnetic anomaly signals with Gaussian noise added on X-axis of the fuze.
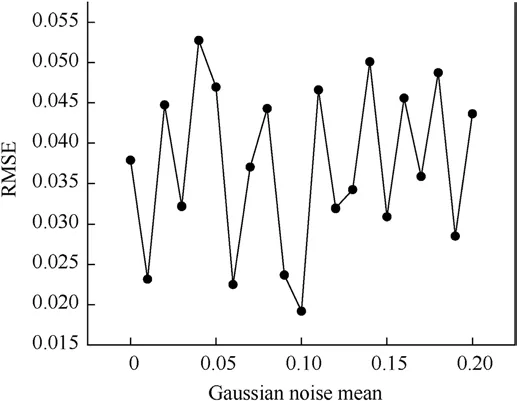
Fig.12.Model RMSE values under different mean values of the Gaussian noise.
4.4.Model performance comparison
A comparison was made between the prediction outcomes of the TCN model, LSTM model, and TCN-LSTM model.Each model underwent 100 training sessions, and the evaluation metrics were averaged.The results are illustrated in Fig.13.
It is evident that the TCN-LSTM model synergistically incorporates the strengths of both networks, enabling efficient extraction of long sequence information from the samples while retaining high-dimensional sample features.In comparison to the other two models, the proposed model demonstrated enhanced prediction accuracy.
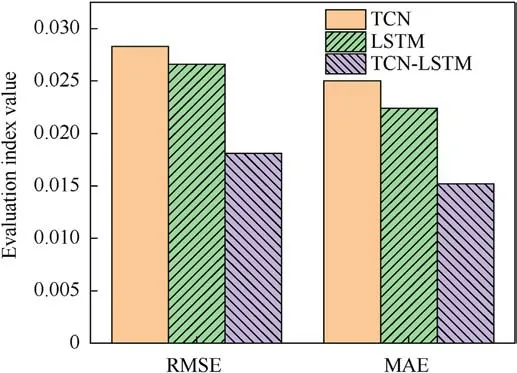
Fig.13.Histogram of evaluation indexes for the three models.
4.5.Prediction accuracy comparison between single information and multi-source information fusion
In order to validate the efficacy of the model's multi-source information fusion layer counting, this section conducted an analysis and comparison between the results obtained from multisource information fusion layer counting and those derived from single overload and single magnetic anomaly signal layer counting.Since the model was trained using the working conditions of the first three penetrated layers as samples, this section specifically focused on comparing the layer counting time for the last penetrated layer.In the case of single information, the layer counting time was determined using a thresholding method,whereby a layer was counted if it surpassed a certain threshold.
In the case of a single overload, when the detected overload surpassed the predetermined threshold [29], delay shielding was implemented using a time window before layer counting.Conversely,for the single magnetic anomaly signal,the peak of the signal typically aligned with the moment of the fuze penetrating the target, thereby enabling layer counting without the need for time window shielding.However,during the time interval in which the projectile penetrated the target,the peak times of the overload and magnetic anomaly signals did not coincide in the time domain.This study considered the moment of the fuze penetrating the target as the layer counting time.Consequently, when analyzing the layer counting time for a single overload, it was essential to convert the peak time of the overload (i.e., the time when the projectile struck the target)into the time when the fuze penetrated the target.This was accomplished by first calculating the delay time based on the length of the projectile and the penetration speed.Subsequently,the time at which the overload reached the threshold was adjusted accordingly to determine the time when the fuze penetrated the target.
The choice of threshold played a critical role in layer counting,as an excessively high threshold could lead to the omission of layers,while an excessively low threshold could result in miscounting layers.In this section, the overload threshold was determined as the average value of the maximum peaks overload of the first three layers in subsection 3.1,which amounted to 89,249 g.As illustrated in Fig.8,the overload reached the threshold at 12.26 ms during the penetration of the final layer.By considering the penetration speed at that particular moment and the length of the projectile, it was estimated that the fuze penetrated the target at approximately 13.26 ms.
Likewise, for layer counting using a single magnetic anomaly signal, the threshold was determined as the average of the maximum peaks observed in the four magnetic anomaly signals.Taking the X-axis magnetic anomaly signal as an instance, the threshold was set at-0.142 μT.Gaussian noise with a variance of 0.1 and a mean of 0.1 was introduced to the magnetic anomaly signal.The X-axis magnetic anomaly signal for the final layer is depicted in Fig.14.It is evident that the time of fuze penetration was 12.9 ms.
The model was supplied with multi-source information regarding the penetration process, and the resulting predicted distance between the fuze and the target plate is illustrated in Fig.15.This study approached the layer counting challenge by redefining it as a problem of determining the changing distance between the fuze and the target plate, ranging from 0 to 1.In an ideal scenario, a distance value of 0 indicated the fuze passing through a target layer.However, due to prediction errors inherent to the model, it was challenging to achieve a regression value of precisely 0.Therefore, it was considered that the fuze had penetrated the target when the regression value was minimized.Notably, the actual fuze penetration time was observed to be 13.06 ms, while the model's prediction, utilizing the combined multi-source information, yielded a fuze penetration time of 13.14 ms.
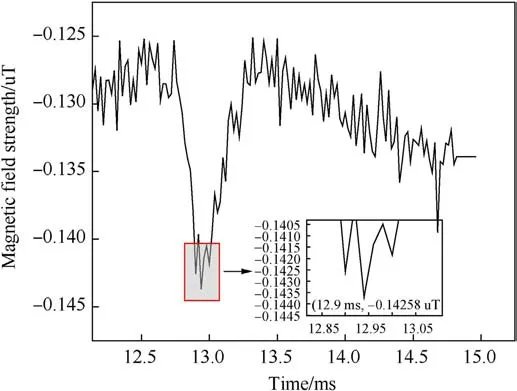
Fig.14.X-axis magnetic anomaly signal of the fourth layer after adding noise.
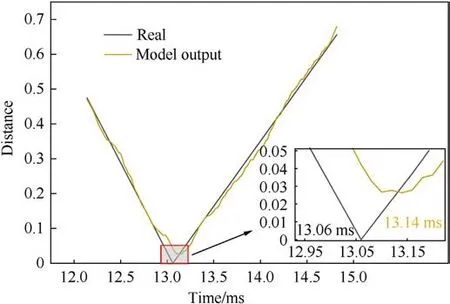
Fig.15.Predicted map of distance between fuze and target plate.
To summarize, when calculating the layer counting time, the error associated with using a single overload was 0.2 ms,while the error for a single magnetic anomaly signal was 0.16 ms.In contrast,the error reduced to 0.08 ms when employing the fusion of multisource information.The fusion method exhibited a 60% and 50%decrease in error compared to the single overload and single magnetic anomaly signal cases, respectively.This demonstrates that the reliability of layer counting through multi-source information fusion surpasses that of counting based on single information.
4.6.Model robustness analysis
4.6.1.Model robustness analysis under different noise ratios at random positions in the test set
To assess the model's resilience to electromagnetic interferences occurring during projectile penetration, Gaussian noise with varying ratios was introduced at random positions of the magnetic anomaly signal within the test set (specifically, when penetrating the final layer of the target).Both the variance and mean value of the noise were set to 0.1.The noise ratios chosen were 20%, 40%,60%,80%,and 100%of the test set.The working condition with 100%added noise corresponded to the condition outlined in subsection 4.5.The samples with the noise augmentation were then inputted into the trained model,and the resulting distances between the fuze and the target plate are illustrated in the subsequent Fig.16.
The results indicate that as the noise ratio in the magnetic anomaly signal of the test set varied, the model effectively incorporated the overload and associated magnetic anomaly signals to consistently predict the distance between the fuze and the target plate, aligning closely with the actual scenario.These findings demonstrate that the model possesses a notable capability to withstand interference,exhibiting resilience when confronted with noise inputs of varying ratios and positions.
When the noise ratio was set at 20%,40%,60%,or 100%,the fuze penetration time was recorded as 13.14 ms,resulting in an absolute error of 0.08 ms.Meanwhile, when the noise ratio was 80%, the penetration time was 13.12 ms, with an absolute error of 0.06 ms.Table 3 presents the evaluation indexes for different noise ratios.

Table 3 Evaluation indexes for prediction results under different noise ratios.
4.6.2.Model robustness analysis under different penetration speeds
To ascertain the suitability of the model across various penetration speeds,velocities of 900 m/s,1,000 m/s,1,100 m/s,1,200 m/s, and 1300 m/s were chosen.The model was supplied with penetration overload and triaxial magnetic anomaly simulation data corresponding to different working conditions.The resulting distances between the fuze and the target plate are depicted in Fig.17.
The model demonstrates notable adaptability to varying penetration speeds.Within the speed range of 900-1300 m/s,the model accurately captures the relative positions, closely resembling the actual scenario.It effectively identifies the penetration process by leveraging the multi-source signals, accommodating different speeds.At a speed of 900 m/s, the maximum error between the predicted penetration time(associated with the minimum relative distance) and the actual time was 0.08 ms.Similarly, at speeds of 1000 m/s,1100 m/s,1200 m/s,and 1300 m/s,the maximum errors between the predicted and real penetration times were 0.1 ms,0.12 ms,0.08 ms,and 0.06 ms,respectively.Table 4 showcases the evaluation indexes for different penetration speeds.Notably, the model's predictions align most closely with the actual situation at a speed of 900 m/s.This can be attributed to the network model being trained using samples with added Gaussian noise in the specific working condition of 900 m/s, resulting in heightened sensitivity to the inherent characteristics of samples at this speed.
4.6.3.Model robustness analysis under different interlayer spacings
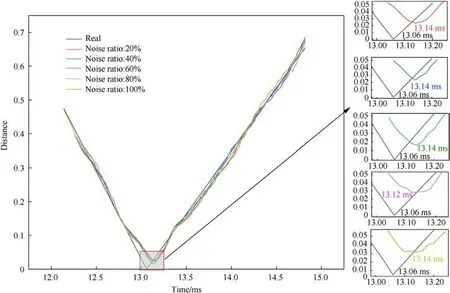
Fig.16.Relative position map under different noise ratios.

Fig.17.Relative position map under different penetration speeds: (a) 900 m/s; (b) 1000 m/s; (c) 1100 m/s; (d) 1200 m/s; (e) 1300 m/s.

Table 4 Evaluation indexes for prediction results under different speeds.
To assess the model's suitability for various interlayer spacings between target plates,interlayer spacings of 2 m,2.5 m,3.5 m,and 4 m were selected at a speed of 900 m/s, in conjunction with the working condition of a 3 m interlayer spacing examined in the previous section.The model was supplied with the corresponding multi-source information pertaining to different interlayer spacings, and the resulting predicted distances between the fuze and the target plate are illustrated in Fig.18.
The observations indicate that,across the four different working conditions,the actual and predicted values of the fuze penetration time for the first layer remained consistent.This consistency arises from the fact that altering the interlayer spacing does not impact the distance between the projectile and the first layer of the target plate, thereby enabling accurate predictions for the first layer.However, when predicting subsequent layers, for a target plate spacing of 2 m, the maximum error in the fuze penetration time was 0.08 ms.Similarly, for spacings of 2.5 m, 3.5 m, and 4 m, the maximum errors in the fuze penetration time were 0.16 ms,0.12 ms, and 0.12 ms, respectively.The evaluation indexes for different target spacings at a penetration speed of 900 m/s are presented in the Table 5.Notably,as the model was trained with a 3 m interlayer spacing, the predicted results showed the best fit when the spacing was 3 m.However, deviations from the 3 m interlayer spacing resulted in a poorer fit between the predicted and actual values.Overall, the fit for spacings of 2 m or 2.5 m was worse compared to spacings of 3.5 m or 4 m.This can be attributed to smaller interlayer spacings resulting in shorter penetration times between layers, leading to a higher concentration of stress waves that were not dissipated in the overload signal for penetrating the subsequent target plate layer.Consequently, these stress waves interfere with the model's predictions.
5.Conclusions
Conventional penetration fuzes rely on acceleration sensors to measure overload information which often leads to aliasing issues due to oscillation signals.Conversely,the use of magnetic sensors to detect magnetic anomalies during the penetration process is prone to interference from ferromagnetic substances.To address these challenges, this research introduces a multi-source information fusion layer counting approach based on TCN-LSTM.This method leverages the strengths of both TCN and LSTM networks, enabling the extraction of time series information while capturing highdimensional features of the sample data.By fully learning the relationship between multi-source information and the distance between the fuze,target,and plate during the penetration process,the proposed method achieves compatibility between different physical fields.The contributions of this study can be summarized as follows.

Fig.18.Relative position map under different interlayer spacings: (a) 2 m; (b) 2.5 m; (c) 3.5 m; (d) 4 m.

Table 5 Evaluation indexes for prediction results under different spacings at 900 m/s.
(1) By combining the robust environmental signal of overload with the delicate environmental signal of magnetic anomaly,the proposed approach effectively integrates the strengths of different physical fields.Consequently, it overcomes the limitations associated with frequent overload aliasing caused by oscillation signals and the interference of magnetic anomaly signals due to ferromagnetic substances.
(2) The application of the TCN-LSTM model in the field of penetration fuze layer counting allowed for the fusion of multi-source information throughout the penetration process.This fusion facilitated the establishment of a mapping relationship between the multi-source information and the distance between the fuze and the target plate.As a result,it enabled a precise representation of real-time penetration working conditions.
After verification, the proposed method demonstrated the following results.
(1) The inclusion of noise in the training samples enhanced the model's generalization capability.The proposed model exhibited a reduction of 60% and 50% in prediction error compared to single overload layer counting and single magnetic anomaly signal layer counting,respectively.
(2) The model's robustness was validated through various experiments, including the addition of random noise with different ratios,changes in projectile penetration speed,and variations in the spacing between the target layers.When random noise was added with different ratios,the maximum error in the predicted fuze penetration time was 0.08 ms.Changing the penetration speed resulted in a maximum error of 0.12 ms in the predicted fuze penetration time.Similarly,when the interlayer spacing was varied,the maximum error in the predicted fuze penetration time was 0.16 ms.Additionally, the prediction performance was generally better under larger interlayer spacing due to the interference of stress waves with the overload signal in cases with smaller interlayer spacing.
The method described in this article has certain limitations in addition to the above advantages.First, when the model faces multi-layer targets with large interlayer spacing changes, the accuracy of the output results will decrease.Therefore, when facing more complex targets,there is further room for improvement in the adaptability of the model.Second, neural networks have high hardware resource requirements, and conventional MCU-based missile-borne processors cannot handle them.In the future, indepth research can be carried out from two aspects: reducing algorithm complexity from the software level and designing missileborne platforms based on small-volume high-performance processors from the hardware level.
Declaration of competing interest
The authors declare that they have no known competing financial interests or personal relationships that could have appeared to influence the work reported in this paper.
- Defence Technology的其它文章
- Explosion resistance performance of reinforced concrete box girder coated with polyurea: Model test and numerical simulation
- An improved initial rotor position estimation method using highfrequency pulsating voltage injection for PMSM
- Target acquisition performance in the presence of JPEG image compression
- Study of relationship between motion of mechanisms in gas operated weapon and its shock absorber
- Data-driven modeling on anisotropic mechanical behavior of brain tissue with internal pressure
- The effect of reactive plasticizer on viscoelastic and mechanical properties of solid rocket propellants based on different types of HTPB resin

