Wave field structure and power coupling features of blue-core helicon plasma driven by various antenna geometries and frequencies
Chao Wang(王超), Jia Liu(刘佳), Lei Chang(苌磊), Ling-Feng Lu(卢凌峰),Shi-Jie Zhang(张世杰), and Fan-Tao Zhou(周帆涛)
1State Key Laboratory of Power Transmission Equipment Technology,School of Electrical Engineering,Chongqing University,Chongqing 400044,China
2Shanghai Institute of Space Propulsion,Shanghai 201112,China
3Southwestern Institute of Physics,Chengdu 610041,China
Keywords: helicon plasma,helicon wave,helicon discharge,radio frequency plasma source
1.Introduction
Helicon plasma sources, driven by radio frequency (RF)waves with frequency between electron and ion cyclotron frequencies, are well known for their exceptionally high ionization efficiency.The filling gas can be ionized to produce high-density and relatively low-temperature plasma,using low magnetic fields and moderate powers.[1]Because of high density and electrodeless features,helicon sources have found various applications such as plasma rocket propulsion,[2]materials processing,[3]etching of semiconductors,[4]and nuclear fusion,[5]etc.
Helicon discharge can typically operate in one or more of the following modes: capacitive (E), inductive (H), and helicon(W),depending on the RF power,magnetic field,frequency, and antenna geometry, etc.Increasing the power or magnetic field, the transitions between these modes are observed as prominent,non-monotonic density jumps.[6-14]The conversion to the helicon mode in argon is usually associated with blue core: a radially localized central region that emits very strong light in blue color.The phenomenon of the blue core is widely used as an indicator of the helicon mode.[9,15,16]It is also found that the bright-core mode of helicon discharge is not restricted to argon with blue color, but has been also observed for various other gases such as nitrogen and helium[17,18]although in different colors.
The formation of the blue core attracts great research interests on the mysterious physical mechanism.Ruilin Cuiet al.investigated the discharge characteristics and heating mechanisms of argon helicon plasma in different wavecoupled modes with and without blue core.[19]Zhikang Luet al.constructed a helicon plasma source with ring permanent magnets to study the effect of the magnetic field configuration,i.e.with zero magnetic points, on the plasma parameters.[20]Blue-core plasma and E-H-W mode transitions are well observed in their devices, and the wavelength calculated by the unbounded whistle wave dispersion formula suggests the occurrence of a half-wavelength resonance.Lei Changet al.computed the wave propagation and power deposition inside and outside the blue core and their transitional behaviors before and after the blue core formation using the EMS code.[21]However,little attention was given to the blue-core wave structure and power absorption for different types of antennas.In this paper,the main innovation is to explore and compare the influences of various antenna geometries and driving frequencies on the blue-core helicon plasma evolution, i.e., in terms of wave field structure and power coupling features.It is valuable to understanding the formation mechanism of blue-core helicon discharge and thereby important for the research community.
The sections of this paper will be organized as follows.In Section 2,model and computational conditions are shown.In Section 3,the numerical results and analyses are presented.Finally,in Section 4,we draw conclusions on wave field structure and power coupling features of blue-core helicon plasma driven by various antenna geometries and frequencies.
2.Model and computations
2.1.Governing equations
The computer program HELIC,developed by Arnush and Chen,is written in C++and is used to compute the excitation and propagation of radio-frequency (RF) waves inside magnetized plasma cylinders.[22-24]The code is capable of computing the power deposition and electromagnetic field by utilizing specified input parameters, including plasma density,magnetic field,and conventional antenna types.It is based on a cylindrical symmetry framework (r,φ,zcomponents).The governing equations consider radially non-uniform plasma with standard dielectric tensor.These equations can be written in form of coupled differential equations:
Here, the harmonic waves are in the form of exp[i(k+mφωt)], withkthe axial wave number,mthe azimuthal mode number, andωthe driving frequency;k0=ω/cwithcthe speed of light; the variablesEandBare wave electric field and wave magnetic field;S,D, andP(=εxx,εxy,εzz),[25]are the three constituent elements of dielectric tensor.The permittivity tensor can be written as

whereωpeis the plasma frequency.The angular frequency of the charged particle in the presence of a uniform magnetic field is expressed as gyro frequencyΩe.The wave frequency is represented byω,andνeis the effective collisional frequency.To determine the non-uniform plasma density, the profile is matched to the following three-parameter (expressed ass,t,fa)equation:
Here,sandtare constant parameters;fais the relative densityn(r)/n0atr=aandn0is the plasma density at the center.By givingfaa non-zero value, a wide range of profiles in radius can be fitted, from almost flat to extremely peaked;ris the cavity radius andais plasma radius.
In the HELIC code,plasma generation and transportation are not considered;instead,it computes the wave propagation and power absorption in an existing plasma configuration.The plasma resistivity is computed as a function of uniform magnetic field.The antenna is assumed to have ultra-thin thickness and carry a sheet currentKwith ∇·K=0.The antenna current is a surface current denoted asK(r,φ), located on the surface wherer=band expressed in the Fourier componentK(m,k).
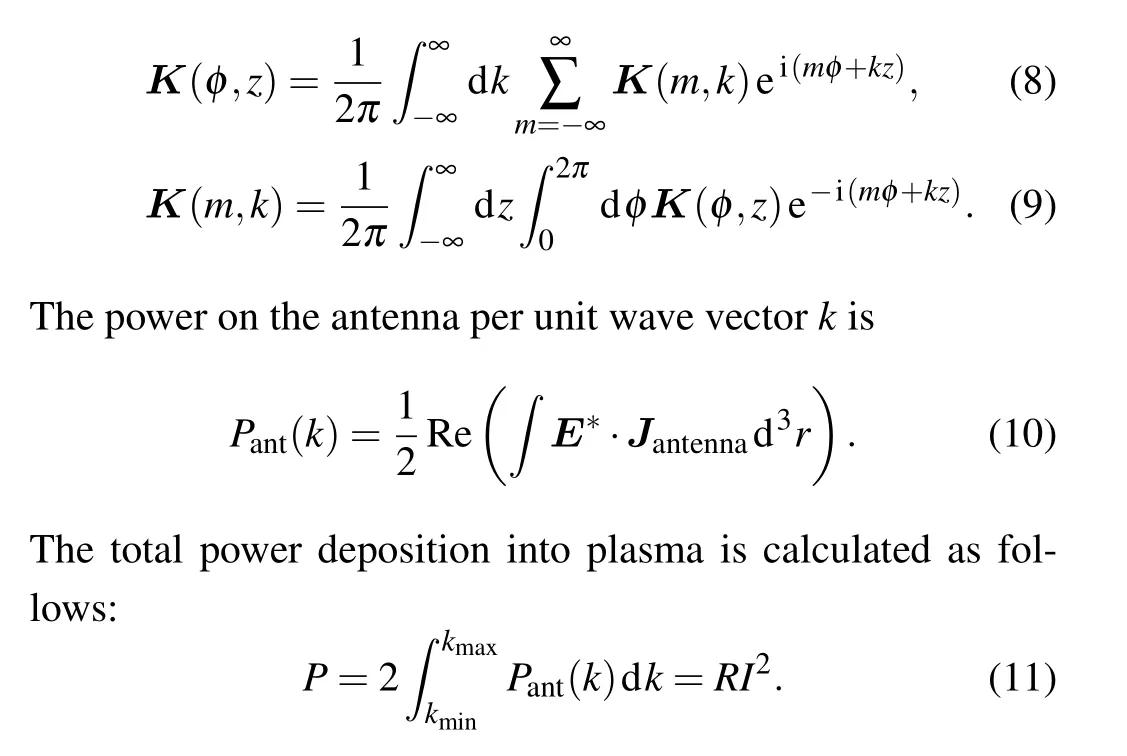
Here,R=P/I2forI=1 A,is numerically equal to load resistanceR.
2.2.Computational domain and conditions
The computational domain, as shown in Fig.1, refers to the layout of the CSDX (the controlled shear decorrelation experiment).[26]We set the radii of plasma and antenna to be 0.07 m and 0.075 m, respectively, and the cavity is 0.1 m in radius.The plasma is considered to be uniform for the temperature and pressure,which are set to be 4 eV and 3.9 mTorr(the unit 1 Torr=1.33322×10²Pa),respectively.

Fig.1.The computational domain employed in our simulations.
Four radial density profiles are constructed for four strengths of external magnetic field, as shown in Fig.2.The radial profiles of plasma density are fitted from experimental data,except when the external magnetic field of 0.04 T,which refers to the configuration in previous study.[27]
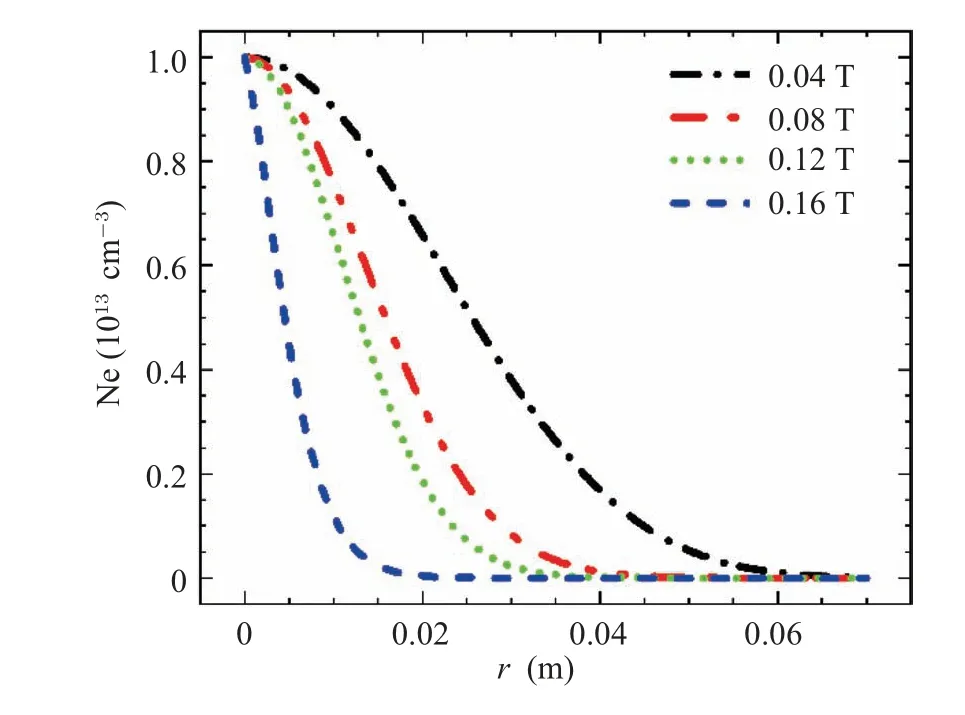
Fig.2.Radial profiles of plasma density with external magnetic field of 0.04 T,0.08 T,0.12 T,and 0.16 T,respectively.
Regarding Eq.(7),the constructed plasma density parameters for HELIC are listed in Table 1.The detailed parameters for computations are listed in Table 2.

Table 1.Radial profiles of plasma density parameters for HELIC:external magnetic field B, constant parameters s and t, relative plasma density fa at r=Ra.
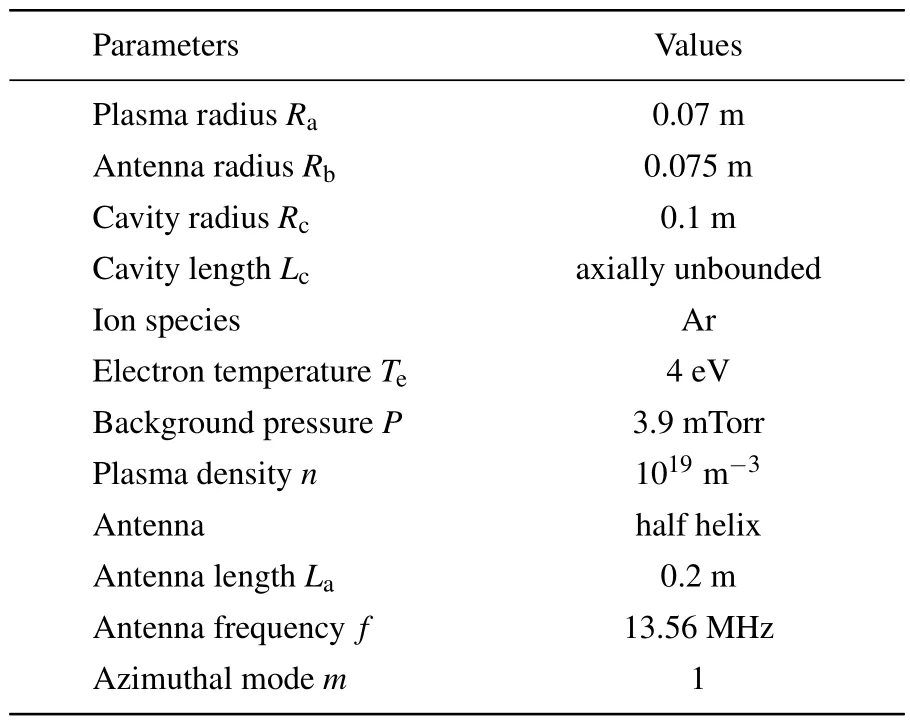
Table 2.Plasma parameters and boundary conditions employed for computations.
3.Results and analyses
3.1.Wave field structure
The wave field for half helix antenna with various plasma density configurations, as shown in Fig.2, is first computed.The discharge mode of a helicon source enters the non-bluecore mode when the external magnetic field reaches 0.04 T,0.08 T,and 0.12 T,respectively,and transits into the blue-core mode when the external magnetic field reaches 0.16 T.Figure 3 illustrates the radial distribution of the wave magnetic fields.It can be seen that the wave magnetic field peaks at the center and decreases toward the edge radially.Overall the magnitude of wave magnetic field lowers during the transition into blue-core mode.The tendency of forming a second radial mode is not clear during this transition: the radial component exhibits second radial mode for 0.04 T only,while the azimuthal component shows this mode for all field strengths except 0.08 T.

Fig.3.Radial profiles of wave magnetic field(measured at z=1 m):(a)radial component,(b)azimuthal component.
To show more clearly the wave field structure,we present the perpendicular stream plots in Fig.4.The employed method is through coordinate change in the cross section,which converts wave magnetic fields from the polar coordinate system into those in the cartesian coordinate system.The streamlines identify the vector associated with the wave magnetic field,and the back color indicates its magnitude.It can be seen that the core region of wave magnetic field in the blue-core mode is smaller than those in the non-blue-core mode.This may be consistent with the experimental observation that most plasma is shrunk onto axis during the blue-core formation if we correlate the wave field with plasma density distribution in terms of mutual support.

Fig.4.The perpendicular structure of the wave magnetic field(measured at z=1 m): (a)0.04 T,(b)0.08 T,(c)0.12 T,and(d)0.16 T.
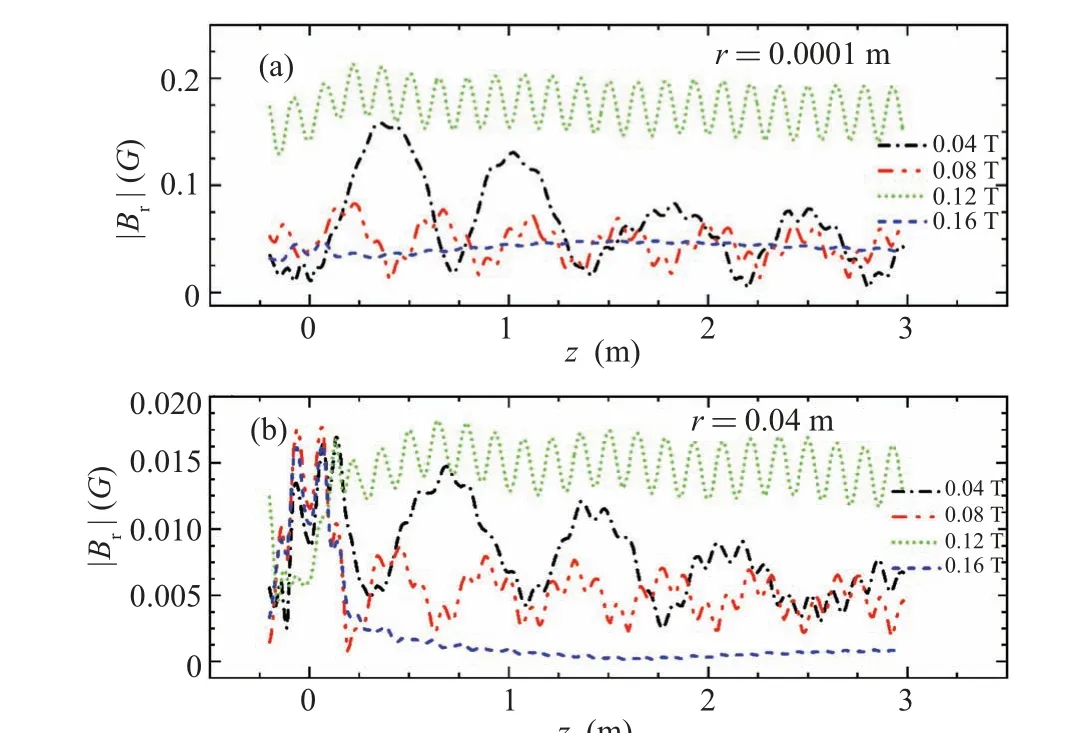
Fig.5.Axial profiles of wave magnetic field measured at (a) r=10-4 m and(b)r=0.04 m respectively.
Figure 5 illustrates the axial distribution of wave magnetic fields for different field strengths.Notably,for the bluecore mode, in the core region, the magnetic field is greater,and more uniform compared to that of near edge.It shows that the wave can propagate in the core region.In the nonblue-core modes near edge, the radial component has weak attenuation and can propagate till the right end.Specifically,for low field strengths of 0.04 T and 0.08 T, the axial profile shows envelops, containing shorter wavelength oscillations; for the field of 0.12 T, the envelop feature disappears and single-frequency oscillations are shown clearly.For bluecore mode near edge,however,the attenuation is very strong,the wave magnetic field decays rapidly and approaches zero when it is away from the antenna.Comparing the case of 0.12 T with other field strengths, we can also find that it differs significantly from others,i.e.magnitude and profile.This difference can also be seen from Fig.3.This implies that this field strength may be the threshold for transition into blue-core mode.
3.2.Power absorption
We then compute the relative power absorption for the four plasma density profiles.The radial relative power absorption represents the power absorbed in a very thin layer along the plasma tube.The longitudinal power absorption is described as the power betweenzandz+dz,integrated across the entire plasma cross-section.To gain more comprehensive understanding of the power absorption differences between the blue-core mode and non-blue-core mode, the relative power absorption is normalized.Figure 6 illustrates radial variations of relative power absorption.It can be seen that the blue-core mode exhibits bigger gradient in the radius.This finding may explain the higher ionization rate and significant electronic density gradient in the core region of the blue-core mode,compared to those of the non-blue-core mode.Moreover, bluecore mode exhibits minimal relative power absorption in radial direction.Furthermore,the relative power absorption decreases significantly as the external magnetic field increases,i.e.from 0.12 T to 0.16 T.This decrease suggests a significant reduction in the coupling between antenna and plasma during the blue-core formation.Experimentally,it shows that the discharge transits from blue color in the whole tube to blue core near axis.[26]It means that certain level of plasma density near edge is necessary for the efficient power coupling from antenna into plasma.Since the density near edge is lowered during the blue-core formation, the relative power absorption decreases as a result.
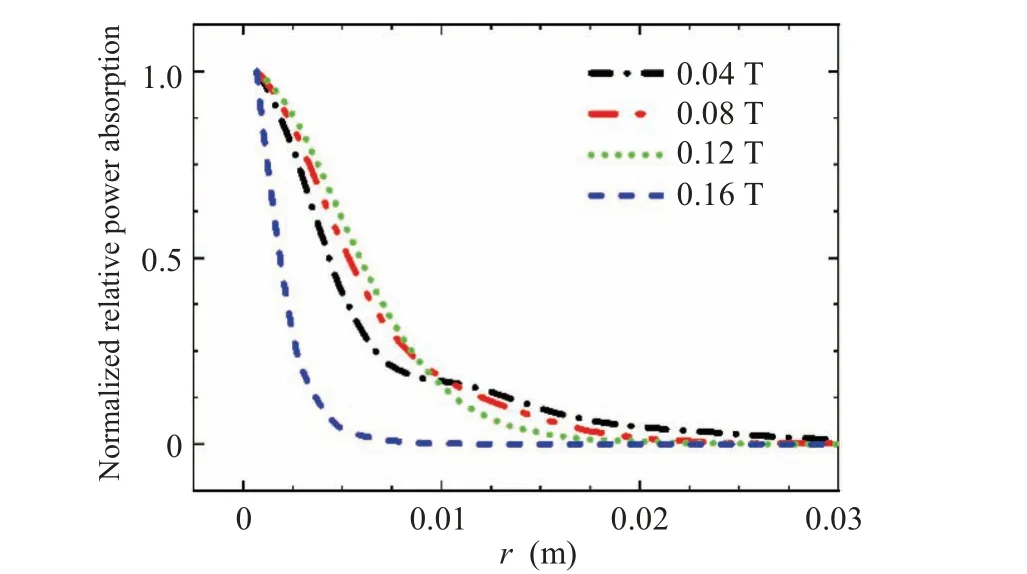
Fig.6.Relative power deposition(normalized)in radial direction.
Figure 7 shows the axial variations of the relative power absorption,which is again normalized to show the trend more clearly.As can be seen, in regions away from the antenna,the effective coupling between antenna and plasma increases with the external magnetic field.However, in the non-bluecore modes (0.04 T-0.08 T), there appears large scale envelope with much shorter oscillations inside, similar to the axial variations of wave field shown in Fig.5.This envelope feature remains for blue-core mode of 0.16 T, different from the wave field in Fig.5.The distinguished profile for 0.12 T appears again,indicating transitional behavior from non-bluecore mode to blue-core mode.
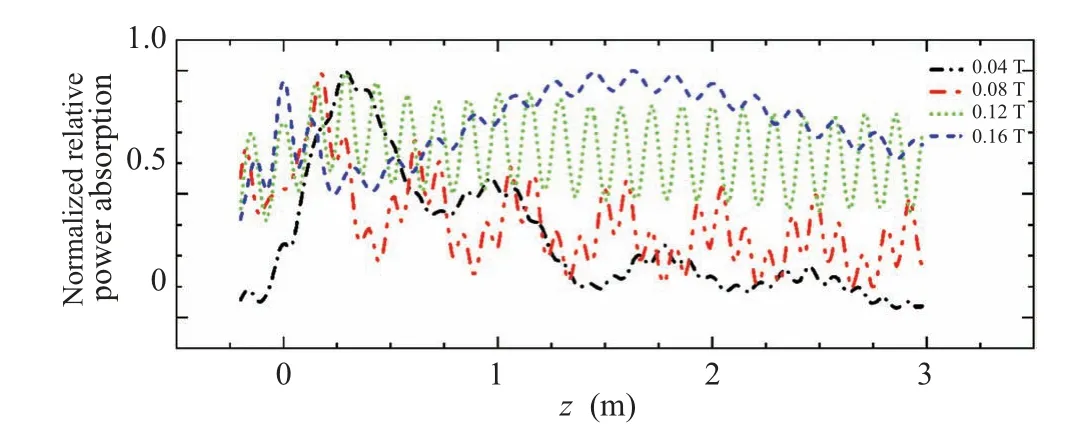
Fig.7.Relative power deposition(normalized)in axial direction.
3.3.Effects of antenna geometry
The radio frequency power supply initiates wave generation through the antenna, transferring energy into plasma.Consequently,the antenna plays a crucial role in this process.The employed antennas in the experiments usually are Nagoya III, Boswell, half helix, and loop.This investigation focuses on examining how antenna geometry influences the wave field and power absorption before and after the blue-core formation.In this particular study, only the antenna types are changed while maintaining the radial plasma density configuration for external magnetic field of 0.16 T and other conditions.

Fig.8.Radial profiles of wave magnetic field(measured at z=1 m):(a)radial component,(b)azimuthal component.
The wave field of the four antennas is first computed,and figure 8 illustrates the radial distributions.It is observed that the wave magnetic field structure is similar for Nagoya III, Boswell, and half helix antennas, i.e., it is high at the center and gradually decreases with radius.In contrast, the loop antenna yields lower wave magnetic field, approaching zero.This is perhaps because the loop antenna is designed to mainly excitem=0 mode,which is however less efficient for the blue-core helicon plasma.Notably,the half helix antenna demonstrates the highest wave magnetic field,possibly due to its preference to excite them=+1 helicon modes.
Figure 9 provides a detailed illustration of the perpendicular wave magnetic field structure for different antennas.The diagram reveals distinct characteristics in the wave magnetic field structure,especially when comparing the loop antenna to the other three antennas.Specifically,the wave field structure for loop antenna exhibits a symmetrical distribution, which is consistent with previous research findings.[28]The crosssectional wave field structure of the Boswell antenna is similar to that of the Nagoya III antenna.However, in the blue core region, the streamlines are denser for the Nagoya III antenna compared to those of the Boswell antenna.Moreover, the radial edge of the core region is approximately 0.01 m from the center for the Nagoya III, Boswell, and half helix antennas.This location coincides with the radius of the bump-on-tail peak of the wave field shown in Fig.8(b).The correlation between the peak wave field and blue-core edge is also consistent with previous study.[21]Notably,the streamlines are most dense for the half helix antenna in the blue-core region, indicating that the magnitude of wave magnetic field is strongest there.

Fig.9.Perpendicular structure of wave magnetic field with different types of antennas: (a)Boswell,(b)half helix,(c)loop,and(d)Nagoya III.
Figure 10 illustrates the axial distributions of wave magnetic field.Near axis or edge, the Boswell and Nagoya III antennas exhibit similar distributions in wave magnetic field.It is worth noting that near the antenna, the half helix antenna demonstrates higher magnitude of wave magnetic field,compared to the Boswell and Nagoya III antennas.Moreover, near edge, in the regions away from the antenna, the wave field of half helix antenna decays continuously, while the those of Nagoya III and Boswell antennas display standing wave feature.For the loop antenna near edge,the excited wave magnetic field exhibits highest magnitude of radial component compared to the other three antennas.Notably, near axis, the magnetic field for Boswell,Nagoya III,and half helix is much greater than that near edge,and it is increasing with axial distance.
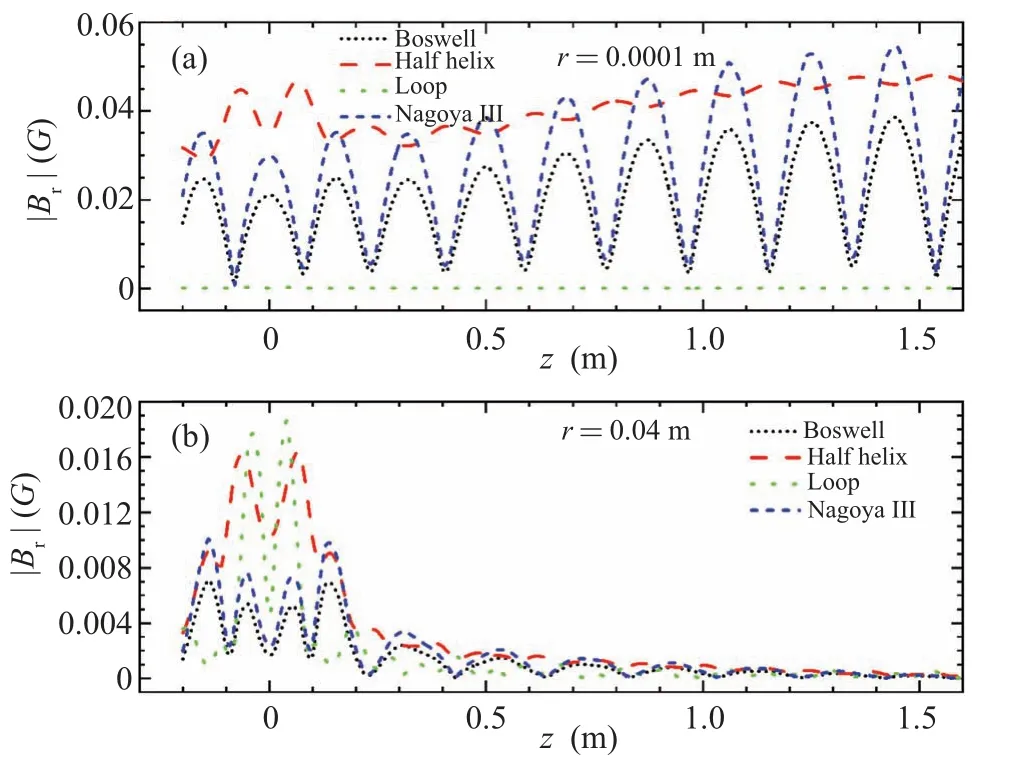
Fig.10.Axial profiles of wave magnetic field measured at(a)r=10-4 m and(b)r=0.04 m respectively.
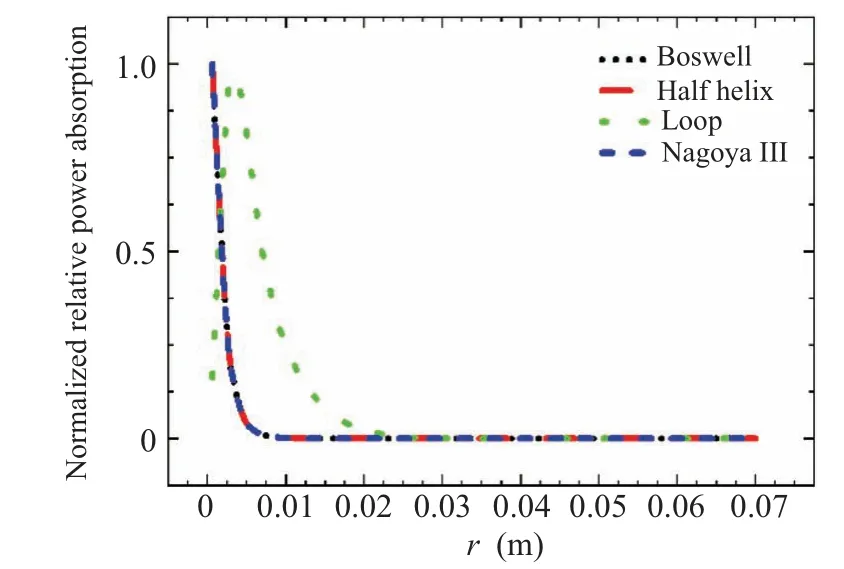
Fig.11.Relative power deposition(normalized)in radial direction,i.e.,the normalized relative power absorptions for Boswell, half helix, and Nagoya III are near the same.
Next,we analyze the relative power absorption of the four different antennas in both radial and axial directions.The computation method is the same to that used for Figs.6 and 7.Figure 11 shows the radial profiles of normalized relative power absorption.We can see that the loop antenna behaves distinctly again compared with other antennas.Specifically, for the loop antenna,the power distribution is hollow in radius,i.e peaking off axis,whereas for other antennas,the power maximizes on axis and decreases sharply with radius.The hollow power distribution is consistent with previous study.[21]
Figure 12 shows the axial variations of normalized relative power absorption.It can be seen that the Boswell and Nagoya III antennas exhibit the same variation of power absorption in the axial direction.The clear periodic structure and increasing magnitude away from the antenna imply that the power is well transmitted along the axial plasma column.Similar power transmission can be also observed from the result of half helix antenna,although there is a notable drop between the antenna and downstream region.Differently, the power absorption for loop antenna is largely localized under the antenna and diminishes in the downstream region away from the antenna.This implies that the loop antenna is less efficient than other antennas for power coupling in blue-core mode.Please note that this finding is different from previous studies that treat non-blue-core mode and claim that the loop antenna is a better choice.[29]The underlying reason may be the plasma density near edge for blue-core mode is too low for loop antenna but still sufficient for Boswell, Nagoya III, and half helix in terms of power coupling.

Fig.12.Relative power deposition(normalized)in axial direction the normalized relative power absorptions for Boswell and Nagoya III are near the same.
3.4.Effects of driving frequency
Besides antenna geometry,the antenna driving frequency is another key parameter that determines the excited wave field and power absorption.Hence, we conduct a scan of certain frequency range to investigate dispersion relation,which is the relationship between wave number and frequency, and loading resistance that showing the coupling efficiency between antenna and plasma column.Our focus will be on the difference between non-blue-core mode and blue-core mode.The specific frequency range of 10 MHz-100 MHz will be considered, covering the typical helicon experiments.[30-40]Figure 13(a) displays an increase in wave number with driving frequency near the axis.This applies to both non-bluecore mode (0.04 T) and blue-core mode (0.16 T).A notable difference is that for non-blue-core mode the wave number approaches to saturation value at much lower frequency (i.e.61.02 MHz) compared to that for blue-core mode (beyond 100 MHz).However, near edge, there is a big difference;namely, the dispersion relation is largely linear for non-bluecore mode (0.04 T), while it is overall constant for blue-core mode.The underlying reason may be caused by the plasma density that is very low near edge for blue-core mode,so that cannot support regular wave propagation.This claim agrees with previous study.[21]
The next step is to investigate the correlation between total loading resistance and frequency in both non-blue-core and blue-core modes.This resistance directly reflects the coupling level between the driving antenna and the plasma column.As shown in Fig.14, the total loading resistance increases with driving frequency for both non-blue-core and blue-core modes.However, the magnitude for blue-core mode is much lower than that for non-blue-core mode.This implies that once the blue-core mode has been formed, the coupling efficiency between antenna and plasma column lowers.This agrees with Fig.6 and previous study[21]that certain level of plasma density is necessary for power coupling, i.e., for blue-core mode most plasma is shrunk onto axis which lowers the plasma density near edge.
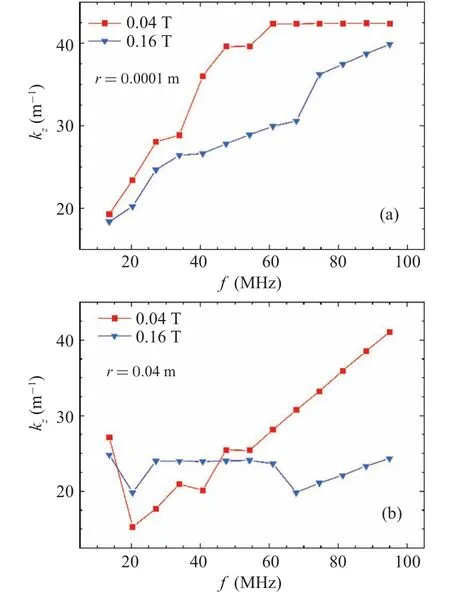
Fig.13.Dispersion relations at (a) r =10-4 m and (b) r =0.04 m for non-blue core mode(0.04 T)and the blue-core mode(0.16 T).
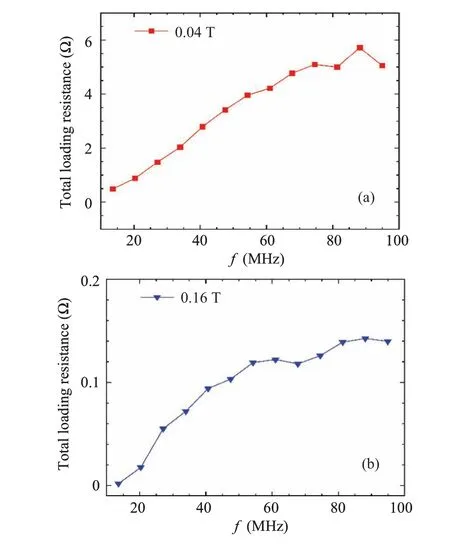
Fig.14.Total loading resistance for (a) non-blue-core mode (0.04 T) and(b)blue-core mode(0.16 T).
4.Conclusion
The study explores wave field and power absorption from non-blue-core mode to blue-core mode,focusing on the transitional features between them.Particularly,four different types of antennas and various frequencies are employed to investigate the effects of antenna geometry and frequencies on wave field and power absorption.
The main findings are summarized as follows.
(i) For blue-core mode,the wave field magnitude is lower and the perpendicular streamlines shrink onto the axis so that becomes denser,compared to the non-blue-core mode.
(ii) For non-blue-core mode,the axial variation of wave field exhibits oscillations which become stronger with increased external magnetic field.However,for blue-core mode,the wave can propagate in the core region and decays sharply outside the core.
(iii) The power absorption is lower and steeper in radius for blue-core mode due to lower plasma density near edge.However,in the axial direction,the power is well transmitted for both modes.
(iv) The field strength of 0.12 T shows transitional behavior from non-blue-core mode to blue-core mode and always results in distinguished features of wave field and power absorption.
(v) For blue-core mode, half helix antenna yields the strongest wave field and power absorption, while loop antenna yields the lowest.Moreover,near axis,for antennas withm=+1,the wave field increases with the axial distance.
(vi) For blue-core mode, the dispersion relation outside the core becomes irregular, i.e., constant wave number with varying frequency.In the core region, the wave number approaches to a saturation value at much lower frequency for non-blue-core mode compared to blue-core mode.
(vii) The total loading resistance increases with frequency for both modes.However, it is much lower for bluecore mode because of its lower plasma density near edge.
For experimental verification, however, we do not have data access from the CSDX machine.But we are doing experiments on another helicon discharge machine named LEAD,and will present detailed comparison upon available data.One special feature of LEAD that requires much work is the spiral antenna which needs particular coding effort.We are working on it and hopefully present it in the near future.
Acknowledgments
Project supported by the National Natural Science Foundation of China (Grant No.92271113), the Fundamental Research Funds for the Central Universities (Grant No.2022CDJQY-003), Chongqing Entrepreneurship and Innovation Support Program for Overseas Returnees (Grant No.CX2022004), and the Fund from Shanghai Engineering Research Center of Space Engine(Grant No.17DZ2280800).
- Chinese Physics B的其它文章
- Does the Hartman effect exist in triangular barriers
- Quantum geometric tensor and the topological characterization of the extended Su–Schrieffer–Heeger model
- A lightweight symmetric image encryption cryptosystem in wavelet domain based on an improved sine map
- Effects of drive imbalance on the particle emission from a Bose–Einstein condensate in a one-dimensional lattice
- A new quantum key distribution resource allocation and routing optimization scheme
- Coexistence behavior of asymmetric attractors in hyperbolic-type memristive Hopfield neural network and its application in image encryption

