Eucalyptus carbon stock estimation in subtropical regions with the modeling strategy of sample plots - airborne LiDAR - Landsat time series data
Xiandie Jiang, Dengqiu Li,c, Guiying Li,c, Dengsheng Lu,c,*
a Key Laboratory for Humid Subtropical Eco-geographical Processes of the Ministry of Education, Fujian Normal University, Fuzhou, 350117, China
b Institute of Geography, Fujian Normal University, Fuzhou, 350117, China
c Fujian Provincial Engineering Research Center for Forest Carbon Metering, Fujian Normal University, Fuzhou, 350117, China
Keywords:Forest carbon stock Eucalyptus plantation Airborne LiDAR Landsat time series Forest age
ABSTRACT Updating eucalyptus carbon stock data in a timely manner is essential for better understanding and quantifying its effects on ecological and hydrological processes.At present,there are no suitable methods to accurately estimate the eucalyptus carbon stock in a large area.This research aimed to explore the transferability of the eucalyptus carbon stock estimation model at temporal and spatial scales and assess modeling performance through the strategy of combining sample plots,airborne LiDAR and Landsat time series data in subtropical regions of China.Specifically, eucalyptus carbon stock estimates in typical sites were obtained by applying the developed models with the combination of airborne LiDAR and field measurement data; the eucalyptus plantation ages were estimated using the random localization segmentation approach from Landsat time series data; and regional models were developed by linking LiDAR-derived eucalyptus carbon stock and vegetation age(e.g.,months or years).To examine the models’ robustness, the developed models at the regional scale were transferred to estimate carbon stocks at the spatial and temporal scales, and the modeling results were evaluated using validation samples accordingly.The results showed that carbon stock can be successfully estimated using the age-based models(both age variables in months and years as predictor variables),but the month-based models produced better estimates with a root mean square error (RMSE) of 6.51 t·ha-1 for Yunxiao County, Fujian Province, and 6.33 t·ha-1 for Gaofeng Forest Farm, Guangxi Zhuang Autonomous Region.Particularly, the month-based models were superior for estimating the carbon stocks of young eucalyptus plantations of less than two years.The model transferability analyses showed that the month-based models had higher transferability than the year-based models at the temporal scale, indicating their possibility for analysis of carbon stock change.However, both the month-based and year-based models expressed relatively poor transferability at a spatial scale.This study provides new insights for cost-effective monitoring of carbon stock change in intensively managed plantation forests.
1.Introduction
Forest ecosystems play an important role in the global carbon cycle and in alleviating the atmospheric CO2increment.To examine the process of the carbon cycle and understand the productivity of ecosystems,it is of great significance to accurately map forest carbon stocks at the regional scale (Houghton et al., 2009; Zhang et al., 2021; Liang et al.,2022).Remote sensing technologies provide critical tools for developing models and methods to quantify forest carbon stocks at different scales(Huang et al.,2022).Of the large areas of plantations in the world,China accounts for the largest proportion,while most of them are concentrated in the southern subtropical regions of China (Zhang et al., 2021).In particular, a large proportion of these plantations are at young and middle growth stages, implying a relatively low carbon stock but considerably potential for carbon sequestration,thus playing a great role in carbon removal from the atmosphere and carbon storage in woods(Liang et al.,2022;Piao et al.,2022).

Fig.1.The changes of eucalyptus features over time (note: DBH, diameter at breast height; H, tree height).
Forest carbon stock estimation has been extensively explored using different kinds of remotely sensed data such as optical sensors (e.g.,Landsat), radar (e.g., ALOS PALSAR), and light detection and ranging(LiDAR) data in the past three decades (see review papers by Lu et al.,2016;Xiao et al.,2019).However,the main limitations with optical and radar data, including data saturation in closed canopy forests (Lu et al.,2005; Zhao et al., 2016), and their susceptibility to topography,atmospheric conditions,and vegetation phenology,make the developed models not transferable in different study areas or even the same study area but different data acquisition dates(Lu,2005;Dalponte et al.,2019;Jiang et al.,2020a).To overcome these shortcomings,one critical step is to extract reliable variables from remotely sensed data so that they are not affected by external factors (e.g., atmospheric conditions, environmental conditions) while having strong relationships with forest carbon stock.Forest canopy height and forest age are two parameters that can meet these requirements(Lu et al.,2016;Dalponte et al.,2019;Santoro et al.,2022).
Airborne LiDAR with its ability to capture forest three-dimensional information is regarded as the most promising technology for forest canopy height extraction and carbon stock estimation (Dong and Chen,2018; Guo et al., 2018; Poorazimy et al., 2020).For carbon stock estimation, LiDAR-derived variables, including height metrics (height percentiles, mean height, and standard deviation), structure features generated using the Gray-Level Co-Occurrence Matrix(GLCM)based on heights, and intensity metrics, are often used as predictor variables in multiple regression models(Yan et al.,2015;Almeida et al.,2019;Jiang et al., 2020b).However, accurate tree height or canopy height is generally obtained from small-footprint airborne LiDAR data which is often limited in a small area considering the cost of data acquisition and data volume.In recent years,LiDAR data have often been introduced and used as a bridge to link field measurements and coarse-resolution remotely sensed data (Shin et al., 2016; Bouvier et al., 2019).The use of such intermediate datasets provided extensive samples for modeling and validation to make up for the shortage of spatial sampling in ground surveys(Puliti et al.,2018;Coops et al.,2021).
In addition to canopy heights, forest age is another variable that is closely related to carbon stock.In general, forest age is obtained from field surveys or previously inventoried data.Since time series of remotely sensed data, especially the Landsat data with the longest history of achieves, is available at no cost, extensive research work has been explored to extract forest ages through detection of disturbance and identification of deforestation and reforestation from time series data(Fang et al., 2019; Nguyen et al., 2019; Wulder et al., 2019).Different algorithms, such as Breaks For Additive Season and Trend (BFAST)(Verbesselt et al., 2010), Landsat-based detection of Trends in Disturbance and Recovery (LandTrendr) (Kennedy et al., 2010), and continuous change detection and classification(CCDC)(Zhu et al.,2016),were developed and extensively applied for forest disturbance detection.Recently,we also developed a new method to extract forest age through combining random localization segmentation and the Chow test(Li et al.,2022).This method is particularly suitable for the detection of frequent disturbance and rapid regrowth of eucalyptus plantations.It was proven that the eucalyptus age can be more accurately obtained by this method than the global segmentation-based method (Li et al., 2022).However,the roles of eucalyptus age on carbon stock modeling have not been fully explored.
Eucalyptus is a group of fast-growing timber species in southern China.The substantially increased eucalyptus areas have been recognized as a huge carbon sink (Yu et al., 2020b).It is necessary to accurately map their attributes,such as spatial distributions,canopy heights,and carbon stocks, and analyze their changes over time.Compared to other forest species(e.g.,Chinese fir and Masson pine),eucalyptus trees have some unique characteristics, for example: (1) strong capacity for absorbing and storing carbon in all parts of plants,resulting in a higher carbon accumulation rate in eucalyptus forests than in other forest types such as Masson pine(Zhu et al.,2018;Yu et al.,2020b);(2)high growth rates and short harvest rotations: it takes only a few years (e.g., 6-10 years) from eucalyptus saplings to a harvestable size for timber production,depending on the physical conditions and the cultivation purposes;(3) intensive management such as selective logging, fertilization, and weeding is needed for eucalyptus plantations to reach their yield potential.As shown in Fig.1,eucalyptus trees have large variations in tree attributes (e.g., diameter at breast height (DBH), height, and carbon stock) within a few years along their growth, requiring proper approaches and data sources to rapidly characterize the growth status.Remote sensing is undoubtedly the most suitable tool for meeting this challenging task.
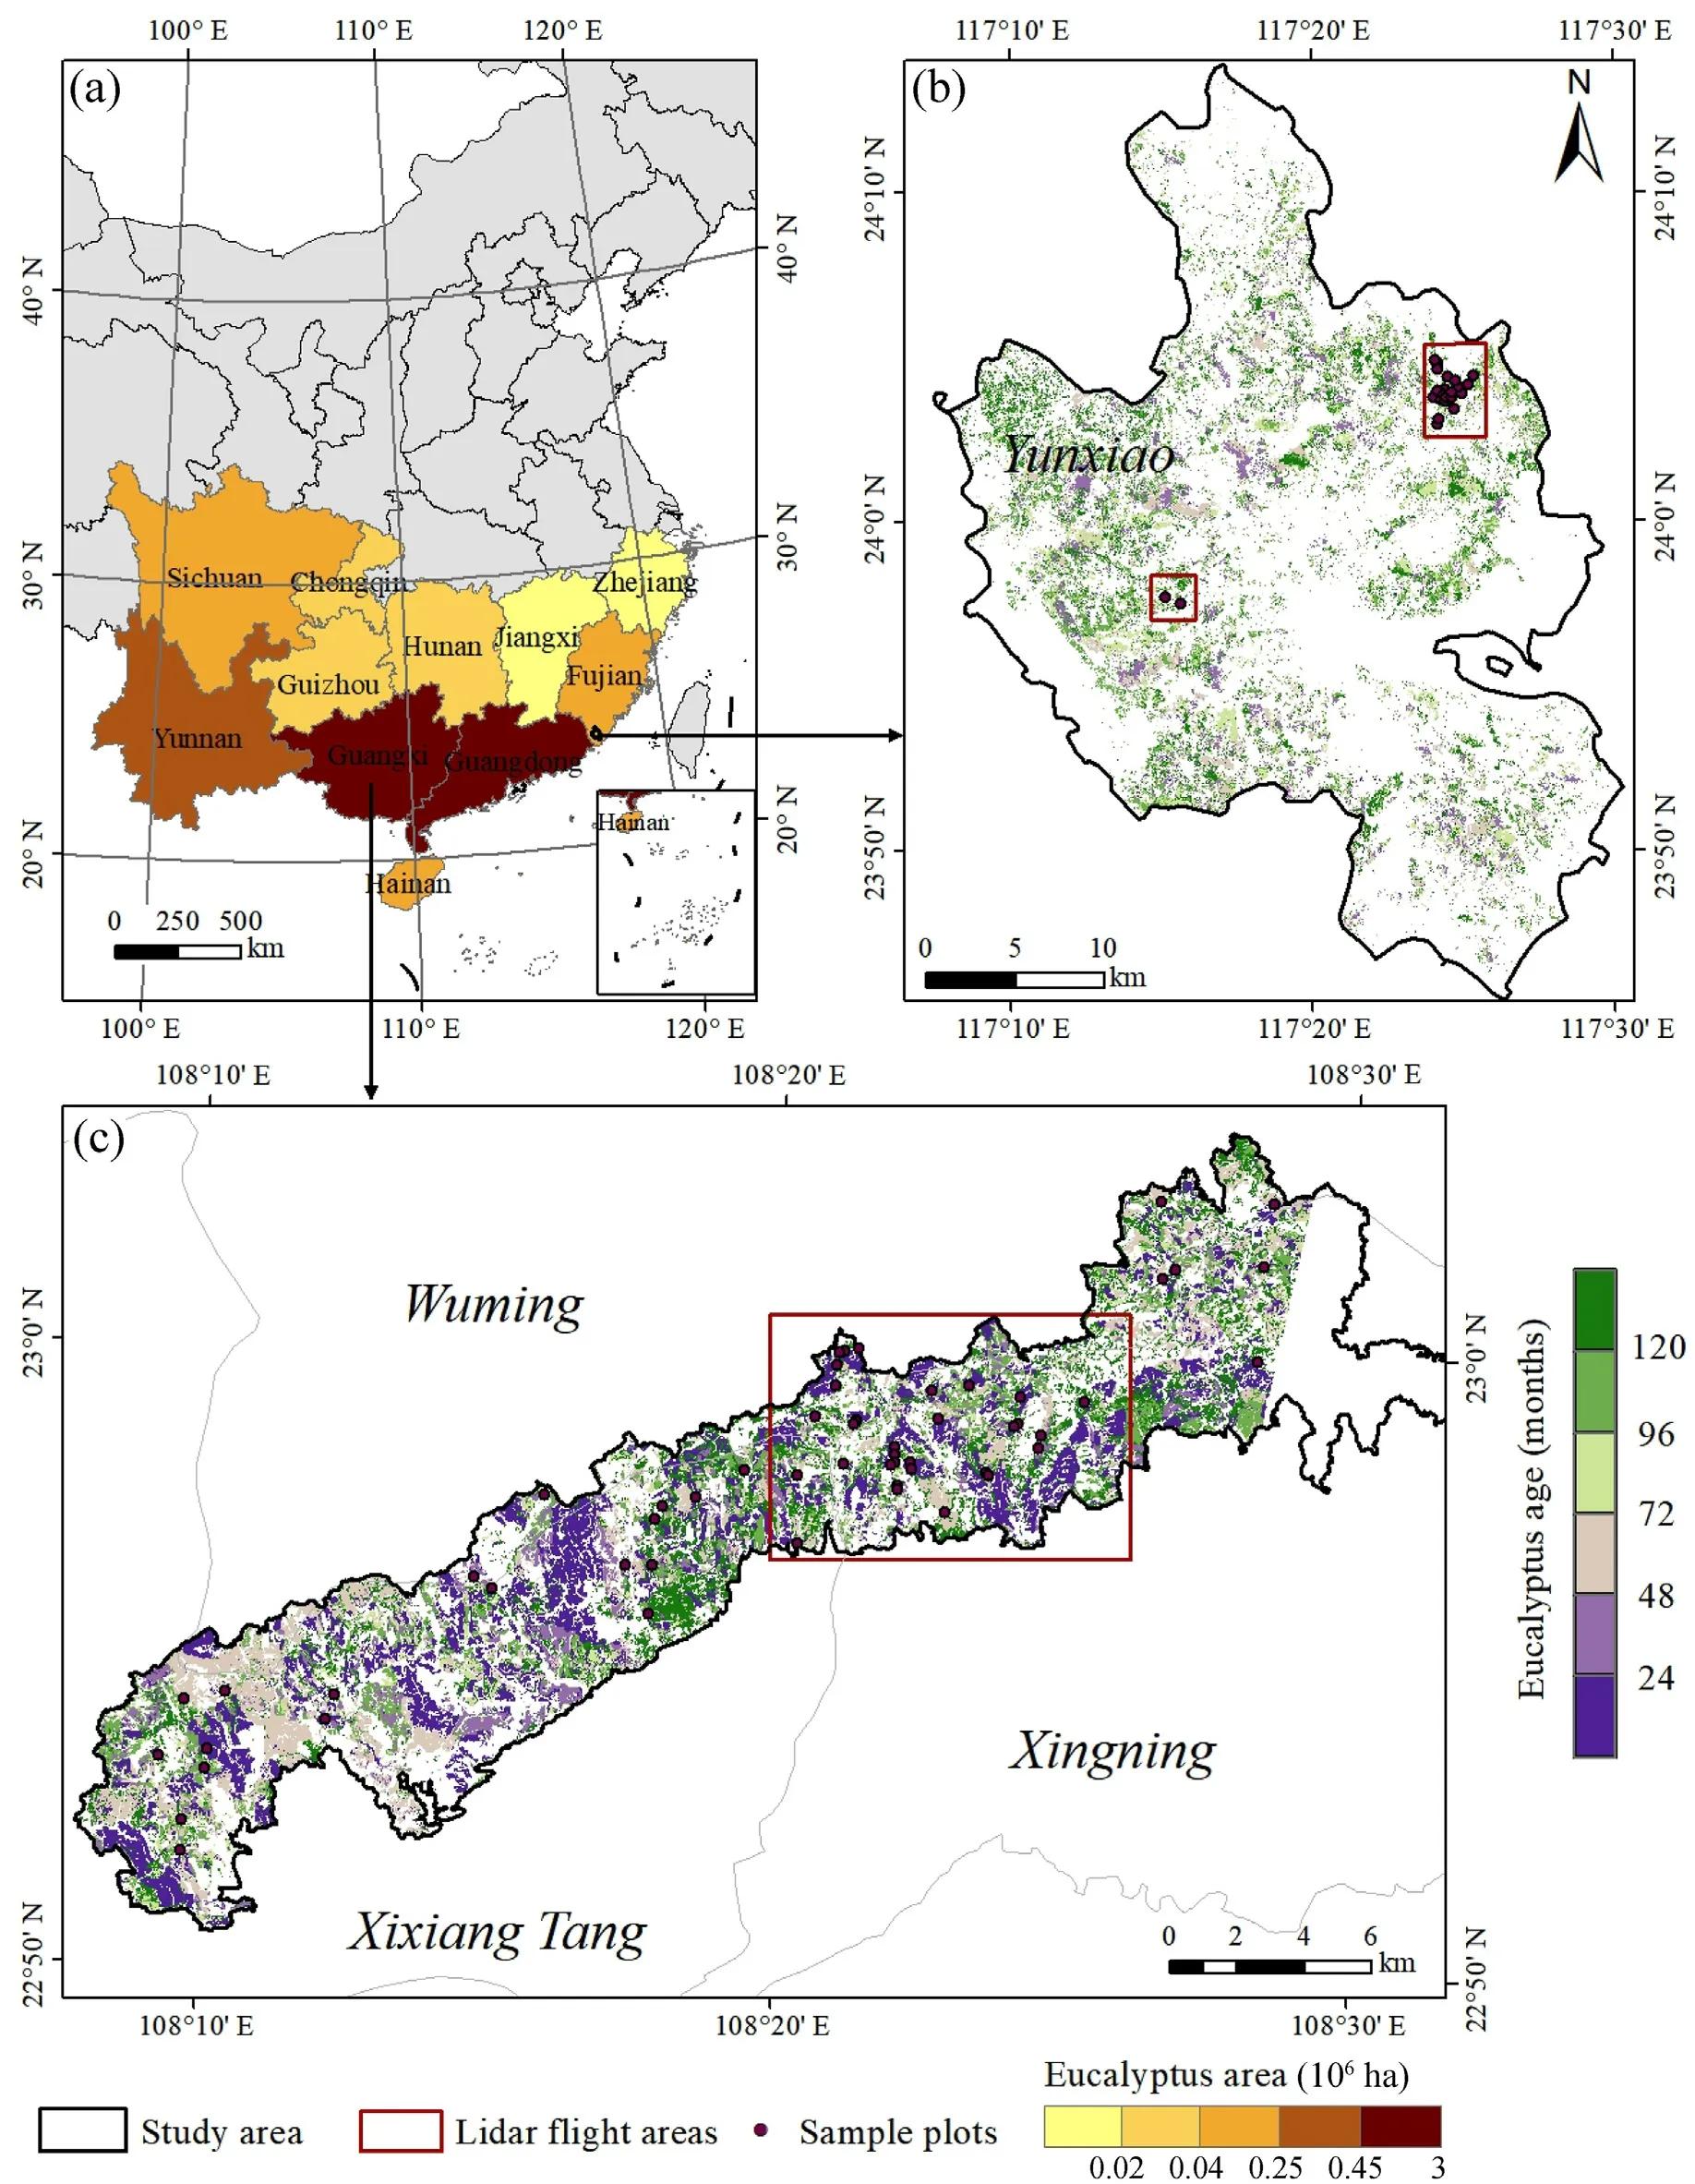
Fig.2.The selected two study areas: (a) Eucalyptus distribution in China; (b) eucalyptus age map in December 2021 in Yunxiao County, Fujian Province; (c)eucalyptus age map in January 2020 in Gaofeng Forest Farm, Guangxi Zhuang Autonomous Region.
Considering the unique characteristics of eucalyptus plantations in carbon sequestration and the importance of their economic values for local governments and farmers, it is necessary to map the carbon stock distribution and assess their changes in a timely manner.However, to date,no suitable approaches are available to accurately map carbon stock distribution and its changes directly using remotely sensed data.One reason is the lack of sufficient ground truth data for developing robust carbon stock estimation models in a large area because of the difficulty and cost of conducting field measurements.Therefore, the objectives of this research are to develop an approach to estimate the carbon stocks of eucalyptus plantations at a regional scale by linking field plots and Landsat-derived vegetation ages through airborne LiDAR data; and to examine the transferability of the age-based modeling approach at temporal and spatial scales.This research will provide new insights for carbon stock estimation at the regional scale for eucalyptus and even other plantations.

Fig.3.Framework of mapping eucalyptus carbon stock distribution and change using multi-source data (CHM represents canopy height model; NDVI represents normalized difference vegetation index).
2.Materials and methods
2.1.Study area
Eucalyptus trees are mainly distributed in 11 southern provinces(regions) in China (Fig.2a), with Guangxi Zhuang Autonomous Region(GZAR) being the largest, accounting for 47% of the eucalyptus area in China.Fujian Province is the third largest eucalyptus area, which is mainly distributed in Zhangzhou prefecture, south part of Fujian Province.In this research, two study areas (Yunxiao County in Fujian Province and Gaofeng Forest Farm in GZAR),were selected.Yunxiao County,which covers an area of 1,166 km2, is located in southeast Fujian Province (Fig.2b).This county has a subtropical marine monsoon climate with an average annual temperature of 21.3°C and an average annual precipitation of 1,730 mm.The dominant forest types are Chinese fir,eucalyptus,and other broadleaf evergreen forests.Eucalyptus trees have become the dominant plantations in this county since they were introduced in the 1980s.Gaofeng Forest Farm is located in northern Nanning City, GZAR (Fig.2c).The climate in this region is a mild subtropical monsoon with distinct dry and wet seasons, a long summer and a short winter.The average annual temperature is 21.6°C, and the average annual rainfall is 1,300 mm.The major forest types in this region are eucalyptus, Chinese fir, Masson pine, star anise, and other broadleaf evergreen forests.Eucalyptus plantations have expanded rapidly since 2002 because of their important economic values for local government and farmers.
2.2.Strategy and data sets
The framework for mapping eucalyptus carbon stock distributions and their changes, as well as the evaluation of model transferability at spatial and temporal scales, is illustrated in Fig.3.The major steps include: (1) mapping of carbon stock distribution for the typical sites(airborne LiDAR data available) based on airborne LiDAR metrics and field measurement; (2) preparation of samples from the LiDAR-derived carbon stock for modeling and validation at regional scale; (3) extraction of eucalyptus age in months and in years, respectively, from timeseries Landsat NDVI (normalized difference vegetation index) data, and design of variable scenarios;(4)establishment and evaluation of carbon stock estimation models at regional scale; (5) analysis of eucalyptus carbon stock model transferability; (6)analysis of carbon stock change.
Two kinds of remotely sensed data-airborne LiDAR and time-series Landsat NDVI were used, in addition to ancillary data (Eucalyptus distribution maps and eucalyptus age map in Yunxiao County were provided by the team members)(Table 1).Airborne LiDAR data in Yunxiao County was acquired in July 2021,while it in Gaofeng Forest Farm was acquired in January 2018.The field measurements of sample plots were conducted in the typical sites during the same period as the airborne LiDAR data acquisition.Considering the objectives of this research,we also collected plots from other periods in these study areas (January and December 2021 in Yunxiao County,and January 2020 in Gaofeng Forest Farm;most of these sample plots were re-measured at different periods).The spatial locations of all sites and sample plots are illustrated in Fig.2.
2.3.Eucalyptus carbon stock mapping in typical sites
2.3.1.Data collection and processing
2.3.1.1.Collection and calculation of carbon stock at sample plot level.The
field surveys were conducted in Yunxiao County three times, and in Gaofeng Forest Farm two times.Based on the eucalyptus distribution,sample plots were allocated according to the age groups, which were provided by the forest farm using a stratified sampling approach.A total of 46 sample plots were collected from Yunxiao County and 58 sample plots from Gaofeng Forest Farm.Taking eucalyptus age groups, topographic conditions,and working loads into account,a plot size of 20 m×20 m was used during the field measurement.The coordinates of four corners of each plot were recorded using a real-time kinematic (RTK)global positioning system for later co-registration with satellite images.Diameter at breast height (DBH) for each tree within the sample plots were measured.The allometric equations for major tree species in southern China(Eucalyptus and Chinese fir here because some plots have mixed eucalyptus with a limited number of Chinese fir trees)were used to calculate individual tree biomass (Table 2) (Du et al., 2014).The carbon stock of individual trees was obtained by converting tree biomass using the carbon coefficient corresponding to the tree species (Cai,2018).The carbon stock of a sample plot was the accumulation of carbon stocks from all individual trees within the sample plot, then it was converted into tons of carbon per hectare (t·ha-1).The statistical characteristics of the collected sample plots are summarized in Table 3.
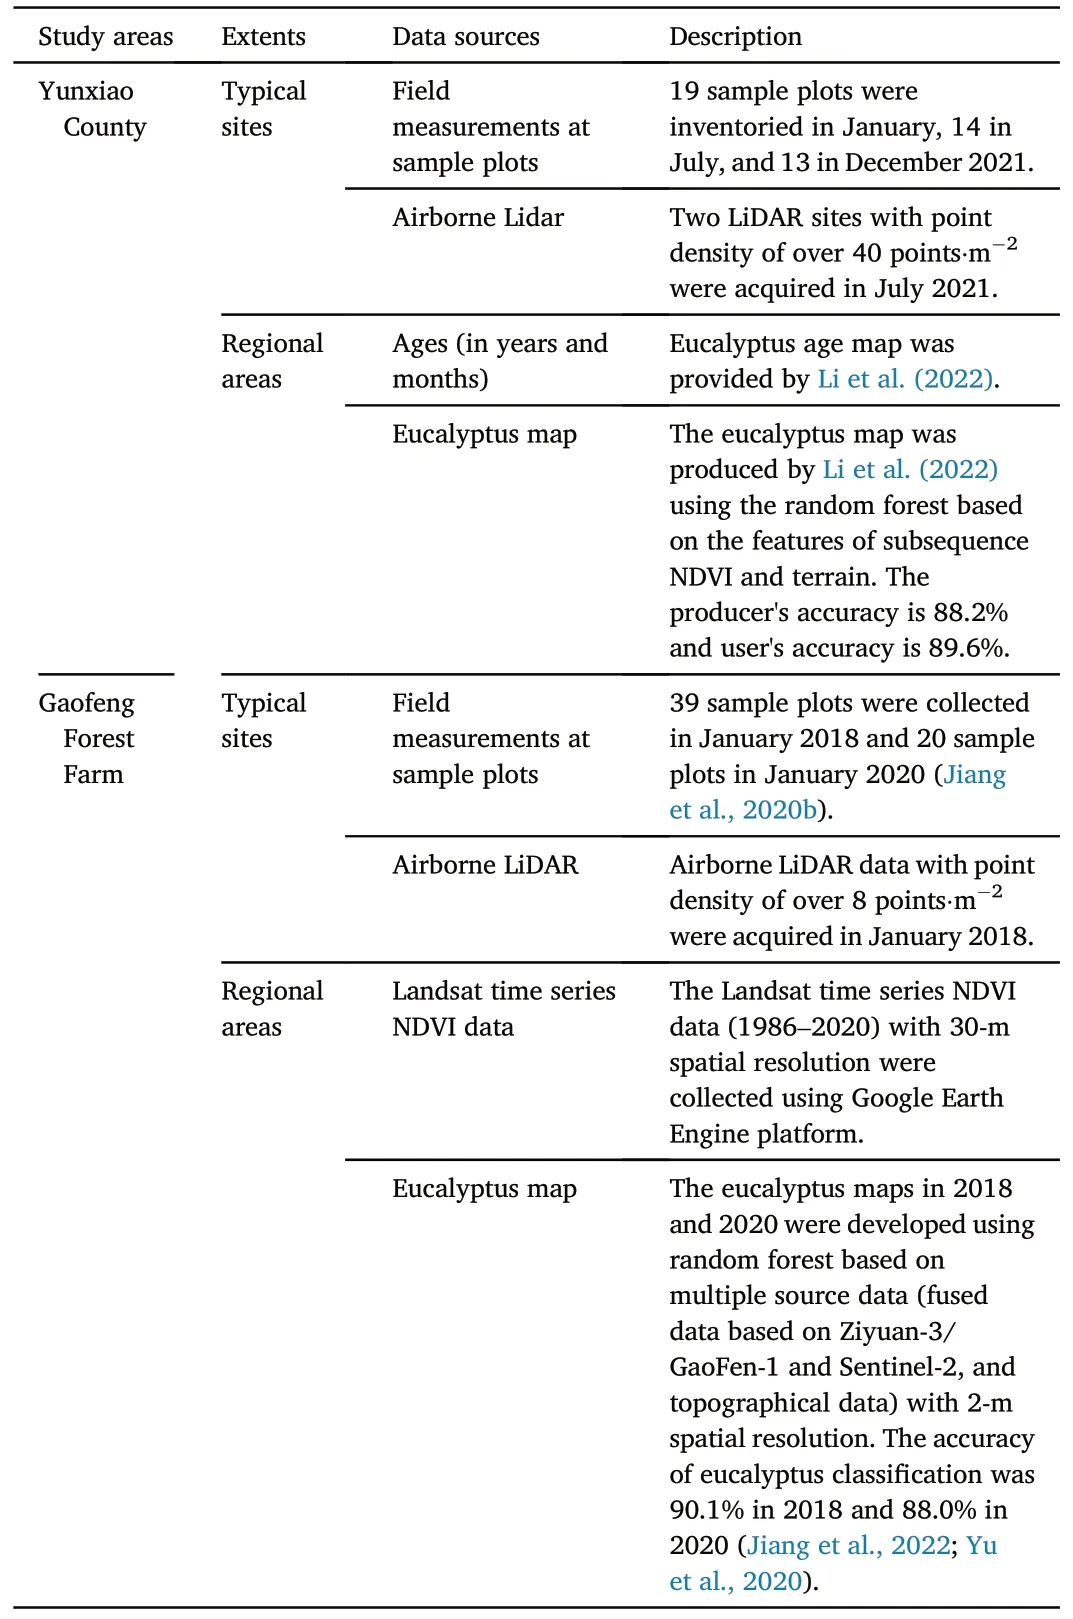
Table 1Dataset used in this research.

Table 2Biomass model parameters and carbon coefficient of two tree species.

Table 3Statistics of the collected sample plots data.
2.3.1.2.Collection and processing of airborne LiDAR data.Airborne LiDAR data with a point density of over 40 points·m-2were acquired in July 2021 in Yunxiao County using a R1350 LiDAR scanning system mounted on the unmanned aerial vehicle (UAV) RT470 at an average flight height of 150 m above ground.The airborne LiDAR data with a point density of 8 points·m-2for Gaofeng Forest Farm were acquired in January 2018 using a Riegl LMS-Q680i LiDAR scanner mounted on the LiCHyAOS system.A detailed description of the LiDAR systems used for surveys can be found in Jiang et al.(2020b).The airborne LiDAR data were processed using LiDAR360 software package (Zhou et al., 2019).The LiDAR points were labeled as ground and non-ground returns by the data provider.These ground returns were interpolated into a 1-m Digital Terrain Model (DTM) using an Inverse Distance Weight (IDW) interpolation algorithm.The relative height of every non-ground point was calculated as the difference between its Z coordinate and the underlying DTM elevation.The canopy height model (CHM) data with 1-m spatial resolution were produced from the relative heights of those non-ground points.From the CHM data,the common statistical metrics such as mean,standard deviation,skewness,kurtosis,and percentile heights(5th,10th,…,95th,98th,99th)were extracted with a window size of 20 m×20 m(the same size as sample plots) and used as predictor variables for later carbon stock estimation modeling.
2.3.2.Eucalyptus carbon stock mapping for typical sites
Linear relationships exist between eucalyptus carbon stock and LiDAR-derived height variables; however, some of those potential predictor variables may have high correlations.Thus, Pearson correlation analysis was conducted to examine the relationships between all variables, and stepwise regression was used to select the statistically significant variables for developing a eucalyptus carbon stock estimation model.The p-values were set as common values of 0.05 and 0.10 for determining whether a variable should be included in or removed from the model, respectively.To avoid data redundancy and reduce collinearity across the ingested parameters, variable selection was implemented prior to entering the model.A variable having a high correlation with other variables while having a low correlation with eucalyptus carbon stock was removed.These stepwise regressions resulted in a set of explanatory variables.To reduce the impact of geographical settings in different typical sites on model development, eucalyptus carbon stock models were developed separately for each study area.The modeling results were assessed using coefficient of determination(R2),root mean square error (RMSE), and relative RMSE (RMSEr).Due to the limited number of sample plots, leave-one-out cross-validation was used to evaluate the model's performance.The detailed leave-one-out cross validation procedures include:(1)splitting n sample plots into a training set that contains n-1 sample plots and a testing set that contains only one sample plot;(2)building the model using the training set and using this model to predict the carbon stock of one sample plot left out of the model(the testing set),and calculating the residual;(3)repeating the process n times until all sample plots were used as the testing set once; (4) calculating R2, RMSE, and RMSEr based on n predicted carbon stocks and residuals.Here, 18 and 31 samples were used as the training set in Yunxiao County and Gaofeng,respectively,while 1 sample plot was used as the testing set for each site.Then,the models developed for each site using all sample plots(19 for Yunxiao and 32 for Gaofeng)were applied to predict the eucalyptus carbon stock distribution in typical sites with a cell size of 20 m ×20 m.
2.3.3.Sample extraction for the LiDAR-based eucalyptus carbon stock estimation
The collection of a large number of sample plots in the field over a large region is expensive,leading to the difficulty of developing a reliable and robust carbon stock estimation model at a regional scale.Eucalyptus carbon stock distributions,which were retrieved from airborne LiDAR in typical sites, offer a potential source for obtaining a large number of carbon stock samples.Thus, these distributions were overlaid on the eucalyptus age products for the collection of sample plots.A stratified sampling approach according to age groups was used to collect initial samples with a size of 30 m × 30 m for each site (the same cell size as Landsat imagery).The initial samples were refined based on the predefined rules: (1) the samples located at the borders of LiDAR coverage and the non-eucalyptus areas were removed to ensure all samples within the eucalyptus regions; (2) the samples with mixed ages were removed considering the different cell sizes between the carbon stock distribution in typical sites(20 m×20 m)and the age product(30 m×30 m);(3)the samples in Yunxiao County located in the felling operation, which occurred between January and July 2021,were removed because there is a gap between the eucalyptus age product and the acquisition date of LiDAR data.The remaining samples were randomly divided into two groups: 60% of the samples were used as the training set for model construction,and 40%as the testing set for model validation.
2.4.Eucalyptus carbon stock mapping at regional scale
2.4.1.Development of eucalyptus age products from Landsat time-series data
Eucalyptus age map in months with 30-m spatial resolution in Yunxiao County was provided by Li et al.(2022).This product was generated from Landsat time-series data from August 1986 to January 2021 using an advanced method that integrates random localization segmentation and the Chow test to identify critical change points.The major steps include implementation of random localization segmentation for NDVI time-series change detection,determination of candidate change points,removal of spurious change points, classification of segments using random forest, and identification of eucalyptus regeneration, rotation cycle,and age(more details can be found in the publication by Li et al.,2022).The accuracy of the eucalyptus age product was evaluated with R2of 0.91 and RMSE of 13.3 months.The same procedures were also employed in Gaofeng Forest Farm for the retrieval of eucalyptus age in months from Landsat time series NDVI data (May 1986 and January 2021) in the Google Earth Engine (GEE)platform.
Because the eucalyptus age product in months of Yunxiao County was obtained from the end of January 2021, we added 6 months as the eucalyptus ages of July 2021.The resulting age products in months for both study areas were rounded to age in years, and ages less than 12 months were counted as one year old.All the age products were kept the cell size of 30 m×30 m as Landsat image,not resampled to 20 m×20 m as the LiDAR-derived carbon stock products.This is because the age product was extracted from Landsat NDVI images at pixel level without considering the mixed pixel problem and all selected samples for developing regional-scale models are within the same age.
2.4.2.Development of carbon stock estimation models at regional scale
Eucalyptus ages both in months and in years were used as predictor variables independently for developing carbon stock estimation models at regional scale for comparison purposes, especially for verification of the usability of the proposed eucalyptus age in months product.A simple linear regression model was implemented.Considering the non-linear relationship between age and carbon stock, the age was transformedinto logarithmic form.To explore the transferability of age-based eucalyptus carbon stock model, two stratification scenarios were designed.The stratification scenario was to develop models separately in two study areas using their own samples,while the non-stratification scenario was to develop models using combined samples from two study areas.

Table 4Estimation models and accuracy of eucalyptus carbon stocks in typical sites.
The modeling results from different scenarios were evaluated using validation samples for an overall assessment.Meanwhile,the R2,RMSE,and RMSEr were used to evaluate the modeling results according to age ranges,i.e.,<24,24-48,48-72,72-96,96-120,and >120 months,and the dependent t-test for paired samples(DTPS)was used to examine the differences between the estimates from various models under these scenarios.By comparing the performances of the developed models using age in months and in years under two stratification scenarios, the best model was selected and applied to predict the eucalyptus carbon stocks of the entire study area.
2.5.Transferability of the developed models at spatial and temporal scale
To assess the model transferability at the temporal scale,the selected estimation models from two study areas were applied to different dates.Specifically,in Yunxiao County,the models developed in July 2021 were used to predict eucalyptus carbon stock in January and December 2021,while in Gaofeng Forest Farm, the models developed in January 2018 were used to estimate eucalyptus carbon stock in January 2020.The estimation results were assessed using the available validation samples collected during the field work.To evaluate the transferability of the model at the spatial scale,the models developed in Gaofeng Forest Farm were transferred to Yunxiao County,and the DTPS was used to examine whether there was a statistically significant difference between the estimates from the transferred models and the original models.
2.6.Analysis of carbon stock changes at regional scales
The analysis of carbon stock change was conducted using the estimation results between January 2021 and December 2021 in Yunxiao County and between January 2018 and January 2020 in Gaofeng Forest Farm.Except for the natural growth of eucalyptus, logging and reforestation can drastically affect carbon stock changes.The emphasis of the change analysis was on the carbon stock increment due to natural growth and loss due to deforestation during the change detection periods.
3.Results
3.1.Eucalyptus carbon stock estimation in typical sites

Fig.4.Relationships between carbon stock estimates from Lidar data and reference data from field measurements.
A comparative analysis of the models (Table 4) indicates: (1) mean height(HME)and height of 55 percentile(H55)were the most important predictors in the models, implying that the average tree height can effectively reflect the eucalyptus carbon stock;(2)the model in Yunxiao County contains more predictor variables but has a slightly lower R2mvalue than Gaofeng Forest Farm,implying the importance of identifying suitable variables for a specific region.Assessment of carbon stock estimation results(Table 4 and Fig.4)indicate good modeling performance with R2vof 0.84 and 0.90, and RMSEr of 16.93% and 14.56%, respectively, in two sites.Fig.4 shows no obvious overestimation or underestimation of carbon stock with LiDAR data, which is conducive to subsequent analysis using LiDAR-estimated carbon stock as reference in regional modeling.The developed models were applied to the LiDAR covered areas in two sites,and eucalyptus carbon stock distribution maps were generated(Fig.5).
3.2.Eucalyptus carbon stock estimation at regional scale
A total of 216 samples were collected from the eucalyptus carbon stock distributions at typical sites.As shown in Fig.5, the numbers of samples from LiDAR flight areas are considerably different because of the sizes and shapes of the LiDAR areas and the eucalyptus distributions.The statistical results for these samples are summarized in Table 5, showing that the ranges of carbon stock values are between 1.4 and 99.0 t·ha-1with a mean value of 52.6 t·ha-1and a standard deviation of 18.9 t·ha-1.These samples were used as modeling samples for developing eucalyptus carbon stock estimation models at the regional scale.
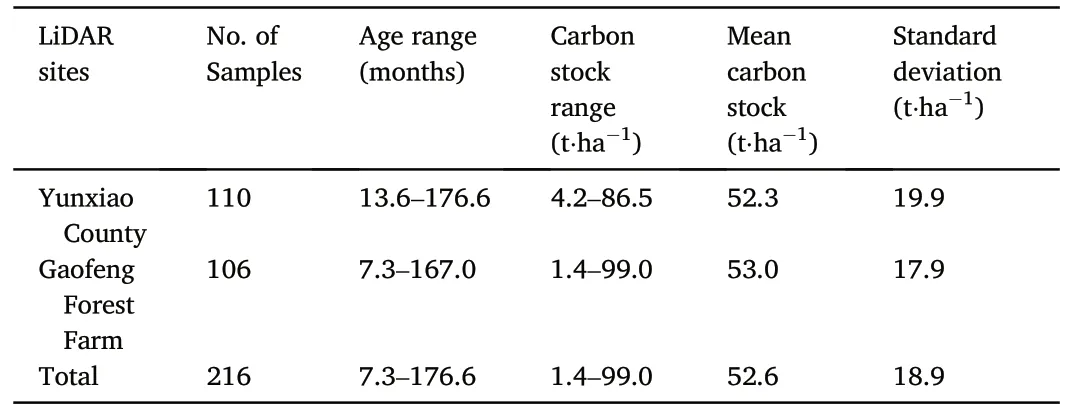
Table 5Statistics of the collected carbon stock samples from different airborne Lidar areas.
The modeling results at regional scale based on age in years and in months at different stratification scenarios(Table 6)indicate that(1)the month-based models resulted in slightly better estimation accuracies than the year-based models for both regions and for both stratification and non-stratification scenarios; (2) the stratification scenario had a better modeling performance than the non-stratification scenario, especially using the month-based modeling approach, the RMSE values decreased from 7.52 to 6.51 t·ha-1in Yunxiao County and to 6.33 t·ha-1in Gaofeng Forest Farm.
The scatterplots (Fig.6) show that carbon stock estimates and reference data have good linear relationships for different scenarios.The stratification scenario with both the year- and month-based models(Fig.6a2, b2) performs better than the non-stratification scenario(Fig.6a1, b1).Compared to the month-based modeling results, yearbased modeling results have a common problem: when carbon stock is less than ~50 t·ha-1, models have relatively poor performance.When eucalyptus plantations are young, the year-based model produces the same carbon stock estimates for similar ages in years;however,there is a significant variation in carbon stock for eucalyptus of different ages in months,implying that even if eucalyptus are planted in the same year but in different months, a few months’ difference can lead to a substantial error in the eucalyptus carbon stock estimation using the year-based model.When carbon stock was greater than 60 t·ha-1, no matter yearor month-based models, non-stratification scenario or stratification scenario, carbon stock estimates were similar.This finding emphasizes the importance of accurate age in months in improving carbon stock estimation for fast-growing species,such as eucalyptus.
DTPS tests (Fig.7) provide comparisons among the carbon stock estimates for different age groups under various scenarios in two regions.Overall, there are no significant differences between the year-based models and the month-based models for either non-stratification or stratification scenarios in both regions.However,significant differences exist between non-stratification and stratification scenarios with both the year- and month-based models in almost all age groups, except for eucalyptus older than 120 months in Gaofeng Forest Farm.Therefore,stratification, i.e., developing models for different geophysical regions independently,is necessary for obtaining accurate carbon stock estimates when age alone is used as a predictor variable.

Fig.5.Spatial distribution of predicted carbon stock distributions with 20 m spatial resolution using airborne Lidar data for Yunxiao (two flight sites - a1, a2) and Gaofeng Forest Farm (one flight site - b) and the selected samples.

Table 6Summary of accuracy assessment results at regional scale.

Fig.6.Relationships between carbon stock estimates and reference data.1 and 2 represent non-stratification scenario and stratification scenario;(a)and(b)represent eucalyptus age in months and in years.
Analysis of the modeling results for different age groups (Table 7)indicates that the stratification scenario performs much better than the non-stratification scenario when age is less than 48 months and slightly better than the non-stratification scenario for the age group of 48-96 months, except for the age group of 48-72 months in Yunxiao County.This situation implies that there is a large variation in the carbon stocks of relatively young eucalyptus plantations among different geographical locations, and a single carbon stock model (under the non-stratification scenario) with age as the only predictor does not sufficiently satisfy different locations.The evaluation results also indicate that the monthbased model considerably improves the carbon stock estimation when the eucalyptus age is less than 48 months.For example,when the eucalyptus age is less than 24 months, the month-based model with nonstratification scenario reduced RMSEr by 6.17%in Yunxiao County and 3.44%in Gaofeng Forest Farm compared to the year-based model,while with stratification scenario, the RMSEr can be reduced by 16.45% and 8.01%.When eucalyptus plantations were older than 48 months, the year- and the month-based models had similar RMSEr values.This research indicates that the use of a month-based variable is particularly effective for very young eucalyptus plantations.
The spatial distributions of eucalyptus carbon stock predictions using the month-based models under the stratification scenario (Fig.8) indicate that the carbon stocks vary in different regions.Most eucalyptus plantations in Yunxiao County in July 2021 had carbon stocks between 15 and 55 t·ha-1,and only a few places had carbon stocks larger than 65 t·ha-1, while in Gaofeng Forest Farm the carbon stock was between 45 and 75 t·ha-1in January 2018.The spatial patterns clearly show both very low (less than 10 t·ha-1) and very high (greater than 75 t·ha-1)carbon stock values, implying this model has good performance in predicting high or low carbon stock values.
3.3.Transferability of eucalyptus carbon stock estimation models at spatial and temporal scales
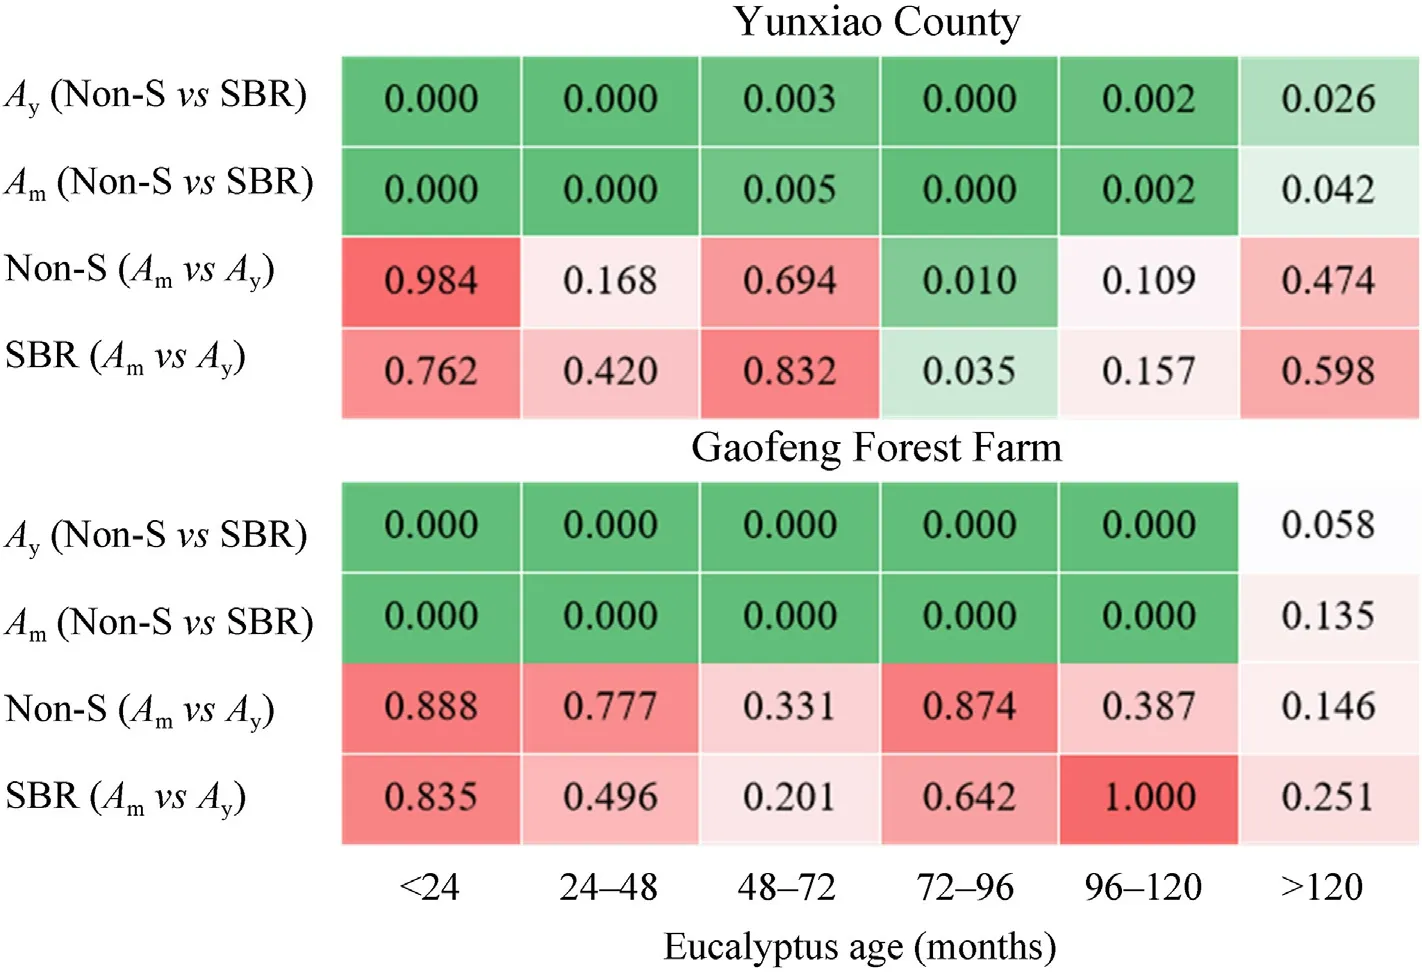
Fig.7.p-values resulted from DTPS tests between carbon stock estimates of eucalyptus samples at different ages; p-value <0.05 indicates a significant difference between the two scenarios.Non-S and SBR (stratification by region) represent non-stratification and stratification scenarios,Am and Ay are age in months and years.

Table 7Accuracy analysis of carbon stock modeling results based on different age ranges.
The developed month- and year-based models were applied to estimate eucalyptus carbon stocks at other dates, and the estimates were evaluated using sample plots collected during the same periods.Accuracy assessments (Fig.9) show a high transferability of estimation models in general,but it varies among dates and regions.Specifically,the model in Yunxiao County has better transferability for both January and December 2021 than that in Gaofeng Forest Farm for January 2020,reflected by the higher R2and smaller RMSEr values.In terms of dates, the model performed better in January than in December 2021 in Yunxiao County.In addition, there are obvious biases in Gaofeng Forest Farm (located in a non-LiDAR flight area)for both year-based(5.19 t·ha-1on average)and month-based models(5.27 t·ha-1on average).The year-based model has a similar performance to the month-based model, but there is a big difference between the prediction results of the two models when the carbon stock is less than 20 t·ha-1.For instance, a plot with the smallest carbon stock was significantly underestimated in December of Yunxiao County(Fig.9b2), which was consistent with that in Table 7.
To examine the spatial transferability of age-based models, the models developed from Gaofeng Forest Farm for January 2018 were applied to Yunxiao County, and the predicted eucalyptus carbon stocks were compared to the estimates of July 2021 directly using the local models specifically for Yunxiao County.The analyses (Fig.10) indicate that, on the whole, model transfers performed slightly worse than the corresponding local models; RMSE and RMSEr increased by 2.54 t·ha-1and 4.94%with the month-based model,and 0.65 t·ha-1and 3.22%with the year-based model.Further analyzing the predictions from local and transferred models for different carbon stock levels,we found that these models function differently (Table 8).For instance, the local Yunxiao models predicted much better than the transferred model when the carbon stock is relatively small,especially when the carbon stock is less than 20 t·ha-1(difference of 58.46% with the month-based model and 46.66% with the year-based model).However, the transferred models performed similarly to the local models when carbon stock is greater than 40 t·ha-1,even better than the year-based model.This finding is valuable for the framework of carbon stock in eucalyptus plantations at regional or global scales, specifically, necessitating stratification of carbon stock or ages into different levels.
3.4.Eucalyptus carbon stock change
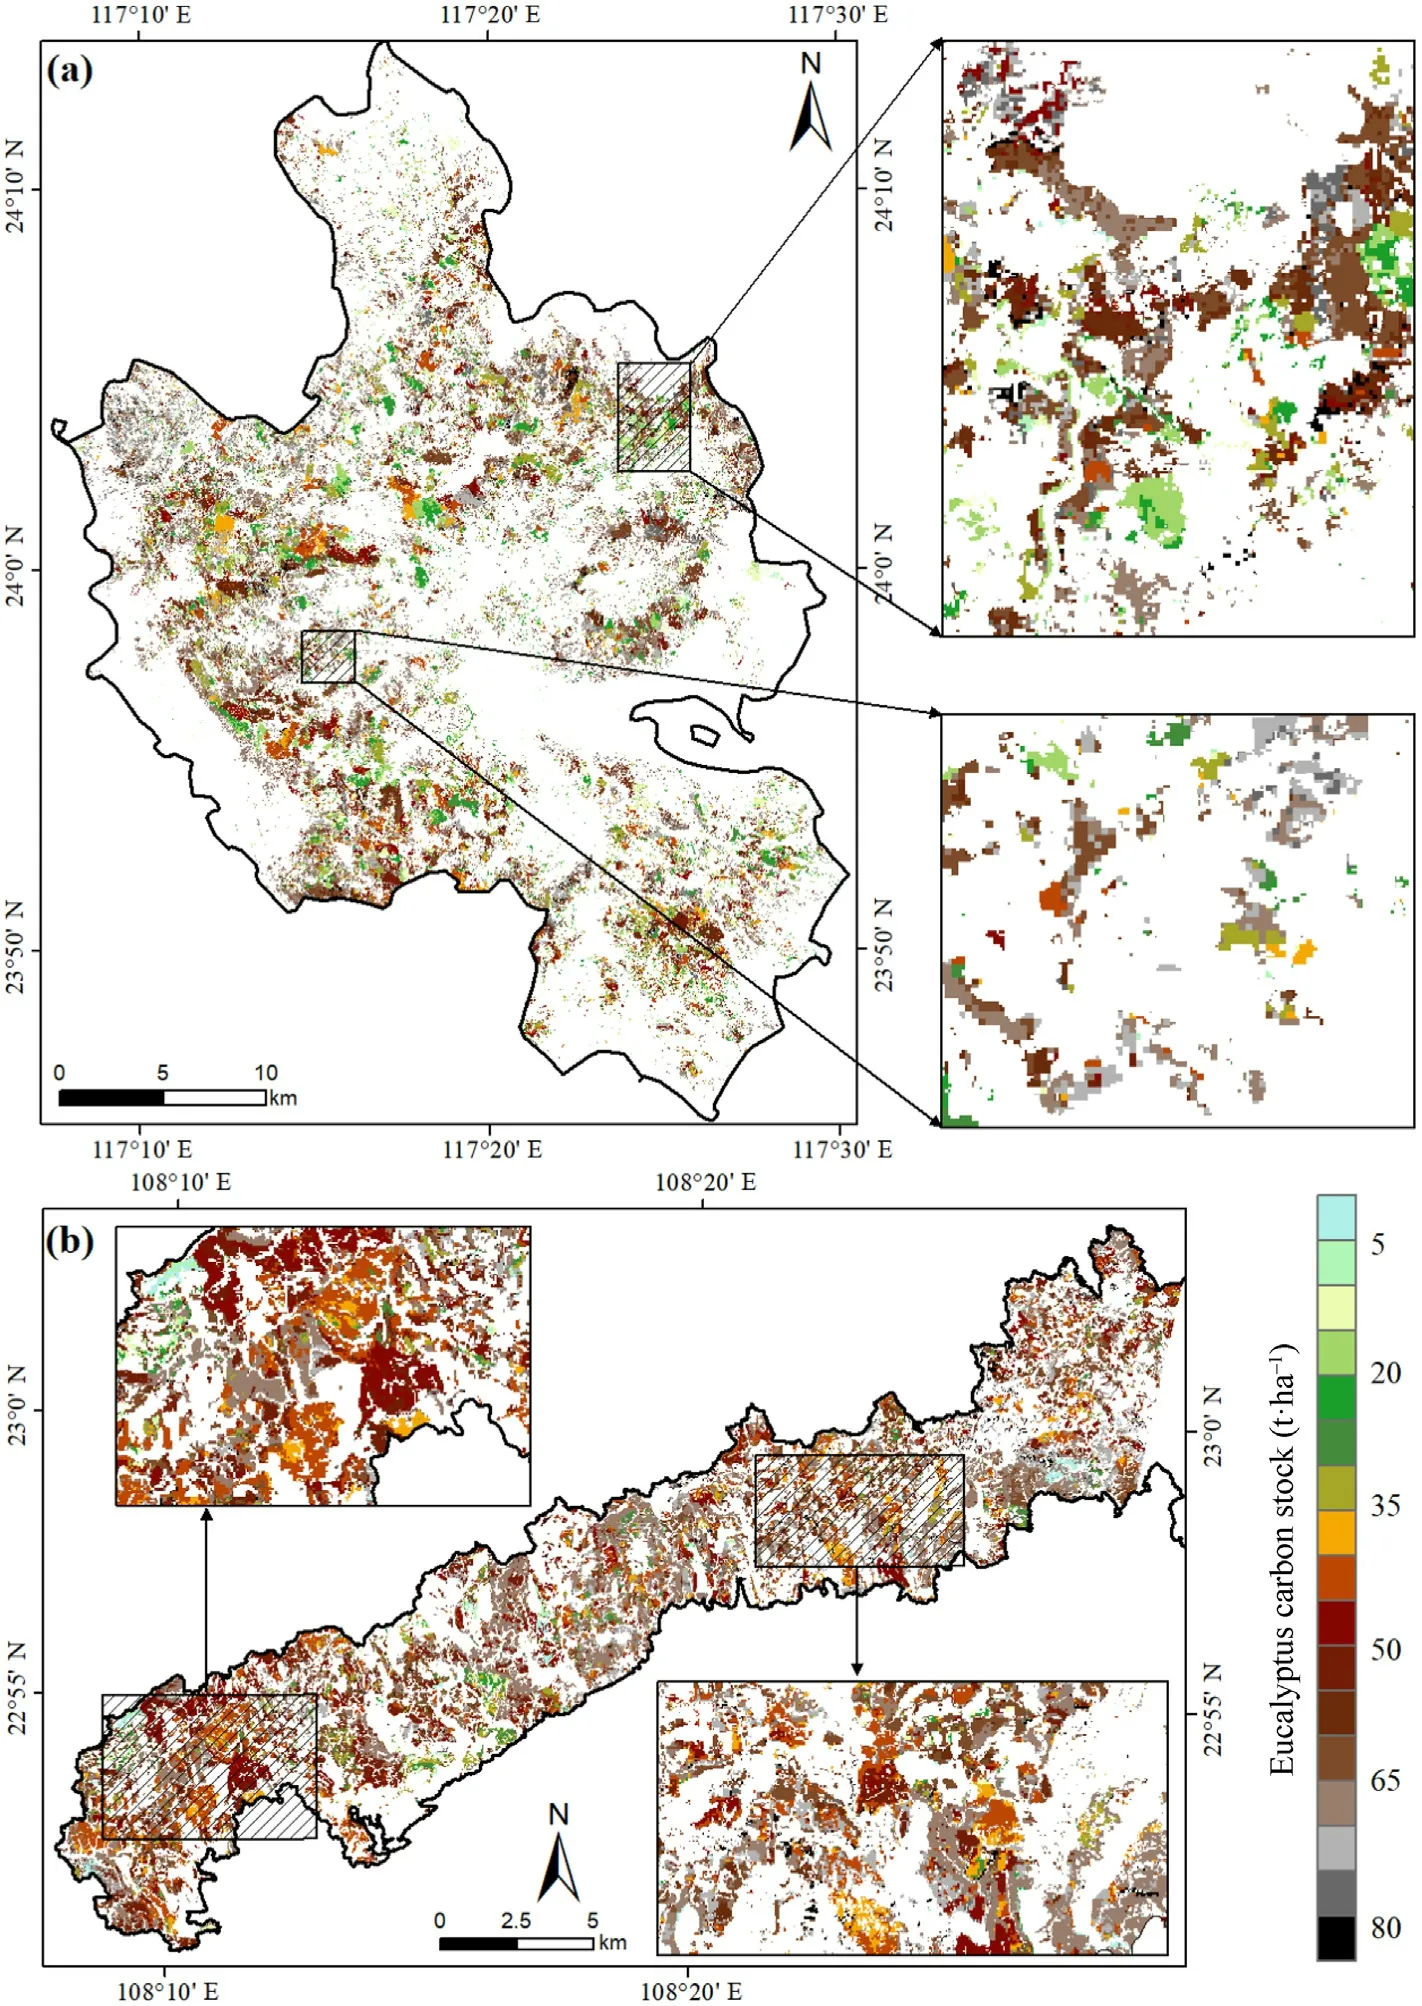
Fig.8.The predicted carbon stock distribution in two regions using the month-based model.(a) Yunxiao County in July 2021; (b) Gaofeng Forest Farm in January 2018.
Eucalyptus carbon stock changes were obtained from a comparison of carbon stocks between January 2021 and December 2021 in Yunxiao County and between January 2018 and January 2020 in Gaofeng Forest Farm.The results are presented in Fig.11, showing that most of the eucalyptus plantations in Yunxiao County experienced carbon stock gains,despite a small amount(less than 10 t·ha-1in one year),and some plantations lost their carbon stocks due to deforestation.In contrast, a large area of eucalyptus plantations in Gaofeng Forest Farm experienced carbon loss of more than 45 t·ha-1due to deforestation, while some plantations gained carbon stock of greater than 20 t·ha-1because of growth.By comparing the carbon stock change map with the eucalyptus distribution change map, we found that carbon stock losses between 0 and 45 t·ha-1are more likely to correspond to reforestation following the harvest,occurred during two years in Gaofeng Forest Farm.For both regions, carbon losses greater than 60 t·ha-1corresponded to the clearcut areas, indicating that the removal of eucalyptus plantations resulted in large carbon loss.
Boxplots of carbon gains by ages for unchanged eucalyptus plantations were created for both regions(Fig.12a and b),showing the similar trends of carbon stock changes with ages.Carbon stocks accumulate rapidly when eucalyptus trees are young.For example, the 1-3 year plantations in Yunxiao County witnessed a tremendous carbon stock increment,up to 20 t·ha-1in one year.However,as eucalyptus grew,the carbon stock increment slowed down,and the increment became only 2 t·ha-1yearly when the eucalyptus reached 144 months(12 years).
4.Discussion
4.1.Importance of vegetation age in improving carbon stock estimation
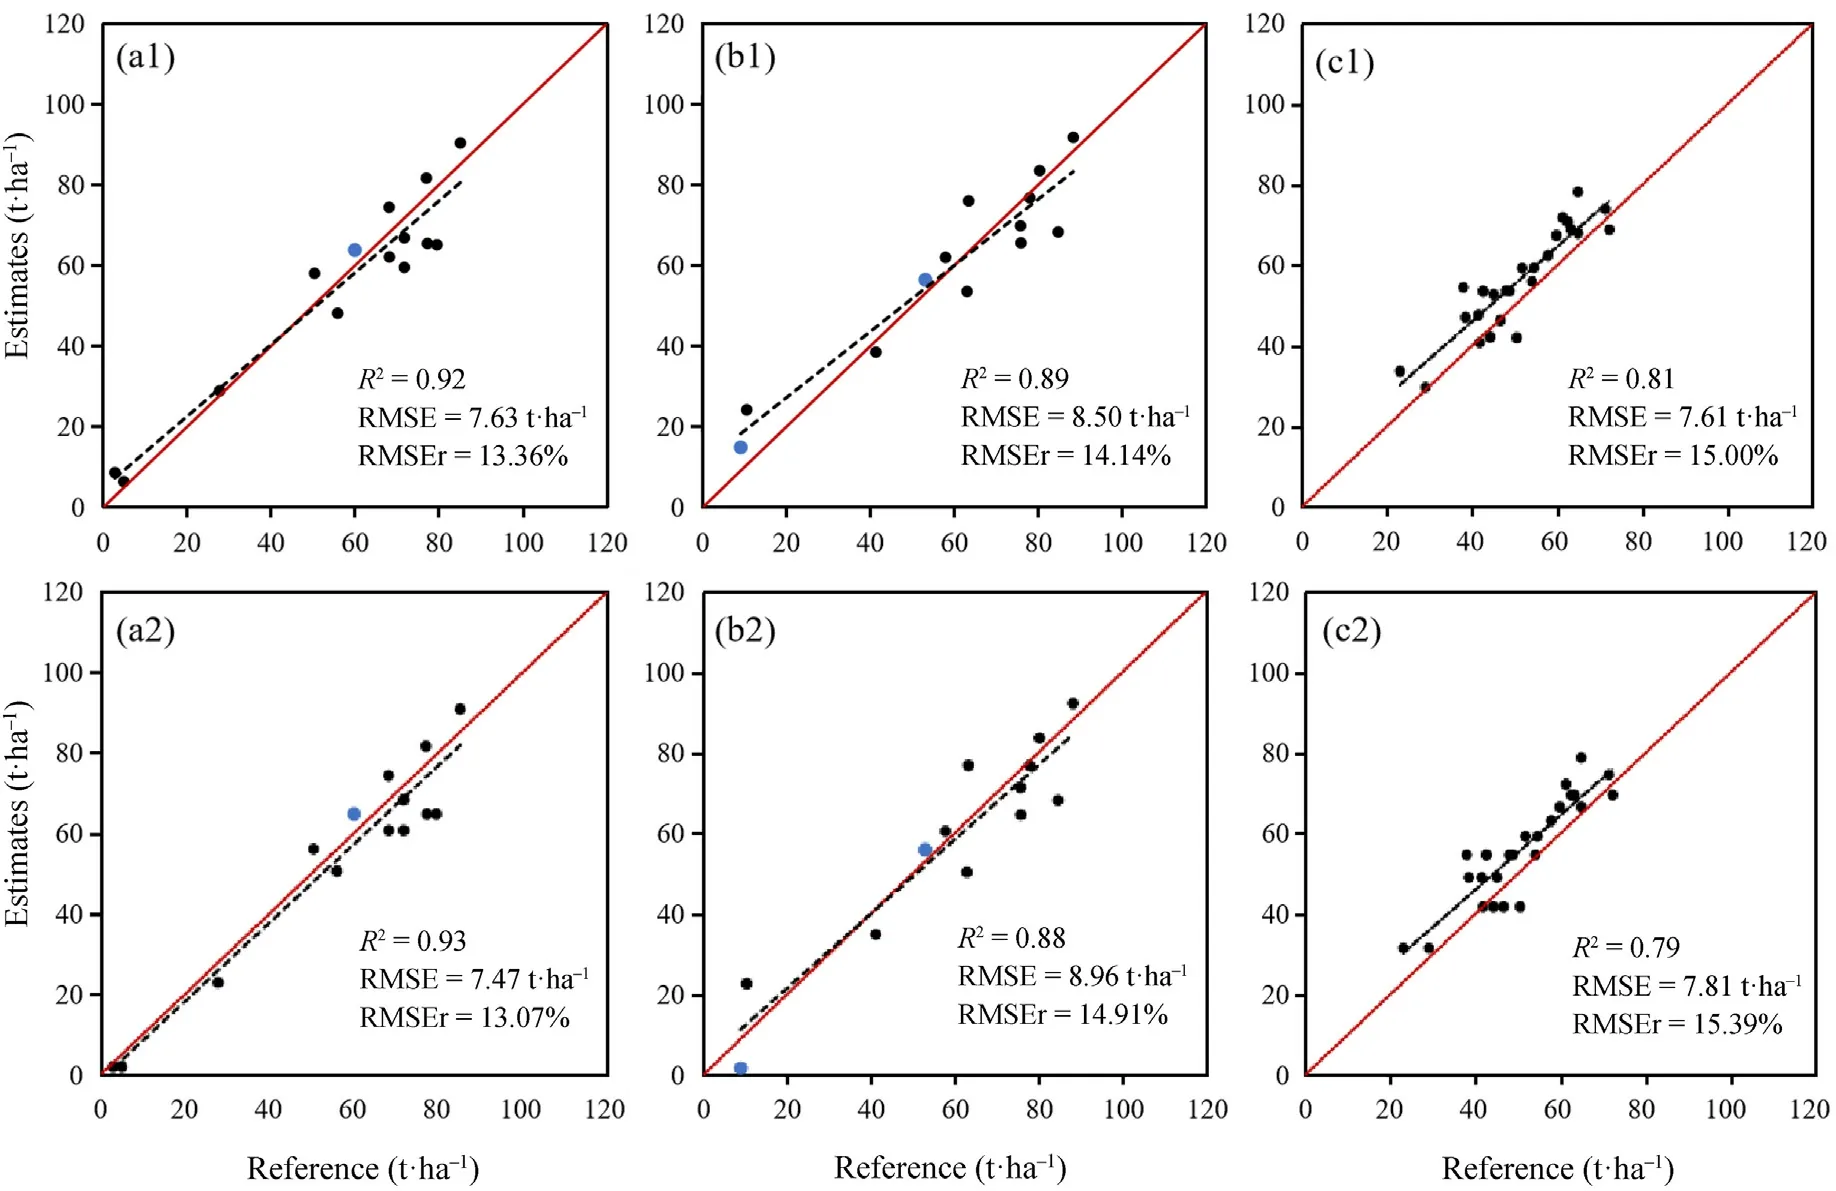
Fig.9.Comparisons of eucalyptus carbon stock model transfer performances at temporal scale(1 and 2 represent eucalyptus age in months and in years;(a)and(b)represent Yunxiao County in January and December 2021; (c) represents Gaofeng Forest Farm in January 2020; the blue dots represent non-retest sample plots in Yunxiao County).(For interpretation of the references to colour in this figure legend, the reader is referred to the Web version of this article.)
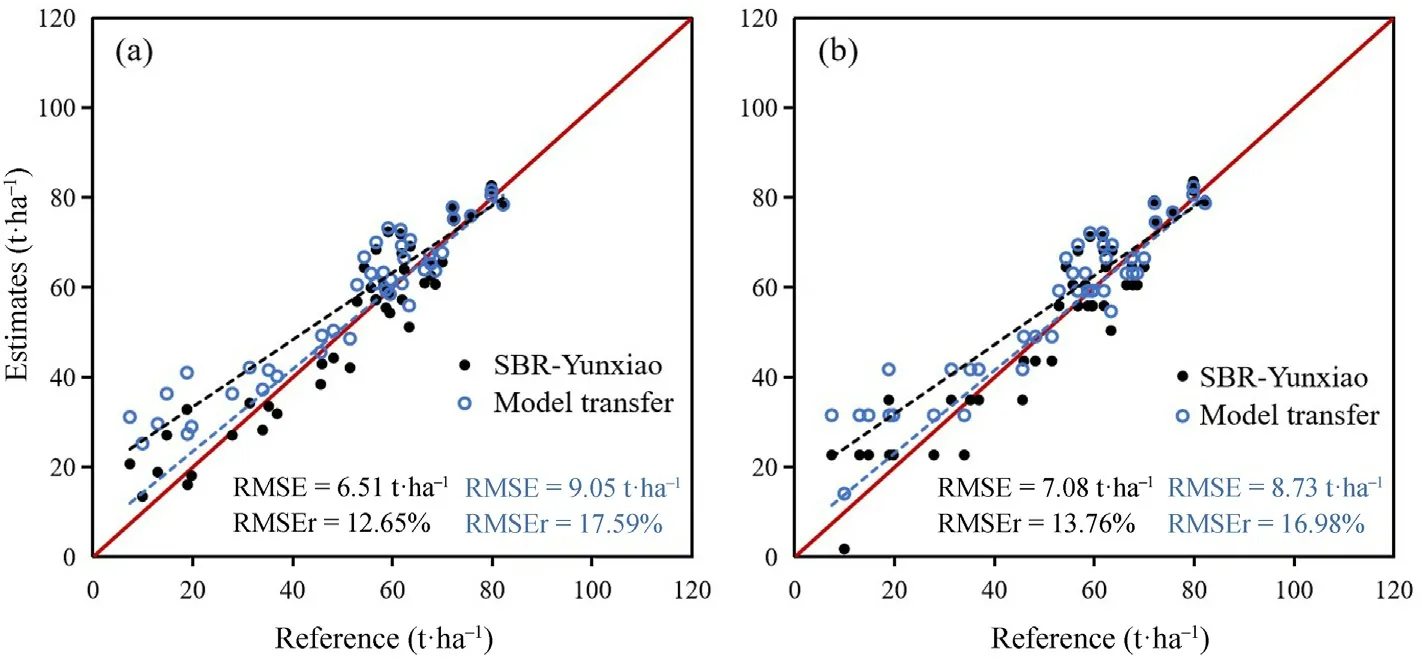
Fig.10.Comparisons of carbon stock estimates in July 2021, Yunxiao County, resulted from the transferred models with the local models: (a) Models with age in months; and (b) models with age in years.SBR stands for stratification by region.
Vegetation age has long been recognized as an important variable for forest stock volume or carbon stock estimation because each tree species has its own growth curve over time.Previous studies had explored carbon stock modeling using age in years as a predictor variable (Sun et al.,2016; Fang et al., 2019; Nguyen et al., 2019).For instance, Fang et al.(2019) established the linkage between biomass (can be converted to carbon stock by multiplying a constant) of Chinese fir plantations and their ages by combining allometric equations and relative growth rates,and substantially improved biomass estimates(R2=0.77,RMSE=37.7 t·ha-1).The carbon stock of eucalyptus varied significantly with increasing crown width at young stage (nearly to 2 years), and the sensitivity of spectral responses to carbon stock declines with age once the stand reached a certain density, known as saturation (Zhao et al.,2016).Liu et al.(2022) found that using only Landsat 8 OLI spectral bands and vegetation indices with the K-nearest neighbor(KNN)method resulted in an RMSEr of 41.01%for eucalyptus carbon stock estimation in Gaofeng Forest Farm,Guangxi.However,when age information obtained from forest surveys was added as a predictor variable, the RMSEr decreased by 7.22%.This highlights the significance of using age as a variable in improving eucalyptus carbon stock estimation.This study also confirmed the importance of utilizing age in years for estimating eucalyptus carbon stock, especially for eucalyptus plantations older than 4 years; however, the year-based model performed relatively poor estimation for young eucalyptus plantations.This is because the age in years is too coarse to effectively capture the growth characteristics of fast-growing tree species such as eucalyptus and poplar plantations at their juvenile phase (Maire et al., 2011), indicating the necessity to use the age in months for developing a eucalyptus carbon stock estimation model.As our results showed, the month-based model outperforms the year-based model when eucalyptus age is less than 24 months (RMSEr was improved by 16.45%in Yunxiao and 8.01%in Gaofeng,see Table 7).This finding is valuable in carbon stock modeling with age for other fast-growing tree species.As more and more different sensor data areeasily accessible, vegetation age in months will be more accurately obtained from dense time series of remotely sensed data (Nguyen et al.,2019), providing a promising approach for carbon estimation in a large area.
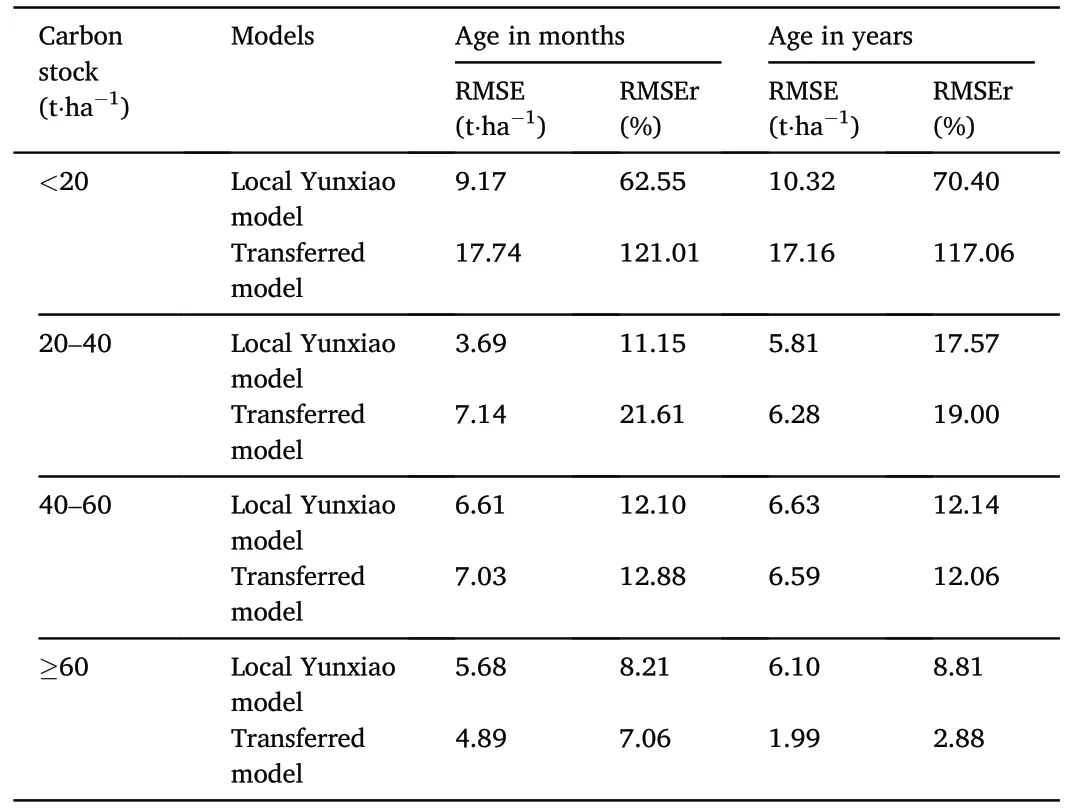
Table 8Performance comparisons of transferred models and local models in Yunxiao County according to carbon stock (t·ha-1)ranges.
4.2.Limitations and potential improvement of age products
Forest age largely determines forest carbon stock, and extraction of accurate forest age information is essential for assessing changing trends of forest carbon stock over time at regional scale.However, forest age information derived from remotely sensed data is subject to various uncertainties.In this study, the accuracy of eucalyptus age product was reported with an RMSE of 13.3 months(Li et al.,2022).After removing five misclassified samples,the RMSE decreased to only 6.06 months.To evaluate the influence of age error on model prediction and transferability, we conducted a simulating experiment that adjusted the eucalyptus age by±3,±6,and±12 months and estimated carbon stocks using the models developed for each typical site.The carbon estimates under different scenarios were compared to the original estimates from the age product as well as to the references of the field plots.The results for two typical sites are illustrated in Fig.13,showing that carbon stock estimates exhibit different degrees of derivation from the original estimates across age groups.The larger the errors, the wider the discrepancies between the estimates and the original estimates; however, such discrepancies shrink as age increases.For example,for young eucalyptus with less than 24 months, the responses of carbon estimates to the age errors are very sensitive; even a small age change can result in a large departure of the carbon stock estimate from the right one.When an age error increased by 12 months, the carbon stock estimate error enlarged by almost 20%.In contrast, when the eucalyptus is older than 100 months, the derivations of carbon stock estimates with erroneous ages from the original estimates do not exceed 4 t·ha-1.This implies that the age error up to 12 months does not significantly impact the accuracy of carbon stock estimation of older eucalyptus plantations (over 8 years).The effect of age error on carbon stock estimation of different aged eucalyptus was also revealed in model transfer at temporal scales,where the largest predicted carbon stock errors arise from the young eucalyptus.Thus,improvement of age accuracy of young eucalyptus is necessary for better carbon stock estimation of eucalyptus.
We compared the accuracies of several high-resolution(30 m×30 m)age products in southern China, which were developed from different datasets using various methods(Table 9),and found that eucalyptus age products have a smaller RMSE than other forest types, and the age product used in this study, which was developed by our team (Li et al.,2022), has the best accuracy,ensuring reliable carbon stock estimation.However, the 13.3 months of RMSE still caused high uncertainties in carbon stock prediction.Currently, most age products are developed from a long-term Landsat time series by detecting forest disturbances and are largely affected by the number of available Landsat images.Due to frequent cloud covers in subtropical and tropical regions, high-quality images are limited, resulting in the low age accuracy of the extracted forests,including eucalyptus forests.Thus,combined use of multi-sources including optical (e.g., Landsat and Sentinel-2) and Radar (e.g.,Sentinel-1) provide a promising solution for improving the accuracy of forest age estimation,especially for young eucalyptus.
4.3.Model transferability for examining forest carbon stock change
Model transferability has long been an important research topic in remote sensing fields(Foody et al.,2003;Lu,2005;Santoro et al.,2022),but it is challenging because of the inherent characteristics of remotely sensed data and complex environmental conditions (Lu et al., 2016).In order to make the developed model transferable, one critical step is to seek reliable and physically meaningful variables as predictors in model development.Vegetation age is such a variable that is closely related to vegetation growth and carbon stock accumulation under similar physical conditions and forest management; thus, an age-based model has the potential of temporal transferability in forest carbon stock estimation,making change analysis possible (Sun et al., 2016; Fang et al., 2019).Since time-series data (e.g., Landsat) are available at no cost, some scholars have explored the possibility of incorporating time series features into forest carbon stock change analysis (Hu et al., 2016; Puliti et al.,2021);however,studies have rarely successfully developed models based on spectral and/or spatial features for carbon stock changes(Jiang et al.,2020a).This study explored the transferability of age-based models at temporal and spatial scales and found that the age-based models can be better transferred at the temporal scale than at the spatial scale.For example,when the model was developed based on the data of July 2021 and was then applied to predict carbon stocks in January and December 2021 in Yunxiao County, the RMSE values were only 7.63 and 8.50 t·ha-1respectively, proving that the age-based model can provide accurate estimates of eucalyptus carbon stock for different dates (Figs.9 and 11), and annual carbon stock change analyses were practicable.
The model transfer from Gaofeng Forest Farm to Yunxiao County increased the RMSEr by 4.94% (month-based model) and 3.22% (yearbased model) compared to the corresponding local models.Caution should be taken when the age-based model is transferred to different regions where the geographical conditions are significantly different,particularly when young plantations are dominant.As shown in Table 8,the large errors came from the estimation of relatively small carbon stocks, such as less than 20 t·ha-1.The possible reason may be the combined effect of different eucalyptus species or variants, supporting management, climate, and soil conditions on the carbon stock accumulation in young plantations in different regions.The better estimation results from region-stratification(Table 6)also confirm the influences of external factors such as physical conditions (terrain, climate, soil) and management practices on carbon stock estimation.Therefore, more research is needed to explore the integration of different data sources,such as soil and climate data, in the modeling procedure (David et al.,2022;Sagar et al.,2022).In this study,the estimated carbon stocks from LiDAR data were used as references on a regional scale instead of the sample plot data.This may be helpful to reduce some influence of environments on the final carbon stock estimation (Lefsky et al., 2011;Coops et al.,2021).However,the collection of sample plots from typical sites is still needed to fully address this issue.

Fig.11.Spatial distribution of eucalyptus carbon stock change: (a) Yunxiao County between January and December 2021 and (b) Gaofeng Forest Farm between January 2018 and January 2020.

Fig.12.Eucalyptus carbon stock changes at different age periods.(a)represents the carbon increment within one year(January-December 2021);(b)represents the carbon increment within two years (January 2018-January 2020).

Fig.13.Residual analysis under different adjusted eucalyptus ages at temporal scale.(a) represents Yunxiao County in January and December 2021; (b) represents Gaofeng Forest Farm in January 2020.

Table 9Accuracies of available forest age products in Southern China.
4.4.Role of LiDAR data in developing a regional-scale carbon stock estimation model
The collection of a sufficient number of sample plots with fully spatial representativeness is critical for carbon stock estimation modeling in a large area but often difficult because of the high cost and intensive labor(Lu et al., 2016).One solution to collect sufficient sample plots while reducing field work is to use LiDAR data,considering LiDAR's capability of accurately characterizing carbon stock in natural and planted forests,especially eucalyptus (Dong and Chen, 2018; Coops et al., 2021).Previous studies showed that R2of the eucalyptus carbon stock model with LiDAR data reached over 0.75, and RMSEr was about 20% (Hirigoyen et al., 2020; da Silva et al., 2020).Our results are even better than previous studies with R2of 0.86 and 0.91 and RMSEr of 16.9%and 14.6%in two subtropical regions, respectively.It is worth noting that there is an error of about 15%-17%from the ground survey plots to the LiDAR data.However,when LiDAR-predicted carbon stocks were used as samples to develop regional models, the estimation errors of all models, including stratification and non-stratification scenarios, were less than 15%.
To justify the role of using LiDAR-derived carbon stock product for upscaling,the Monte Carlo method was employed to simulate the errors induced by the LiDAR-based model.Considering that these errors do not entirely adhere to a normal distribution,Gaussian noise was not utilized for the simulation.Instead, random errors ranging from -15 to +15 t·ha-1(the residuals observed in LiDAR-derived carbon stock) were generated and subsequently added to the typical eucalyptus carbon stock maps.Due to the changes in the LiDAR-derived carbon stock maps, the coefficients of the age-based models change accordingly, resulting in variations in the carbon stock estimates.The estimates were assessed using both samples derived from the LiDAR-derived carbon stock maps and field surveys from different dates.With a 1,000-times simulation using R software, the statistics of accuracy assessments are summarized in Table 10.It shows that for both typical sites, the average RMSEs evaluated using the samples collected from LiDAR-derived maps are smaller than those evaluated using references from field plots.It is easy to understand that for the first situation, both the training samples and validation samples were collected from the same populations - LiDARderived carbon stock maps, while for the second situation, the training and validation samples came from different populations.Actually, the differences are not significant.In addition,Yunxiao has a large portion of young eucalyptus,so small errors added to the samples will result in large variations in carbon stock estimates,causing a larger RMSE than Gaofeng Forest Farm.In terms of RMSEr, when utilizing the field samples to validate the two-stage model results,the average RMSErs were 13.97%in Yunxiao and 15.1%in Gaofeng.Therefore,overall,the errors produced in the first stage (field plot- LiDAR)do not transfer much into the second stage(LiDAR-age-based).
The multiple modeling approaches from finer to coarser scale often involve the error propagation problem and all errors generated in the previous steps may be accumulated in the final.However, our study indicates that error propagation does not simply add up and may cancel each other out,resulting in satisfactory accuracy.It implies that using the airborne LiDAR data as a‘bridge’to link plots to region for developing a regional forest carbon stock estimation model is feasible.Therefore,LiDAR-predicted carbon stock at the local scale is valuable for enlarging the number of samples for model development and validation at the regional scale.However,more research on error propagation is needed to quantify how errors are transferred from one stage to another for understanding the error sources.
5.Conclusions
This study explored the integration of LiDAR and forest age data for mapping eucalyptus carbon stock distribution in the subtropical regions.The results illustrated that amplifying number of samples from airborne LiDAR prediction is very useful for forest carbon stock estimation at a regional scale.A comparative analysis of carbon stock estimation from the models with age in months and age in years indicates that the monthbased model performed better with RMSEr of 12.65%in Yunxiao County and 12.00% in Gaofeng Forest Farm than the year-based model with RMSEr of 13.76% and 13.78%, respectively.The year-based model has poor performance, especially when the eucalyptus plantations are younger than 24 months.The age in month-based models is robust in terms of temporal transfer with the RMSE of less than 8.5 t·ha-1in two regions.Caution should be taken when the month-based or year-based models are transferred at spatial scales to predict carbon stock for young eucalyptus plantations.
Funding
This work was supported by the National Key R&D Program of China(Grant No.2021YFD2200400102) and Fujian Provincial Science andTechnology Department (Grant No.2021R1002008).

Table 10Error analysis of upscaling methods using Monte Carlo simulations.
Availability of data and materials
Due to confidentiality agreements, some supporting data related to sample plots and Lidar data can only be made available to Bona Fide researchers subject to a nondisclosure agreement.Other data related to eucalyptus distribution and carbon stock product are available upon request.Details of the data and how to request access are available from Professor Dengsheng Lu at Fujian Normal University.
Declaration of interests
The authors declare that they have no known competing financial interests or personal relationships that could have appeared to influence the work reported in this paper.
CRediT authorship contribution statement
Xiandie Jiang:Data curation, Methodology, Resources, Software,Validation, Writing - original draft.Dengqiu Li:Formal analysis,Methodology,Resources,Writing-review&editing.Guiying Li:Formal analysis, Methodology, Resources, Writing - review & editing.Dengsheng Lu:Conceptualization, Data curation, Formal analysis, Funding acquisition, Investigation, Methodology, Project administration, Resources, Supervision, Visualization, Writing - original draft, Writing -review&editing.
Acknowledgements
The authors would like to thank Mingxing Zhou,Yunhe Li,Yi Zhang,and Xiaoxue Li for their supports in field inventory and sample data processing.
- Forest Ecosystems的其它文章
- Divergent responses of Picea crassifolia Kom.in different forest patches to climate change in the northeastern Tibetan Plateau
- Tree-based ecosystem services supply and multifunctionality of church forests and their agricultural matrix near Lake Tana, Ethiopia
- Influence of climate fluctuations on Pinus palustris growth and drought resilience
- Nutrient retranslocation strategies associated with dieback of Pinus species in a semiarid sandy region of Northeast China
- Book review “Continuous Cover Forestry - Theories, Concepts, and Implementation” by Arne Pommerening
- Impact of black cherry on pedunculate oak vitality in mixed forests:Balancing benefits and concerns

