Sensitivity of forest phenology in China varies with proximity to forest edges
Weibin You, Ziyi Xian, Guoyi Zhou, Evgenios Agathokleous, Zhen Yu,*
a College of JunCao Science and Ecology, Fujian Agriculture and Forestry University, Fuzhou 350002, China
b Fujian Southern Forest Resources and Environmental Engineering Technology Research Center, College of Forestry, Fujian Agriculture and Forestry University, Fuzhou 350002, China
c Key Laboratory of Ecosystem Carbon Source and Sink, China Meteorological Administration (ECSS-CMA), School of Applied Meteorology, Nanjing University of Information Science and Technology, Nanjing 210044, China
d Research Center for Global Changes and Ecosystem Carbon Sequestration&Mitigation,Nanjing University of Information Science&Technology,Nanjing 210044,China
Keywords:Phenology sensitivity Edge effects Planted forests Natural forests Climate change
ABSTRACT
1.Introduction
Shifts in plant phenology serve as valuable indicators of climate change, reflecting the intricate dynamics of carbon exchange between the biosphere and the atmosphere (Sippel et al., 2018; Li et al., 2023).These variations in plant phenology can impact ecosystem productivity(Piao et al., 2019; Koebsch et al., 2020), triggering cascading effects on global biogeochemical cycles, food availability, disease spread, and pollination season length (Ettinger et al., 2018; Wang and Tang, 2019;Han and Christine,2019).Additionally,phenology plays a crucial role in shaping feedbacks between vegetation and climate system by influencing the seasonality of albedo, surface roughness length, and canopy conductance(Richardson et al.,2013).
The phenological differences between vegetation types and the sensitivity of phenology to climate factors have been extensively studied(Menzel et al., 2001; Thackeray et al., 2016; Park et al., 2020).Among vegetation types, forests have received considerable attention (Keenan et al., 2014; Berra and Gaulton, 2021).Forests have experienced extensive disturbances caused by human activities (Ma et al., 2023).Anthropogenic activities such as changes in land cover and land use,cultivation of crops,and forest harvesting have become the most significant drivers of forest ecosystem disruption(Haddad et al.,2015;Pfeifer et al.,2017;Meeussen et al., 2020).These activities have led to fragmentation and patchiness of large forest areas(Collinge,2009;Fischer et al.,2021).As the process of forest fragmentation intensifies, the length and extent of forest edges have markedly increased (Fischer et al., 2021).Currently,nearly 20%of the global forest area is situated within 100 m of a forest edge (Haddad et al., 2015).
The presence of forest edges was reported to have caused about 10%of the decrease in carbon density in tropical forests(Haddad et al.,2015).Studies have also shown variation in vegetation phenology along the temperature gradient from urban to suburban areas(Zhou et al.,2015),which is primarily attributed to changes in heat conditions.Similarly,nutrient conditions vary from the central part of forests to the edges(Baker et al., 2014; Remy et al., 2016; Garvey et al., 2022).This is characterized by noticeable differences in microclimate (e.g.radiation,wind,temperature)as well as shifts in the composition and dynamics of plants, animals, and microorganisms along the forest edge, which vary from the edges toward the forest interior after forest fragmentation(Pfeifer et al.,2017;Smith et al.,2018;Fahrig et al.,2019).For example,edge effects, characterized by higher temperature and light incidence,advanced flowering and fruiting by around 20 d in a Cerrado tree of Brazil(Vogado et al.,2016).More strikingly,the losses in upper canopy of the edge areas were reported 3 months earlier compared with interior forests in Amazonian evergreen forests, implying a shortened photosynthetic-active period and reduced carbon fixation (Nunes et al.,2022).
China has been experiencing unprecedented forest recovering processes (Dong et al., 2023), contributing substantially in global greening(Chen et al.,2019).A concurrent decline in forest fragmentation has been observed in southern China(Ma et al.,2023),despite that China's green policies have not entirely stopped fragmentation of natural forests and the establishment of plantation forests in patches also creates forest edges(Liu et al.,2019).As China's forested area continues to expand and forest quality improves, understanding the characteristics and mechanisms of the response of forest phenological events to edge effects becomes essential for projecting ecosystem carbon sequestration under future climate scenarios and improving forest management strategies.
Moreover,the forest edge effects are closely related to forest structure differences along the proximity to edge area.Such differences were widely observed in forests with different origins.Generally,natural forests have a higher species richness than planted forests, and consist of more complex and stable communities with diverse age structures.Plants in natural forests are less subjected to human interventions, while planted forests are primarily established through artificial seeding or planting and have a lower biodiversity due to dominancy of monoculture.Thus,the phenological responses of natural and planted forests to climatic factors might be shaped by distinct species composition, structure, and demography (Müller et al., 2021; Nunes et al., 2022).Given the edge effects and essential impacts of phenology,quantifying these differences is crucial,considering that China holds the world's largest area of planted forests, with an approximately 23% of the global plantation area (Food and Agriculture Organization of the United Nations,2020).For example,a former study revealed a strong carbon sink in China(Yu et al., 2022),primarily driven by young planted forests.Thus, the shifts in forest phenology in China could lead to substantial changes in land carbon sequestration.However, although the variations of forest phenological events, e.g.leaf-flushing and senescence, are intensively monitored (Yu et al., 2017; Zhao et al., 2022; Piao et al., 2022), no research has been conducted to compare the phenological differences between planted and natural forests.Thus, whether the sensitivity of phenology to climate change differs between planted and natural forests remains unknown,introducing a large uncertainty in the projection of forest carbon uptake capability.Therefore, it remains unclear whether (i) forest phenology changes with proximity to edges and (ii) the sensitivity of phenological events to climatic factors varies with proximity to the edge.Closing these knowledge gaps would enhance biogeochemical cycle modelling, especially considering the increasing occurrence of forest fragmentation(Brinck et al.,2017), and provide valuable insights for improving forest management strategies aimed at enhancing forest stability.
In this study,we aimed to(1)examine the differences in response of phenological events (i.e.green-up date, dormancy date, and growingseason productivity) to climate (air temperature and precipitation) in both planted and natural forests in China,and (2) quantify the sensitivities of phenological events to the proximity to forest edge in the two forest types.To this purpose, we derived phenology events and their sensitivities, including green-up, dormancy, and growing-season timeintegrated NDVI, in China's planted and natural forests using Moderate Resolution Imaging Spectroradiometer (MODIS) Normalized Difference Vegetation Index (NDVI) datasets and meteorological data during the period of 2000-2022.
2.Materials and methods
2.1.Study area and data
This study focuses on the mainland of China, where a nationwide forest survey campaign was conducted during 2011-2015 (Tang et al.,2018).The NDVI(Normalized Difference Vegetation Index)data used in this study were obtained from MOD13Q1, which covers China with a spatial resolution of 250 m and a 16-day interval during the period from 2000 to 2022.Climate data, including monthly air temperature and precipitation, were sourced from the Loess Plateau SubCenter, National Earth System Science Data Center, National Science & Technology Infrastructure of China (http://loess.geodata.cn); the resolution was 1 km (Peng et al., 2019; Peng, 2020).The forest map was derived from Yang and Huang(2021),and its resolution was 30 m.
2.2.Identifying the proximity of forest sites to forest edge
To assess the proximity(distance)of the forest sites to the forest edge,we conducted an overlap analysis between the forest sites obtained from the national survey campaign and the forest map derived from Yang and Huang(2021).The“Near”function in the“proximity”toolbox of ArcMap was then utilized to calculate the distance from each forest site to the nearest forest edge.Forest sites located within 2 km from the inner forest to the edge were selected for further analysis, as the number of sites decreased with increasing distance from the edge.After processing, a total of 3384 forest sites were retained,comprising 2,468 natural forests and 916 planted forests.The distribution of the forest sites is illustrated in Fig.1.
2.3.Phenology detection
The NDVI data(MOD13Q1 v006)were calculated from MODIS bands as a normalized transformation of the near infrared to red reflectance ratio:
where Rrand Rnirare the spectral reflectance in red and near infrared bands,respectively (Sun et al.,2012).
The algorithms proposed by Gao et al.(2021) were adopted for phenology identification in this study(see Fig.2).More specifically,the algorithms consisted of a double-logistic function and a “greendown”parameter(Elmore et al.,2012):
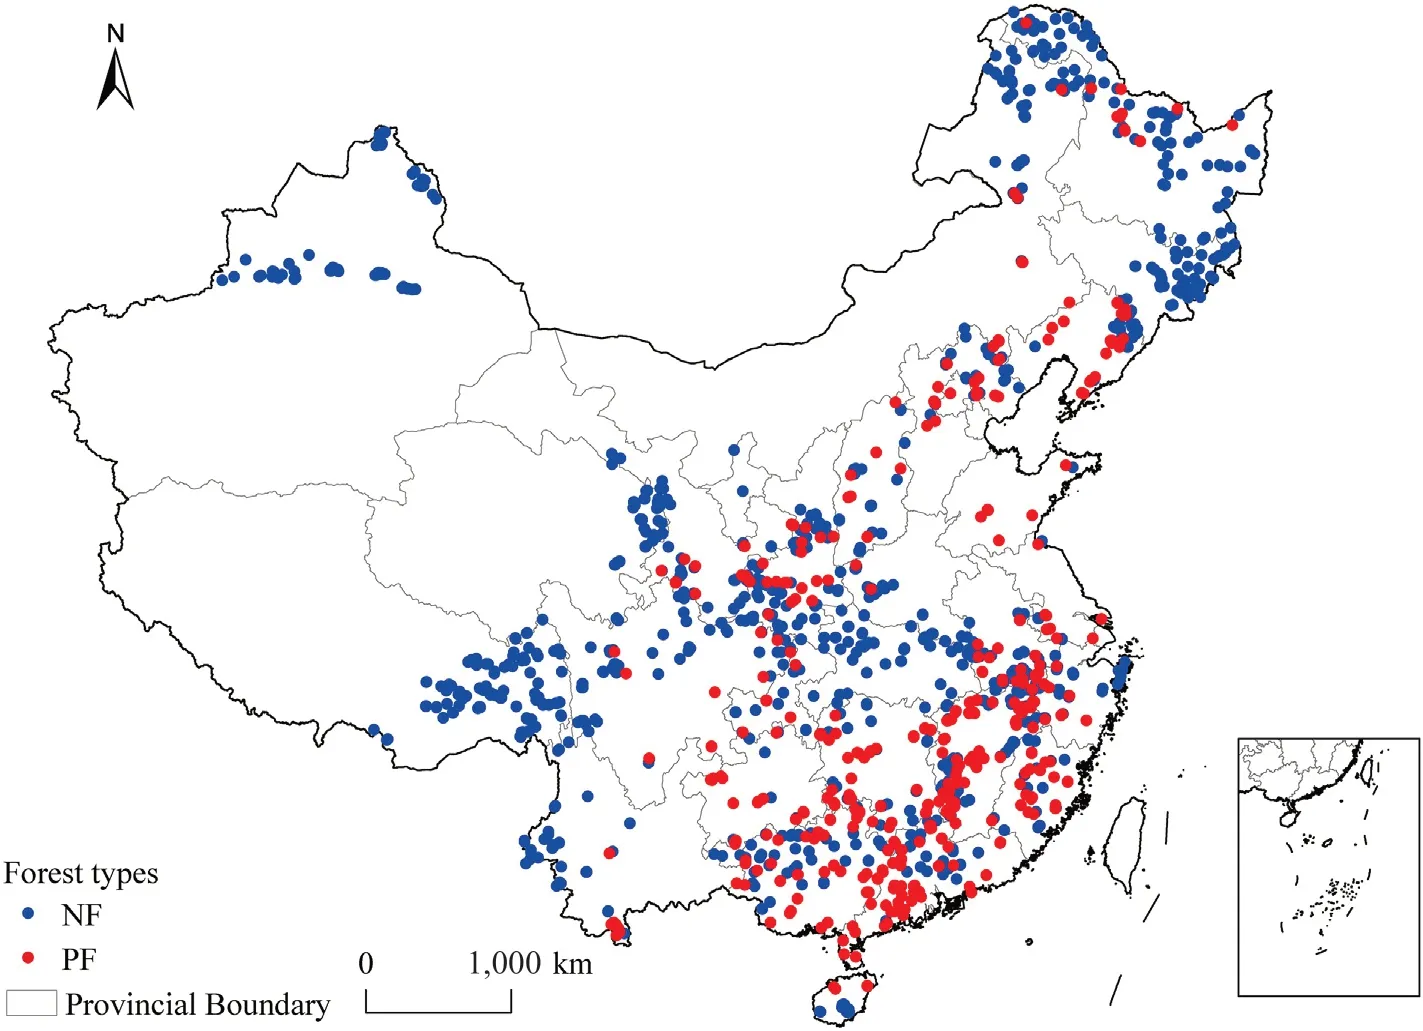
Fig.1.The distribution of selected natural (NF) or plantation (PF) forest sites in China.Note: The maps of China used in this study are based on the standard maps downloaded from the National Bureau of Surveying and Mapping Geographic Information Standard Map Service website (review number: GS (2020)4619),and the base map has not been modified.
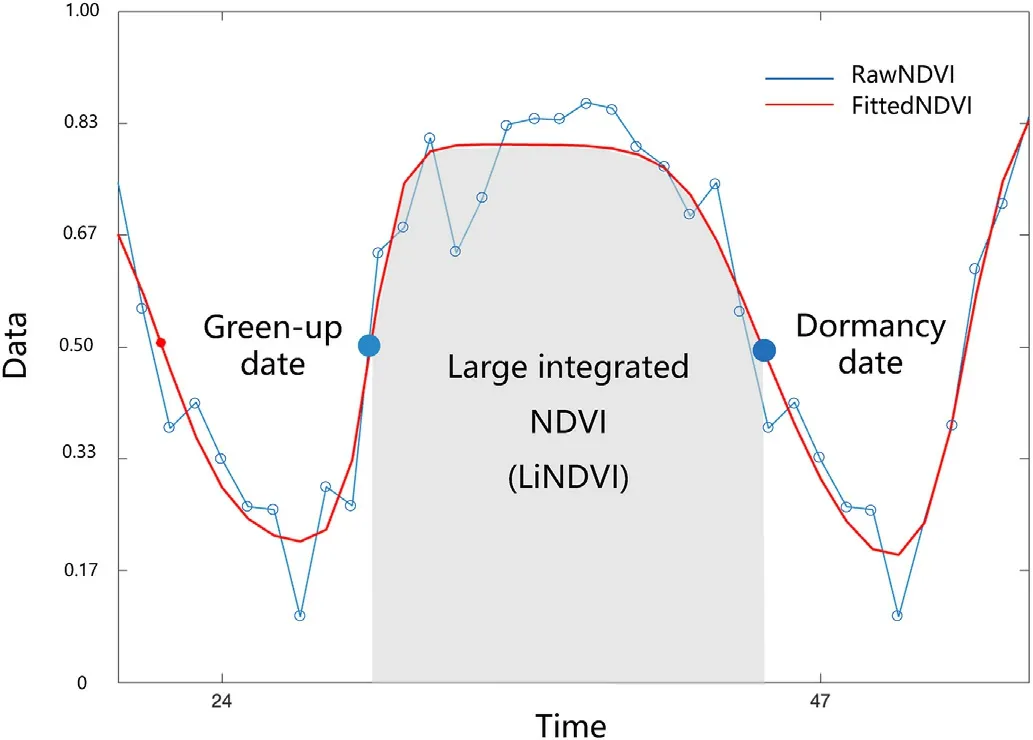
Fig.2.The schematic diagram of the phenological events examined in a forest site.NDVI: Normalized Difference Vegetation Index.
where v(t,m)is the modeled NDVI at t day of year(DOY),and m1to m7are parameters determining the shape of the double-logistic function.Specifically, the m7is the “greendown” parameter that accounts for the NDVI greendown phenomenon in the mid-summer time (Gao et al.,2021).The details of each parameter can be found in Gao et al.(2021).
In general, maximum likelihood estimation methods, such as nonlinear least squares (Menke, 2018), were used to fit NDVI available within a single year.In this study,the NDVI data quality flag was used to exclude grids affected by cloud.Therefore,if the NDVI data are sparse in a year, the model might fail to identify the phenology events due to model convergence issue or large parameter variance(Gao et al.,2021).
Three phenological indexes were examined in this study, including green-up date,dormancy date,and the large integrated NDVI(LiNDVI).The LiNDVI is time-integrated NDVI calculated from cumulative growing season NDVI,which is a metric of vegetation activity(Jia et al.,2006;Sun et al.,2012)and overall productivity(Pettorelli et al.,2005).The LiNDVI was used in this study as a metric to compare the growing-season vegetation productivity between forest sites.
2.4.Sensitivity of phenological indexes to climate factors
In this study, the sensitivity of phenology to pre-season air temperature and precipitation was examined.The pre-season average air temperature and total precipitation were defined as (i) from March to May for the green-up date,(ii)from August to October for the dormancy date,and (iii) from May to September for the growing-season LiNDVI.We quantified the phenological sensitivity using the slope of the linear regression between phenology and pre-season climate factors.The forest sites were grouped based on distance intervals of 100 m from the edge to the inner forest.The planted forest sites with a proximity to edge between 1,300 and 1,800 m were grouped together due to scarce samples(N=9).Note that green-up and dormancy dates beyond the ranges of the first half of the year(the 1-181 d)and the second half of the year(the 182-365 d)were filtered,respectively.After filtering,in total 3,258 forest sites were used, including 2,399 and 859 sites from natural and planted forests,respectively.To examine the changes in the sensitivities of phenological evens to the proximity to forest edge,both linear and quadratic functions were used.Specifically,linear regression was adopted when p >0.10 in both fitted functions, while an equation with higher R2was adopted when p <0.10.To assess the potential impact of the tree species characteristics and forest type on phenological sensitivity, we examined the dominant tree species in each forest plot, including the comparisons of evergreen and deciduous types, and their preference for light or shade.For example,forest plots were flagged as sites dominated by either lightdemanding or shade-tolerant species by referring to the Flora of China(https://www.iplant.cn/frps).Furthermore, we also examined human disturbances impacts on the phenology pattern.The human disturbance types and intensities were recorded by interviewing local residents or officers from agriculture and forestry departments (Tang et al., 2018).Specifically, the human disturbances include timber harvesting, thinning,understory plants harvesting,and grazing,etc.The forest plots were grouped into three types with different disturbance intensities:mild(no activity and mild), moderate, and severe.Unfortunately, details of the disturbances (e.g., frequency, timing) were not available (Yu et al.,2020).Thus,it should be noted that the analyses of the disturbances on forest phenology should be interpreted with caution.
We found that there were 2011 and 1160 sites from evergreen and deciduous forests, and the plots under mild, moderate, and severe disturbances were 2,323,715,and 203,respectively(Figs.S1a and S1c).In comparison,the forest plots were dominated by light-demanding species(N=3,123,Fig.S1b),while the sample size of shade-tolerant species was too small(N=118,Fig.S1b).Therefore,the impacts of the preference for light or shade were not included in the analyses.The details of the plot numbers along the proximity to the forest edge were presented in Fig.S1.The biological characteristics of the twenty dominating species commonly found in the study area were listed in Table S1.The data analyses and plotting were performed in R 4.2.2.
3.Results
3.1.Phenological indexes along the distance to forest edge
Significant differences of green-up date(Fig.3a;p=0.087,median at 137 day of year(DOY)vs.133 DOY),dormancy date(Fig.3b;p <0.05;median at 258 DOY vs.267 DOY),and LiNDVI(Fig.3c;p <0.01)were found between NF and PF.Generally, earlier green-up dates, later dormancy dates, and higher LiNDVI were found in PF than in NF(Fig.3a-c).The green-up date showed a change from postponing to advancing trend with increasing proximity to edge in NF (Fig.3d, R2=0.37,p <0.05),while no significant trend was found in PF(Fig.3d,p >0.10).In comparison,the dormancy date showed a delayed trend of 0.9 d·km-1with increasing proximity to edge in NF(Fig.3e,R2=0.32,p <0.05), while no significant trend was found in PF (Fig.3e, p >0.10).Besides, no significant trend was found in LiNDVI in both NF and PF(Fig.3f,p >0.10).
3.2.Phenology sensitivity to temperature along the gradient of proximity to edge
The overall sensitivities of green-up dates and LiNDVI to temperature were higher in PF than in NF (Fig.4a and c, p <0.05), while no significant differences were found in the sensitivities of dormancy dates to temperature by pooling all samples (Fig.4b, p >0.10).Moreover, the green-up sensitivity to air temperature was dominated by negative values in NF, with the majority varying between -1 and 0 d·°C-1(Fig.4a).Notably,the green-up sensitivity to air temperature showed a shift from negative to positive from edge to inner forest in NF(Fig.4a,R2=0.52,p<0.01).In comparison,the green-up sensitivity to air temperature was commonly negative in PF,but no significant trend was detected along the distances of sites to forest edge (Fig.4a,p >0.10).
The sensitivity of the dormancy date to air temperature was generally positive in both NF and PF, while there was no significant linear trend(Fig.4b,p >0.10).Similarly,the LiNDVI was generally positive in both NF and PF,with some higher values found in PF(Fig.4c).
3.3.Phenology sensitivity to precipitation along gradient of proximity to edge
Overall, the dormancy dates and LiNDVI were more sensitive to precipitation in NF than in PF (p <0.01;Fig.5b and c), but no statistically significance was found in green-up dates (p >0.10; Fig.5a).The green-up sensitivity to precipitation shifted from negative values to positive values in NF,with the majority varying between-0.02 and 0.01 d·mm-1along the edge gradient (Fig.5a, R2= 0.18, p = 0.064).In comparison, the green-up sensitivity to precipitation was dominated by negative values,and no significant trend was detected along the distance of sites to forest edge in PF(Fig.5a, p >0.10).
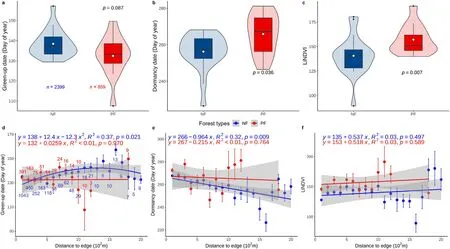
Fig.3.The comparisons of green-up date(a,d),dormancy date(b,e),and annual large integrate NDVI(LiNDVI,c,f)between NF and PF(the upper panels show the comparison of the differences by pooling all the samples;p indicates the significance level of the difference between NF and PF calculated by the Wilcoxon two-sided test;sample size of NF and PF are 2,399 and 859,respectively;the lower panels show the changes by the proximity to edge.Red and blue circles indicate the average values within each distance-to-edge interval of planted and natural forests;error bars indicate one standard deviation from the mean;the numbers below the error bars indicate the sample size;note that the sample size of NF or PF are same in the lower three panels and are therefore labeled in one panel only.(For interpretation of the references to color in this figure legend, the reader is referred to the Web version of this article.)
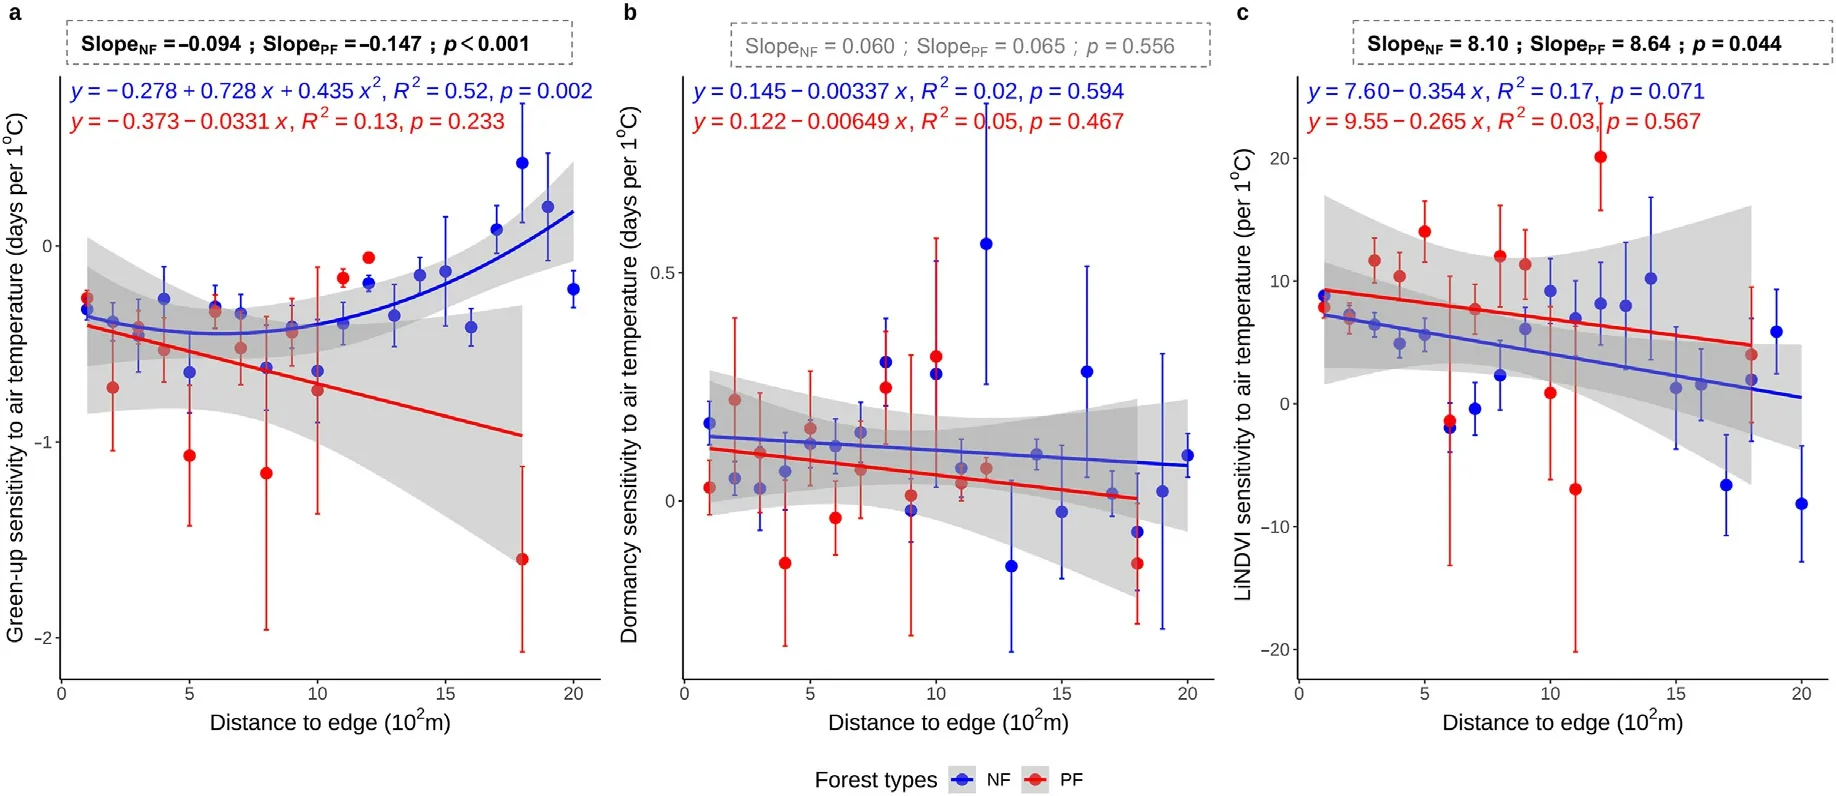
Fig.4.Sensitivity of the average green-up date sensitivity to air temperature (a), average dormancy date to air temperature (b), and average annual large integrate NDVI(LiNDVI)to air temperature(c)with proximity (along the distance)to edge.Red and blue circles indicate the average values within each proximity interval of planted and natural forests;error bars indicate one standard deviation from the mean;the boxes above the figure indicate the significant test results between NF and PF using all samples.The slope values indicate the median of the sensitivity;p indicates the significance level of difference between NF and PF calculated by the Wilcoxon two-sided test;test results with p <0.05 were bolded,and non-significant result was showed in grey.(For interpretation of the references to color in this figure legend,the reader is referred to the Web version of this article.)
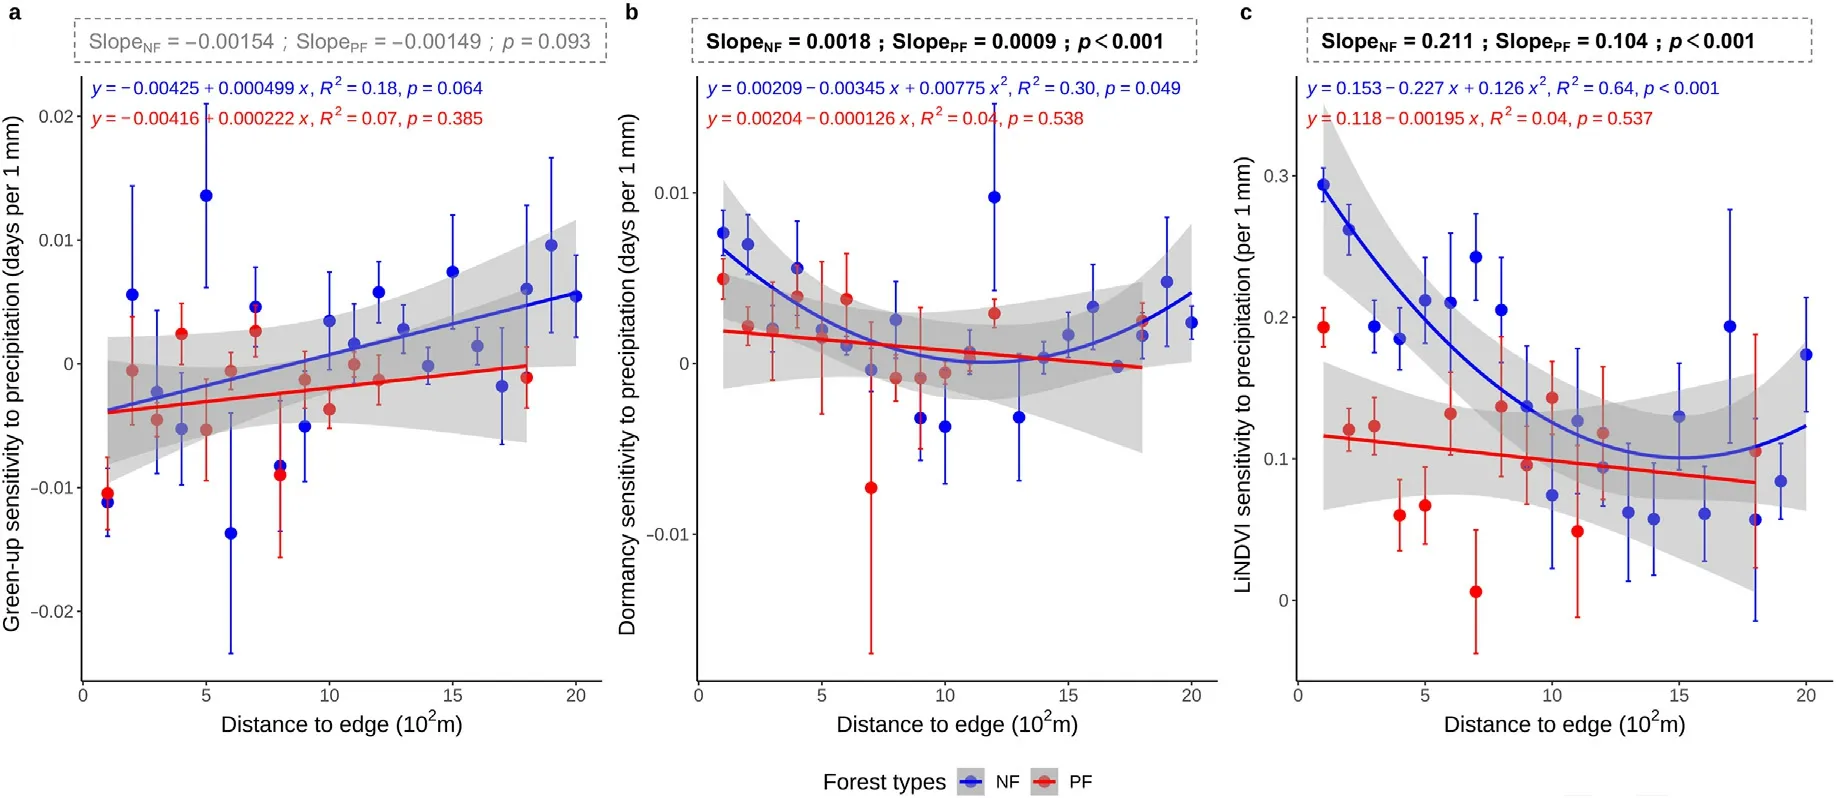
Fig.5.Sensitivities of average green-up date to precipitation (a), average dormancy date to precipitation (b), and average annual large integrate NDVI (LiNDVI) to precipitation(c)along the distance to edge.Red and blue circles indicate the average values within each proximity interval of planted and natural forests; error bars indicate one standard deviation from the mean;the boxes above the figure indicate the significant test results between NF and PF using all samples.The slope values indicate the median of the sensitivity;p indicates the significance level of difference between NF and PF calculated by the Wilcoxon two-sided test;test results with p<0.05 were bolded,and non-significant result was showed in grey.(For interpretation of the references to color in this figure legend,the reader is referred to the Web version of this article.)
The sensitivity of the dormancy date to precipitation showed “Ushaped” trends in NF (Fig.5b).The sensitivity of the average annual LiNDVI to precipitation showed a shift from decreasing to increasing trend from edge to the inner forest in NF(Fig.5c,R2=0.64,p <0.001),while no significant trend was found in PF despite the sensitivity was commonly positive,ranging from 0 to 0.2 mm-1(Fig.5c).
4.Discussion
4.1.Phenological changes with proximity to forest edge
Earlier green-up dates were found close to the forest edge in NF,but the dormancy dates were later with higher proximity to the edge(Fig.3d and e).The annual LiNDVI,determined by the accumulated NDVI during the growing season,did not show significant change trend from the edge to inner-forest sites(Fig.3f).The earlier green-up and later dormancy at the forest edge sites contribute to extend the growing season by approximately 30 d, compared to the inner forest, which generally are expected to result in higher productivity (Morreale et al., 2021).However, our results revealed that the productivity, as indicated by LiNDVI,did not change significantly along the gradient of proximity to edge.This might be because forest productivity is determined by many processes related to plant phenology and physiological activities(Xia et al.,2015).For arid and semi-arid regions,earlier leaf flushing could even suppress ecosystem productivity by draining soil water(Yu et al.,2018).A former study revealed that plant productivity can be well explained by phenological and physiological properties, specifically the growing season length and the seasonal maximum photosynthesis(Xia et al.,2015).Our findings also suggest that the productivity of NF along the gradient of proximity to edge is not solely determined by the length of the growing season.Instead, longer growing seasons at the forest edge imply lower photosynthesis activities.
Moreover,leaf longevity differed between tree species,which might affect the phenological patterns along the gradients of proximity to edge.Therefore, we examined the phenology by dividing samples into evergreen and deciduous types(Figs.S1-S4).Results showed that the trends for green-up and dormancy dates are generally consistent in both evergreen and deciduous forests(Fig.S2a and b).However,significant trends were only found in green-up of NF and PF and dormancy of NF in deciduous forests, while the trends were not significant for evergreen forests(Fig.S2a and b).Besides,the trends of LiNDVI were not significant in both evergreen and deciduous forests (Fig.S2c).In general, our results suggest that deciduous forest has more evident phenological trends along the proximity-to-edge gradients when comparing to evergreen forest.
Although the drivers of these phenological differences in NF are still unknown, this study highlights that the ecosystem structure/services,including the trophic levels(Kim et al.,2021),pollination period(Kudo and Cooper, 2019; Zaninotto et al., 2020), energy flow and biogeochemical cycles (Chen et al., 2021), might have been shaped by the distance to edge.This is because the response of the phenological events of individual species to climate change is connected through interaction with other species at the same or adjacent trophic level(Kim et al.,2021;Ochoa-Hueso et al.,2021).For instance,observations revealed that plant bloomed earlier, but the spring activities of herbivores and carnivores delayed in Korea (Kim et al., 2021).Phenological mismatch across trophic levels might alter ecosystem services.For example, plant seed production may be restricted due to reduced pollination due to desynchronized flowering and pollinator emergence introduced by climate change(Kudo and Cooper,2019).
4.2.Phenological sensitivity to temperature and precipitation
Consistent with previous studies(Park et al.,2020;Hong et al.,2022),higher air temperature introduced earlier green-up, as indicated by the negative values identified in both NF and PF(Fig.4a).Our study further revealed that the green-up of PF was more sensitive to temperature than NF, implying NF might be more stable under changing climate.In comparison, the dormancy dates were affected by complex interactions among environmental conditions,including the growing season heat and moisture condition, tree physiology etc.(Xia et al., 2015; Hong et al.,2022).For example, a former study reported that cold, frost, wet, and high heat-stress could lead to earlier dormancy dates in forests, while moderate heat- and drought-stress delayed dormancy (Xie et al., 2015).Our study also revealed that the sensitivity of dormancy dates to air temperature and precipitation varied along the gradient of proximity to edge,but no clear linear change pattern was detected along the gradient,except for the U shape changes in the sensitivity of dormancy dates to precipitation (Fig.5b).Furthermore, variations of tree species, topographic features, stand age, and successional stages further increase the complexity of the relationships between dormancy and climate factors.We found that the climate sensitivity differed between evergreen and deciduous tree species.The green-up sensitivity to air temperature increased with decreasing proximity to edge in evergreen forests of NF,while it showed the opposite trend in PF (Fig.S3a).In comparison, no significant trend of green-up sensitivity was detected in deciduous forests(Fig.S3a).Besides, LiNDVI sensitivity to precipitation was generally lower in deciduous forests than in evergreen forests in NF, and the sensitivity significantly decreased with increasing proximity to the edge(Fig.S4c).However, no significant trend of phenological events was observed along the proximity-to-edge gradient in PF(Fig.S4).Thus,our results confirmed that deciduous and evergreen forests were different in their phenological sensitivity to climatic factors along the proximity to edge.
Interestingly, the impacts of precipitation on green-up dates shifted from postponing to advancing along the distance from inner to the edge of forests in NF(Fig.5a).This indicates that higher precipitation tends to advance the green-up of edge forests but will delay the green-up of inner forests in NF.This could be attributed to the fact that higher precipitation is often associated with more cloudy days and lower air temperatures.In the case of inner forests, in which tree covers are denser (de Casenave et al., 1995), there is higher competition for light and heat, resulting in delayed green-up under higher precipitation condition.In comparison,edge forests in NF are located in more open areas and are more vulnerable to water loss due to increased wind and heat stress.These can also be seen from the significantly higher and positive sensitivity of LiNDVI to precipitation in NF as well as the significantly decreased sensitivity as progressing from edge to inner forest sites (i.e.decreasing proximity to edge)(Fig.5c).
In comparison for PF, the changes of phenological sensitivity to air temperature and precipitation were less evident in NF along the distance from edge.Nonetheless, both warming and increased precipitation advance green-up(Figs.4a and 5a).A distinction between NF and PF is that green-up sensitivities to precipitation in PFs are predominantly negative along the distance to the edge (Fig.5a).This suggests that precipitation tends to advance green-up in PFs regardless of the proximity to the edge,indicating that water availability is generally a limiting factor in the early growing season for PFs.Such a pattern is consistent with former studies suggesting that increasing PFs were distributed in dry areas during the implementation of forestation projects in China in the past few decades (Yu et al., 2018).Moreover, forest edges are typically colonized by light-demanding or early successional tree species, which might respond differently to changing climate compared to shade-tolerant species typically found in the inner regions of the forest.Despite light-demanding and shade-tolerant species were not examined in this study due to limited samples, we advocate that the impact of species light demands on phenological patterns should be further assessed.To sum up,we suspect that the phenological differences of NF and PF, as well as the sensitivity changes along the proximity to edge,might originate from their structural differences (Esseen et al., 2016;Blanchard et al.,2023; Vinod et al.,2023).
4.3.Implications for forest management
Our study revealed that the phenological sensitivity to heat and moisture was different along the proximity gradient from inner to edge area in China's forests.Generally,the green-up sensitivity increased from inner to edge areas in NF, while a decreasing trend was found in PF(Fig.4a).Thus, NFs green-up was more sensitive to temperature in the edge area,whereas PF exhibits the opposite pattern.
The different phenological patterns and sensitivities to climate are essential for accurate modelling of biogeochemical cycles in forests.For example,earlier green-up and later dormancy dates in the edge forests of the NF will introduce earlier and longer consumption of water resources,leading to a higher vulnerability to droughts.Given the increasing frequency of flash droughts(Yuan et al.,2023),the edge region of the NFs might be more vulnerable to carbon loss and reduced carbon uptake capability.Considering nearly 20% of the global forest area is now located within 100 m of forest edge(Haddad et al.,2015),these areas are more accessible to humans (e.g.food, tourism) and, therefore, become one of the areas that are most frequently disturbed by anthropogenic activities (Matlack, 1993).Forest edges were also preferred by recreationists both as physical park settings and as a visual component during sightseeing experiences (Ruddell and Hammitt, 1987).Former studies reported that changes in phenological events, such as delayed leaf coloration and muted autumn foliage color, due to climate change can significantly impact the fall foliage ecotourism industry (Spencer and Holecek,2007;Ge et al.,2013;Xie et al.,2015).Although the dormancy date sensitivities to air temperature and precipitation were independent to the distance to edge in both NF and PF,we found that green-up dates varied along the distance gradient.Higher green-up sensitivities of the edge forests to spring warming in NF might suggest a need for adjusting forest tourism.
This study supports that close-to-nature forest management might increase the stability of PF under changing climate from a phenological perspective.Our results further indicate that inner forests are capable to maintain a higher stability to climate variability than the edge forests in NF(lower phenological sensitivity in the inner forests).As global forests continue to experience fragmentation, with a significant proportion located near non-forest edges (Haddad et al., 2015), it is crucial to implement strategies that reduce forest fragmentation and enhance stability under climate change.For example,forestation,regenerating,and nursing priorities can be given to the potential lands surrounding the aggregated forest patches to reduce edge effects.It should be noted that the forest map used in identifying the proximity to forest edge was at a 30-m resolution.However,the trails,which are generally lower than 30 m in width,are unable to be identified for the map.Thus,the distances to the forest edge indicate the proximities of surveyed forest plots to relatively large land cover types.Furthermore, human disturbances,including urbanization, fire, and deforestation, can alter forest phenology.We observed that the interior areas of the forest were less affected by moderate-to-high intensity of human disturbance as evidenced by the sample sizes (Fig.S1).For the forest group with least disturbance in NF, the three phenological events and the sensitivity patterns are generally consistent with the results derived from all samples pooled (Figs.S5-S7).In comparison, significant differences were found in sensitivity trends of the three indicators in PF under different disturbance intensities.In general, significant changes of phenological events and their sensitivities along the proximity-to-edge gradient were observed in the forests under moderate and severe disturbances in PF.However,it should also be noted that the results might be shaped by the limited sample sizes and should be interpreted with caution.Despite the uncertainties,our results suggest that the phenological patterns along the proximity-to-edge gradient were more evident in less disturbed natural forests, while higher human disturbances perplexed and altered the pattern.Therefore,we advocate that in situ monitoring studies along the proximity to forest edge are needed to further quantify the sensitivities of phenology to climate.
5.Conclusion
In this study, we examined the sensitivities of green-up dates,dormancy dates, and LiNDVI in planted and natural forests of China during the 2000-2022.Generally,earlier green-up dates,later dormancy dates,and higher LiNDVI were found in PF than in NF.Our study further revealed differences in the sensitivity of phenological events to air temperature and precipitation between planted and natural forests,as well as variations in sensitivities along the distances to the edge in both forest types.Results showed that green-up dates were more responsive to air temperature at the edge of NF,whereas no clear pattern was observed in PF.Furthermore, the sensitivity of green-up dates to precipitation was higher at the edge(advancing)and inner areas(postponing)in NF,while the LiNDVI was more sensitive to precipitation at the edge.In comparison, the sensitivity of phenological events to precipitation did not significantly differ along the gradients of distance from inner to edge in PF, despite the precipitation significantly advanced green-up date but delayed dormancy date in PF.Moreover,the phenological patterns along the proximity-to-edge gradient were more evident in deciduous forest and less disturbed natural forests, while the patterns were obscure in evergreen forest and forests affected by higher human disturbances.As increasing forest fragmentation is caused by global change,we advocate that the edge of forests should be further investigated to better improve biogeochemical cycle modelling.Moreover, management of the edge forest should be adjusted and improved to promote forest stability and sustainable tourism.
Ethics approval and consent to participate
Not applicable.
Funding
This work was supported by National Science Foundation of China(Nos.32001166,32371663) and the Forestry Peak Discipline Construction Project of Fujian Agriculture and Forestry University, China(No.72202200205).
Consent for publication
Not applicable.
Availability of data and materials
Parts of the datasets used and/or analyzed in this study are available from the corresponding author upon reasonable request.
CRediT authorship contribution statement
Weibin You:Writing - review & editing, Writing - original draft,Formal analysis,Conceptualization.Ziyi Xian:Visualization,Methodology, Formal analysis, Data curation.Guoyi Zhou:Resources, Investigation, Data curation.Evgenios Agathokleous:Writing - review &editing, Writing - original draft, Methodology.Zhen Yu:Writing - review& editing, Writing-original draft,Methodology, Funding acquisition,Conceptualization.
Declaration of competing interest
The authors declare that they have no known competing financial interests or personal relationships that could have appeared to influence the work reported in this paper.
Acknowledgements
We thank Jingyun Fang, Guirui Yu, Gengxu Wang, Keping Ma,Shenggong Li, Sheng Du, Shijie Han, Youxin Ma, Deqiang Zhang, Shizhong Liu, Guowei Chu,Qianmei Zhang,Yuelin Li, Wantong Wang, Junhua Yan,Juxiu Liu,and Xuli Tang for their efforts in collecting field data.
Appendix A.Supplementary dataSupplementary data to this article can be found online at https://doi.i.org/10.1016/j.fecs.2023.100144.
- Forest Ecosystems的其它文章
- Divergent responses of Picea crassifolia Kom.in different forest patches to climate change in the northeastern Tibetan Plateau
- Tree-based ecosystem services supply and multifunctionality of church forests and their agricultural matrix near Lake Tana, Ethiopia
- Influence of climate fluctuations on Pinus palustris growth and drought resilience
- Nutrient retranslocation strategies associated with dieback of Pinus species in a semiarid sandy region of Northeast China
- Book review “Continuous Cover Forestry - Theories, Concepts, and Implementation” by Arne Pommerening
- Impact of black cherry on pedunculate oak vitality in mixed forests:Balancing benefits and concerns

