An Integrated Design on Next Generation Subsea Production System Based on Multidisciplinary Design Optimization Method
-,-,,
(School of Naval Architectureand Ocean Engineering,Dalian University of Technology,Dalian 116024,China)
Abstract:The Next Generation Subsea Production System (NextGen SPS)is an innovative concept for petroleum development in ultra-deep water areas,mainly consisting of artificial seabed (AS),rigid risers, flexible jumpers and mooring lines.To improve the overall performance and design efficiency of NextGen SPS, an integrated design approach for the NextGen SPS based on multidisciplinary design optimization (MDO) method was investigated in this paper by combing the multidisciplinary feasible(MDF) architecture and particle swarm optimization (PSO) algorithm to establish the design framework.Two sub-disciplines of hydrodynamic analysis and global performance analysis were defined,and analysis method in each sub-discipline was introduced.Surrogate models of hydrodynamic analysis and global performance analysis were developed by using Latin hypercube sampling method and back propagation neural network (BPNN).Surrogate models were incorporated into the design framework, through which an integrated design for NextGen SPS at a depth of 3000 m was implemented.It is concluded that both the overall performance and the design efficiency of NextGen SPS are improved.
Key words:next generation subsea production system;integrated design;
0 Introduction
Offshore petroleum production has extended into ultra-deep water areas,and dry tree and subsea tree are applied for petroleum development in ultra-deep water.However, there are drawbacks in both dry tree and subsea tree developments[1-2].The drawbacks of dry tree development lie in fabrication cost of hull, development flexibility, riser/vessel interfaces and so on, while the subsea tree developments lack efficient drilling and completion capability.Tab.1 summarizes the limitations of subsea anddry tree developments.
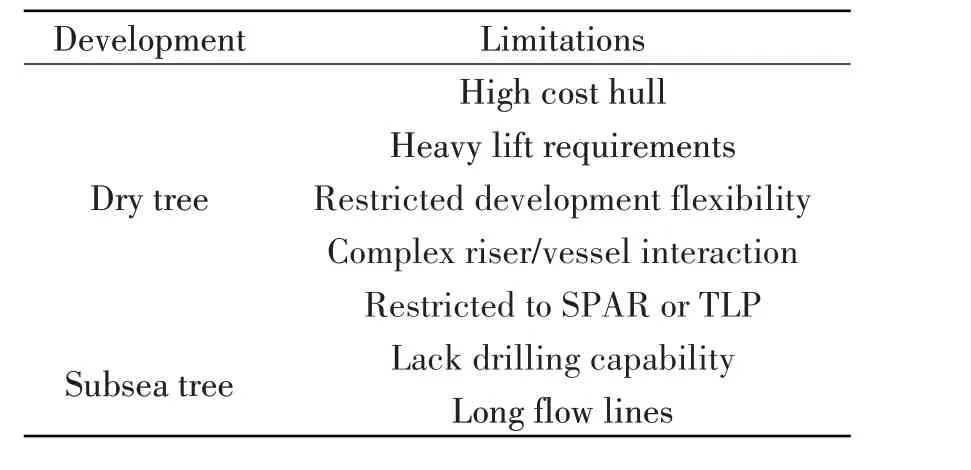
Tab.1 Limitations of subsea and dry tree developments
These drawbacks lead to the necessity in developing new petroleum production solutions.A case in point is the NextGen SPS concept[3-6],as shown in Figs.1-2:the moored AS is located below the mean water level to support rigid risers and lower-rated subsurface well completion equipment while the AS and FPU are linked by flexible jumpers.Removing the tremendous riser weight from FPU and adopting the lower-rated subsurface well completion equipment in ultra-deep water are the main features of NextGen SPS.
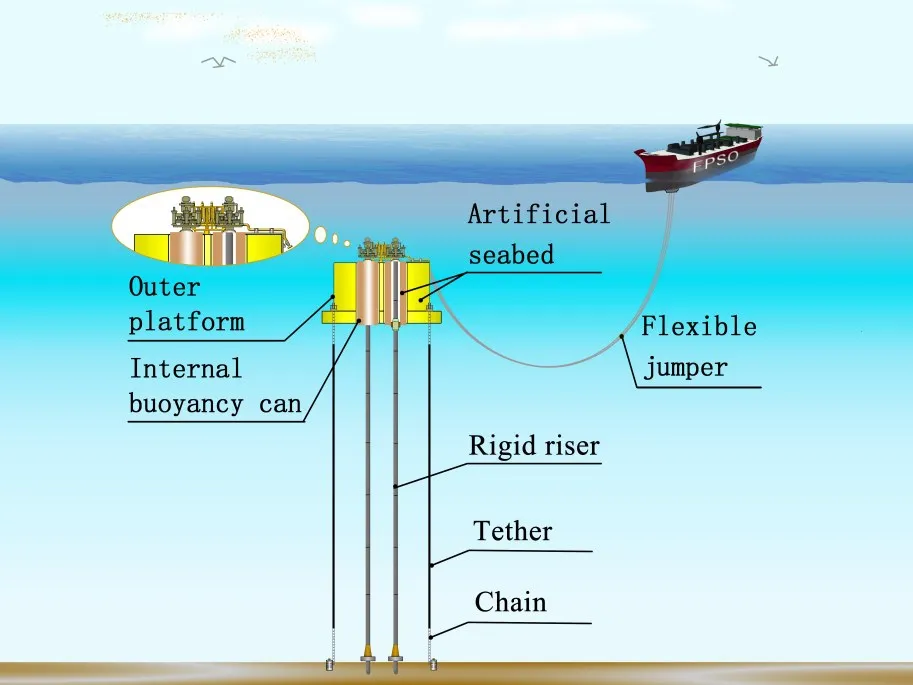
Fig.1 Sketch of the NextGen SPS
The definition of the NextGen SPS is dependent upon the parameters of four components: the AS,mooring lines,rigid risers and flexible jumpers,each of which has different functions,design requirements and codes[7-10].In traditional sequence design approach, these components are designed separately.However, the four components constitute an integrated system that jointly responds to the environmental loadings, and the interaction between the behaviors of them should not be ignored[5,11].The sequence design approach that treats each component individually with little consideration of the interdependence among the components,is less likely to obtain the global optimal solution of the whole system.Taking the interdependence into account would make the solution more reliable.Thus, the integrated design approach that treats the NextGen SPS as a whole and defines all the components simultaneously will be more appropriate.
However, the integrated design process of NextGen SPS is a complex multidisciplinary problem which concerns consideration of several disciplines,such as hydrodynamic,global performance analysis and weight estimation,and there is interaction between these disciplines.This makes it difficult and time-consuming to implement the integrated design[12-13].In recent years, MDO method has been increasingly applied in designing of complex systems[14].MDO method originated from the integrated design practice of aircrafts,and its application has been extended to other fields,such as ships[15], spar platforms[16]and underwater vehicles[17-20].In the above studies, the disciplines concerned are organized and coordinated through formulating MDO problem.Both the design quality and efficiency can be improved by solving the MDO problem.Thus, applying MDO method for the integrated design of NextGen SPS is a promising way to overcome the above mentioned drawbacks.
This paper presents an integrated design for NextGen SPS that treats all the components as a whole system, through transforming the integrated design process into an MDO problem.NextGen SPS at a depth of 3000 m was adopted as the research case.The optimization model was formulated firstly.MDF architecture and PSO algorithm were combined to establish the design framework.The hydrodynamic analysis sub-discipline and global performance analysis sub-discipline were defined.For each candidate configuration during the design process, the hydrodynamic characteristic of AS and global performance of NextGen SPS needed to be estimated.In general,these estimations were based on computational fluid dynamics (CFD) simulation and time domain analysis, which both were time-consuming.The whole design process involving numerous iterations would be very hard to conduct.To solve this problem,some surrogate models were developed to predict the hydrodynamic and global performance parameters during design process.The flowchart in Fig.3 depicts the design procedure.
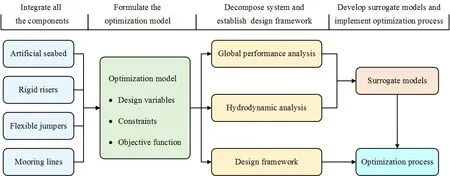
Fig.3 Flowchart of the design procedure
This paper is organized as follows:the general description and case data of the NextGen SPS as well as the definition of optimization problem are presented in Chapter 1; an MDF-PSO framework involving two sub-disciplines is established in Chapter 2; methods used in each sub-discipline are introduced in Chapter 3.In Chapter 4, the development of surrogate model and the implementation of MDF-PSO framework are presented.Finally,the conclusions are summarized in Chapter 5.
1 NextGen SPS concept and its optimization problem formulation
This chapter presents the NextGen SPS concept and the environmental conditions.According to the properties of NextGen SPS and relevant rules[7-10],the design variables,design constraints and objective function were identified.
1.1 General description
As mentioned above, NextGen SPS consists of the AS, subsurface well completion equipment,riser system and mooring lines.
The subsurface AS,consisting of an outer platform (OP)and four internal buoyancy cans(IBC),is located at a proper depth to diminish the loadings due to surface wave and current.The main hull of OP is characterized by a column with four channels.At the bottom of the main hull,the extended bilge box is designed to support the chain stopper where the mooring line is connected.The OP also provides the support for the manifold and flexible jumpers.The IBC is a slender column that is located inside the OP and has an equal height with the OP.It is the IBC that supports the subsurface Christmas tree and provides the required tension to keep the rigid riser in-place.The IBC and OP both are divided into multiple compartments to minimize the effect of damage in any one compartment.The contact between the OP and IBC is provided by a compliant guide[21],so that the horizontal motion of the OP is transferred to the IBC through the compliant guide, while the vertical motions of them are independent.This configuration will benefit the rigid riser which is susceptible to the vertical motion[22].
The riser system contains rigid risers and flexible jumpers.The rigid risers connect the subsea wellhead and the AS.The riser system is a single casing system that includes an external casing and an inner production tubing.The flexible jumpers extend from the OP to the FPU.They are in a slack catenary shape to decouple the OP from FPU motions.
The OP is moored by eight vertical mooring lines which are evenly divided into four groups.Each mooring line consists of three parts,the bottom and top parts are chain, while the middle part is tether.
The NextGen SPS concept has the following advantages:
(1)FPU selection is unrestricted and the design requirement of FPU can be reduced as the tremendous riser weight is removed from it;
(2)The flow near the seabed can be guaranteed;
(3)Rigid riser achieves better mechanical properties as it is decoupled from the FPU motions;
(4) The use of shallow-watered rated subsurface well completion equipment provides an improved commercial and technical performance in ultra-deep water.
Therefore, NextGen SPS can be regarded as a promising technology in ultra-deep water field development.
1.2 Environmental conditions
The case for this investigation is a NextGen SPS that operates at a depth of 3000 m.Tab.2 and Tab.3 list the environmental load conditions.The once-in-10-years monsoon and once-in-100-years typhoon are the operating and extreme environmental conditions respectively.
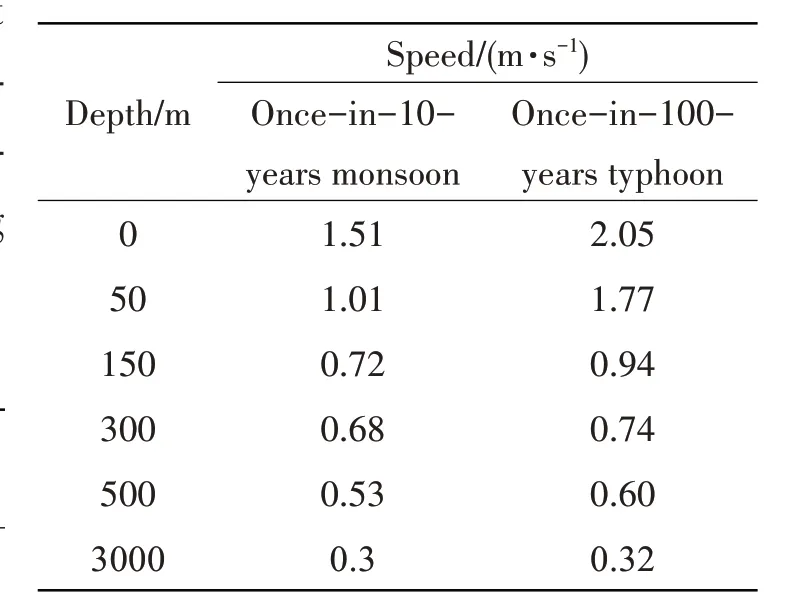
Tab.3 Current data

Tab.2 Wave and wind data
1.3 Design variables
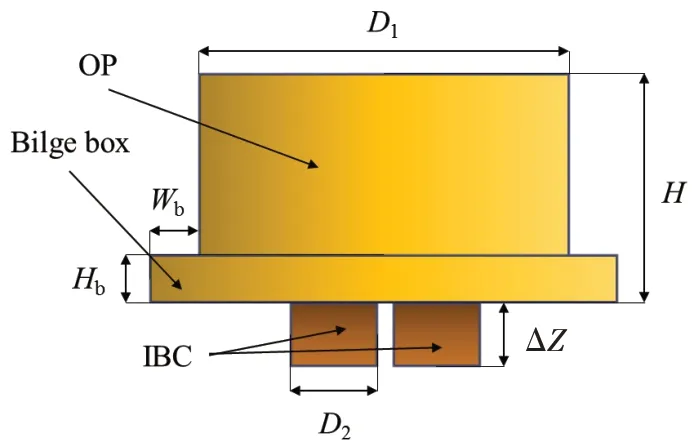
Fig.4 Geometric parameters of the AS
The design variables cover the parameters about the AS, mooring lines and rigid risers.Five geometric parameters of the AS are:height of the OP(H),diameter of the OP(D1),diameter of the IBC (D2),height(Hb)and width(Wb)of the bilge box, as shown in Fig.4.In addition, diving depth(s)of AS was considered.The ratio(a1)of bilge box height(Hb)to height(H)and the ratio(a2)of IBC diameter (D2) to OP diameter (D1) were adopted to reflect bilge box height (Hb) and IBC diameter(D2) respectively.Parameters concerning the rigid risers are outer diameter (Do) and wall thickness(To) of outer casing as well as top tension factor (FTT).As for the mooring lines, tether diameter (d)and pretension ratio (a3) are variables to be optimized.All the variables and their design space are listed in Tab.4.

Tab.4 Design variables and their boundaries
1.4 Design constraints
The hull sizing criteria of AS and design criteria of NextGen SPS were considered as design constraints.There are two fold in the hull sizing criteria of AS:(1)the AS has enough top area to accommodate the subsurface well completion equipment, and this requirement is satisfied by setting the lower boundaries of IBC diameter (D2)and OP diameter (D1);(2)one chamber redundancy is required, which means that even if one compartment buoyancy is lost, the AS still has adequate net buoyancy to support the subsurface well completion equipment and meet the top tension requirement for all service load conditions.
Tab.5 summarizes the design criteria of NextGen SPS.Difference of vertical position between OP and IBC (ΔZ)is limited to prevent the separation of OP and IBC.Effective tension of rigid riser is controlled to prevent overall column buckling.Rigid riser strength[23]and mooring line strength are compliant with American Petroleum Institute Recommended Practice 2SK and 2RD respectively.σyrepresents the yield strength of rigid riser material, it is 551 MPa in this study;Trepresents the minimum breaking load of tether,and it is related to the tether diameter (d).The operating radius curvature of the flexible jumper is restricted[24].

Tab.5 Design criteria of NextGen SPS
1.5 Objective function
The cost of NextGen SPS, covering the cost of AS, rigid risers, flexible jumpers and mooring lines,was taken as the objective function:
whereMriseris weight of the rigid riser;lfis the length of flexible jumper;MtetherandMASare the tether weight and AS weight respectively;C1,C2,C3andC4are cost weight associated to each part.In this study,the cost weights are set as 5400,26 400,12 000 and 4700 respectively,which reflect the unit price of each part.
The weight of the rigid riser and the tether can be calculated easily based on their geometry sizes(Do,To,d,s).A jumper length criterion[25]was adopted to define the flexible jumper length:
wheresfaris the horizontal span of flexible jumper when FPU is in a far situation,anddis the diving depth of the AS.
To obtain the AS weight, structural design for AS should be conducted according to the given AS geometric parameters (H,Wb,D1,a1,a2) firstly.The layout of bulkhead, stiffeners, girders and frames was assumed constant and pre-defined.As shown in Fig.5(a)-(b), the IBC is divided along the height into 10 equal compartments by 9 watertight bulkheads; the top plate, bottom plate and bulkheads are stiffened,while the stiffener spacing is specified as 45°angle.Fig.5(c)and 5(d)show the structure of the OP.The bilge box is stiffened by frames; there is a watertight bulkhead in the half height of the OP; horizontal girders, vertical stiffeners and girders are arranged in the vertical shell;the spacing between vertical stiffeners is specified as 3°angle.
The plate thickness, stiffener size and girder size were defined in accordance with the scantling requirements in Mobile Offshore Drilling Unit rule[10].After that, the AS weight (MAS) could be calculated based on the AS geometric parameters and structural design.
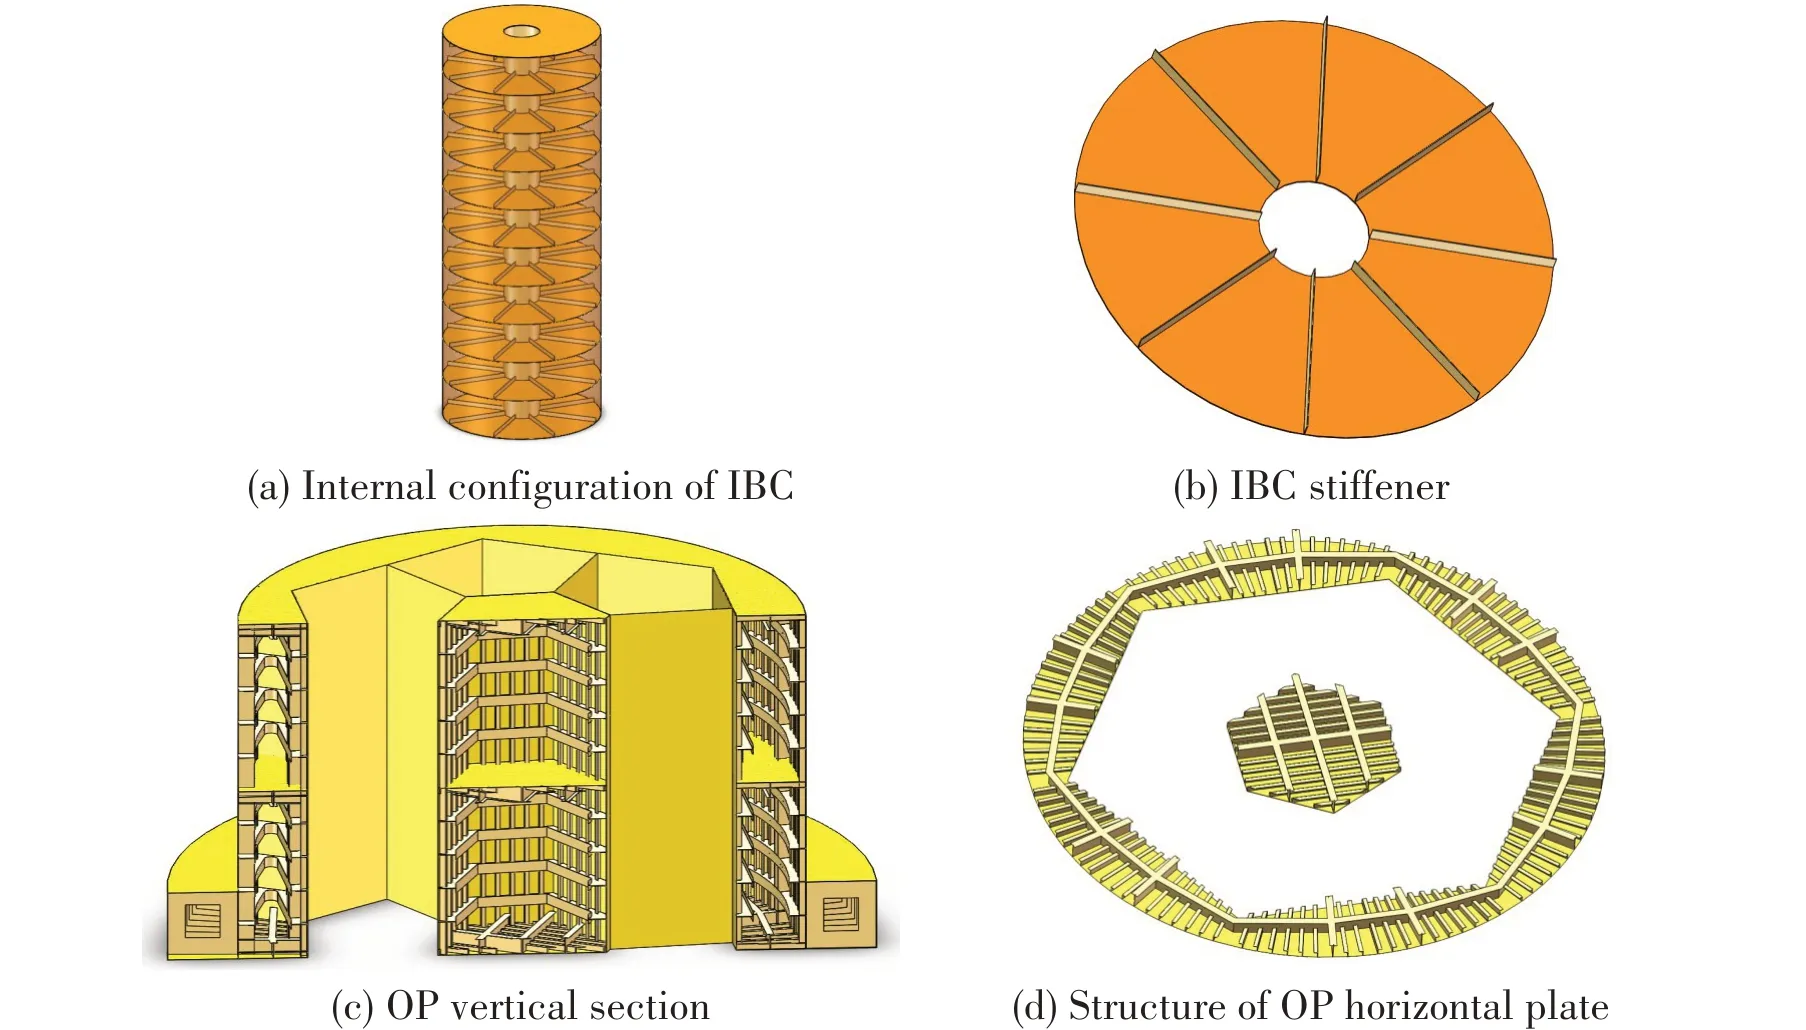
Fig.5 AS structure profile
2 Design framework
In this chapter, MDO architecture and optimization algorithm were selected based on the recognition of the design problem;then sub-disciplines concerning the design problem were identified and design framework was established according to the coupling relationship between these subdisciplines.
2.1 MDF architecture
The MDO architecture refers to the way to formulate problem and to organize the sub-disciplines in concert with the problem formulation.The adoption of an appropriate architecture is one of the most significant considerations in application of MDO[14].
MDF architecture is a traditional approach to deal with the MDO problem.There is a single optimization problem in MDF architecture, and the optimization problem is usually easy to be solved since only the original design variables, objective function and design constraints are under the direct control of the optimizer.Therefore,the MDF architecture is quite efficient and easy to be implemented[13-14,26].In this work,the MDF architecture was adopted.
The structure of the MDF architecture for an MDO problem with three sub-disciplines is shown in Fig.6: an optimizer in system level controls the objective functionf, constraintgand design variablesxandxi(i=1,2,3);xis the vector of variables shared by multiple sub-disciplines, while thexiis the vector of variables unique to a certain sub-discipline;yij(i,j=1, 2, 3) represents the vector of coupling variables between sub-disciplines;zi(i=1, 2, 3) is the vector of state parameters used to estimatefandg.
The MDF architecture applied follows a systematic procedure as outlined below:
(1)the optimizer assigns design variables into each sub-discipline;
(2)all the discipline analyses are performed until the coupling variables have converged;
(3)the state parameters are calculated and delivered into system level,then thefandgare estimated.
The above steps will be repeated,until obtaining the optimal solution.
2.2 PSO algorithm
In the application of MDO,the architecture plays a role in organizing the sub-discipline analyses in cooperation with the problem formulation,while the problem is solved by the optimization algorithm.There are gradient-based algorithm and global optimization algorithm.In general, the gradient-based algorithm can find an optimal solution with less computational cost than the global optimization algorithm.However, using the global optimization algorithm may lead to a better solution because the gradient-based optimizer usually converges to a local optimum.Moreover,it is difficult to solve the MDO problem of NextGen SPS by using the gradient-based algorithm, due to the fact that the gradients are hard to be calculated.Thus,the global optimization algorithm was adopted.
In this work, the MDO problem was solved by utilizing PSO algorithm.It is a kind of widelyapplied global optimization algorithm considered as an efficient way to solve the complex optimization problem[27].
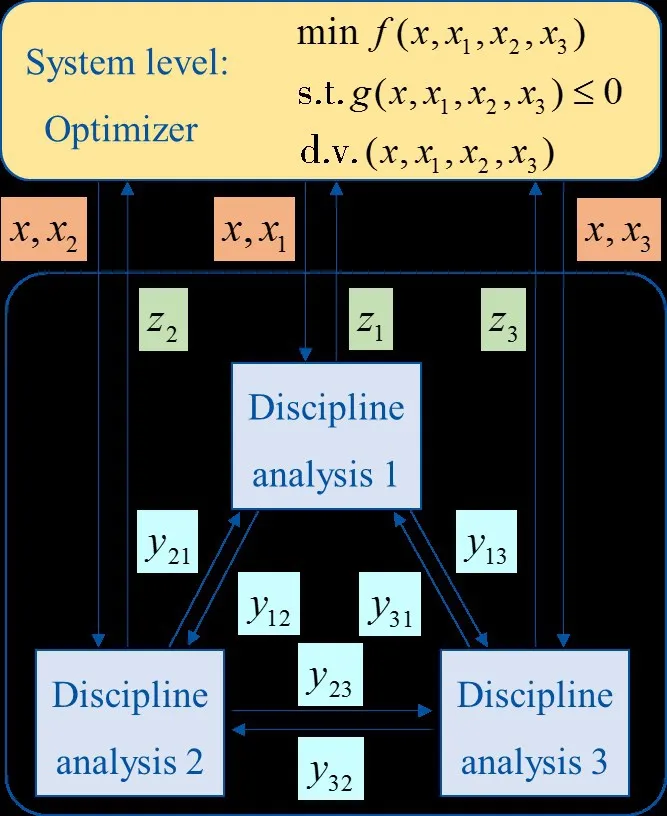
Fig.6 Diagram of MDF architecture
The PSO is inspired by the social behavior of bird flocking.In this algorithm, a group of particles search in steps throughout the design space.The particle positions represent the values of the design variables.Each particle has its unique velocity vector that determines the moving direction and distance.The fitness function of each particle is evaluated as it arrives at a new position.According to this evaluation,the velocity and position are updated as follows:
wherenis the total number of particles,dis the total number of design variables,tis the current step number,vi,jis the velocity vector of particle,xi,jis the particle position,pi,jrepresents the best position that the particle has been visited,known as individual best fitness value,pg,jrepresents the best position that the flock has been visited,known as global best fitness value,r1andr2are random numbers varying in the range [0, 1],C1andC2are positive constants named acceleration factors,andwis the inertia weight.The particles will keep moving until obtaining a result that satisfies the requirement.
2.3 Speed reducer problem
The speed reducer problem,which came from the NASA MDO test suite[28],was adopted to verify the validation of the MDF-PSO method.This problem is an optimization of a gearbox and the objective is the minimum weight under several constraints.The optimization model can be stated as:

According to the literature[29], the optimum is (3.5, 0.7, 17, 7.3 7.71, 3.35, 5.29) and the minimum objective value is 2994.Then the MDF-PSO method were employed to solve the optimization problem.Using the MDF architecture, the optimization model was treated as a single optimization problem.After 500 iterations, the obtained result is(3.5002, 0.7, 17, 7.3 7.7156, 3.3503, 5.2867) and the minimum objective value is 2994.49.The convergence history of objective value is depicted in Fig.7.The obtained result is very close to the optimum in the literature[29],which verifies the validation of the MDF-PSO method.

Fig.7 Convergence history
2.4 MDF-PSO framework for NextGen SPS
Fig.8 shows the integrated design framework, which incorporates the MDF architecture and PSO algorithm.Two sub-disciplines of hydrodynamic analysis and global performance analysis were defined.The system level includes a PSO optimizer, the design variables, constraints and objective function.The AS drag coefficient (Cd) and drag area (A)are calculated in sub-discipline 1 and used as the input parameter in Sub-discipline 2.After that, the global performance parameters (T1,T2,T3,σ1,σ2,k, ΔZ) are calculated in Sub-discipline 2.The parameter ΔZis taken as input parameter in Sub-discipline 1 in return, while the other parameters (T1,T2,T3,σ1,σ2,k) are delivered into system level and used to evaluate the design constraint.

Fig.8 Flowchart of MDF-PSO framework for NextGen SPS
3 Sub-disciplines
3.1 Hydrodynamic analysis for AS
The drag coefficient (Cd) of AS was calculated based on the CFD numerical simulation, which was performed through the commercial software STAR-CCM+.The AS geometry was built according to the given AS geometric parameters (H,Wb,D1,a1,a2).Some equivalent cuboids took the place of production equipment to reduce the modelling difficulty.The cuboid has the same drag area with the corresponding equipment.The shape of simulation domain is characterized by a box, and the length of the box is 7D1, the width is 10D1and the height is 10H,as shown in Fig.9.In this domain, the length behind AS (5D1) is longer than the length forward AS (2D1) so that the wake from AS body can be captured[26].The inlet velocity was set as current velocity while the outlet pressure was set as 0 Pa.
The simulation takes the Reynolds-Averaged Navier-Stokes(RANS)equation as turbulence modeling approach,with the realizable two-layerk-εmodel as turbulence model and the ally+as wall treatment.The fluid material was set as water-liquid and the flow type was set as segregated flow.The second-order upwind convection scheme was selected and the steady model was activated.The under-relaxation factors all kept the default values.
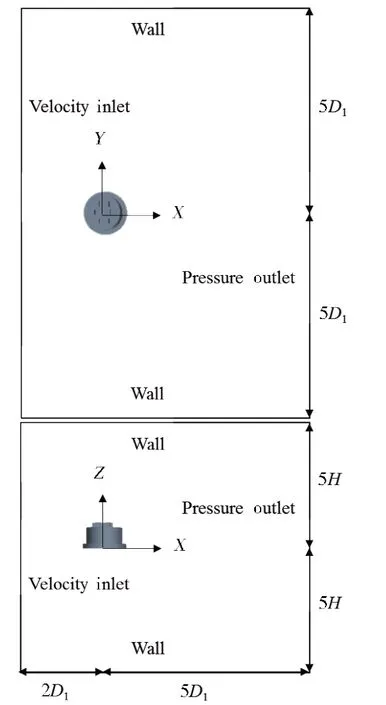
Fig.9 Simulation domain of AS
Trimmed mesher and prism layer mesher were employed to generate volume cells in the simulation domain.In the meshing process, the trimmed mesher generates volume mesh by cutting a hexahedral template mesh with the geometry surface, while the prism layer mesher adds prismatic cell layers next to AS boundaries.The first layer height was calculated by Eq.(6), wherey+was set as 40,Δyis the first layer height,Lis the AS diameter,andReis the Reynolds number.
There are five regions with different mesh sizes in the domain, and the ratio between the mesh sizes on adjacent regions is 2,as shown in Fig.10.In addition,grid independence analysis was conducted to ensure that the mesh size has little effect on the solution.Three cases with various mesh sizes were built for this analysis, and the cell number, minimum size and solution of each case are listed in Tab.6.There is a difference of 0.308% in drag coefficient values for the fine mesh and the coarse mesh, which demonstrates that the solution of CFD simulation is stable and credible, and the coarse mesh size was adopted here to save the computational cost.
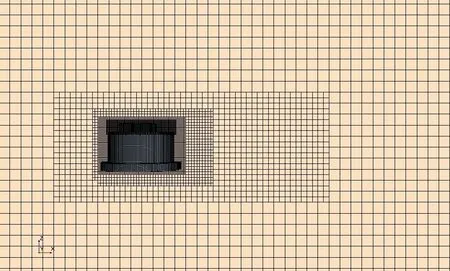
Fig.10 Generated meshes

Tab.6 Cell number,minimum size and solution of each case
3.2 Global performance analysis for NextGen SPS
Global performance parameters were obtained through the time domain analysis method,which was performed in the marine dynamics program ORCAFLEX.Fig.11 shows the fully coupled model of NextGen SPS.

Fig.11 Fully coupled NextGen SPS model in ORCAFLEX
The 6-degree of freedom buoy was employed to model the OP and IBC.The rigid risers, flexible jumpers and mooring lines (including tethers and chains) were modeled using line element.They were distinguished by different line-types.The line contact model was employed to simulate the interaction between the IBC and the rigid riser.By using the equivalent method[30],the outer casing and tubing were translated into an‘equivalent riser’that could reflect the actual rigid riser behavior.
4 Implementation
The integrated design based on the proposed MDF-PSO framework was implemented in this chapter.As mentioned in Section 2.2, the PSO algorithm is a kind of global optimization algorithm which needs numerous searches.Besides that, CFD simulation and time domain analysis both are time-consuming.The computational cost of the whole design process would be very huge and unaffordable.Consequently,some surrogate models were developed to surrogate the CFD simulation and time domain analysis in the design process.According to the input parameters,these surrogate models could rapidly predict the output responses with a sufficient accuracy.The contact between the two sub-disciplines is achieved through the surrogate models.
4.1 Development of surrogate model
4.1.1 Development method
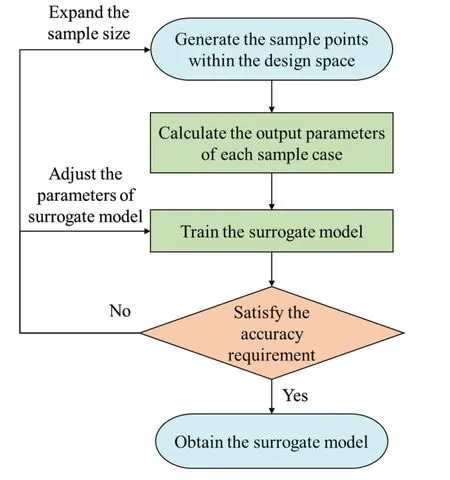
Fig.12 Development process of surrogate model
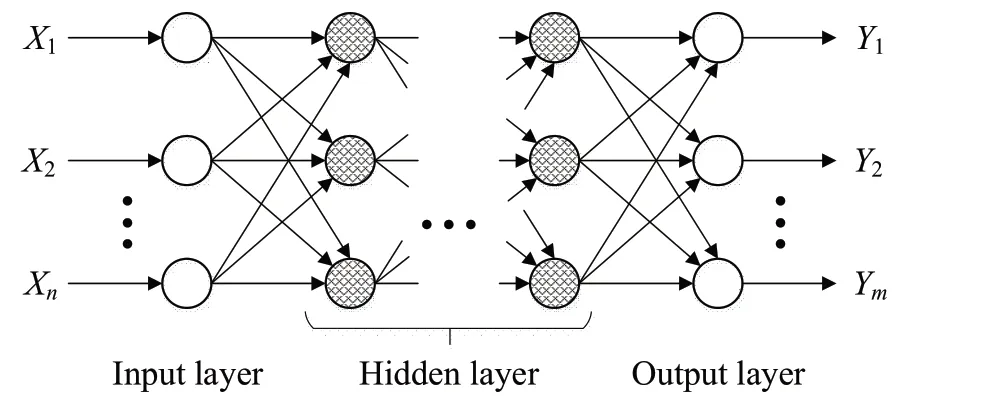
Fig.13 Topology of BPNN
Fig.12 depicts the development process of surrogate model: (1) generating the sample points within the design space; (2) building and running the sample cases, as well as exporting the output parameters; (3) training the surrogate model using a part of sample cases;(4)assessing the model accuracy using the rest of sample cases.Adjusting the parameters of surrogate model is the first choice when the model cannot meet the accuracy requirement,for example,the number of neurons and maximum iterative number of BPNN;if it does not work,the sample size has to be expanded.
In this work, Latin hypercube sampling method and BPNN were employed to generate sample points and develop surrogate model respectively.The operations concerning generating sample, training and testing BPNN model were performed in MATLAB.
The Latin hypercube sampling method belongs to the stratified sampling techniques.For anNpoint sample,it divides the range of each input variable intoNequal levels and ensures every level to contain a sample point.The sample points generated by Latin hypercube sampling is considered well representative[31].
The BPNN is a popular neural network that has been widely applied[32].Fig.13 illustrates the BPNN topology, in whichX1,X2,…,Xnrepresent the input parameters received by input layer andY1,Y2,…,Ymrepresent the output parameters produced by output layer; the layers between the input and output layers are hidden; the circles are neurons, and there are connections between the neurons in adjacent layers.The single hidden layer BPNN was adopted as it can approximate any continuous functions by adjusting the number of neurons.
4.1.2 Sample cases
Training sample and testing sample were generated separately within the design space.The training sample was used for training the BPNN model, while the testing sample was used to assess the accuracy of the trained BPNN model.For the hydrodynamic analysis sub-discipline, training sample and testing sample contain 400 cases and 40 cases respectively;as for the global performance analysis sub-discipline,training sample contains 500 cases and testing sample contains 50 cases.
The calculation of sample cases in the global performance analysis sub-discipline was executed on a single desktop computer with an Intel Core i7-7700 CPU clocking at 3.6 GHz.A MATLAB routine was scripted to model, simulate and export result automatically through the interface between the OFCAFLEX and the MATLAB.Some essential codes of the routine along with corresponding introductions are presented in Appendix A.
The calculation of sample cases in the hydrodynamic analysis sub-discipline was executed on the supercomputer of Dalian University of Technology which includes 229 blade nodes, each of which has two Intel Xeon E5-2600 v3 CPU clocking at 2.6 GHz.Similarly,Java macro file was applied to automate the hydrodynamic analysis.The automation approach is introduced in Appendix B.
4.1.3 Accuracy
To improve the performance of the BPNN model, the input and output parameters of training sample were normalized into [-1, 1].Correspondingly, the input parameters for the BPNN model should be normalized into [-1,1],and the output parameters forecasted by the BPNN model should be reversed to their actual values.
During the training process, the maximum iterative number was set as 2000 and the Bayesian regularization training algorithm was adopted.The training process finished within one minute.
After the training process,the accuracy of the BPNN model was assessed using the testing sample,by calculating the mean absolute percentage error(E),which was calculated as follow:
whereyiis the output parameter of testing sample,ŷiis the prediction value of surrogate model.The lowerEvalue signifies the higher accuracy of surrogate model.Generally, the surrogate model cannot be accepted ifE>0.1.
Tab.7 presents the adopted number of neurons and the accuracy of each BPNN model.All the models have enough accuracy as theEvalue of each model is less than 0.06.

Tab.7 Number of neurons and accuracy of each BPNN
4.2 Optimization result
The optimization process was implemented in MATLAB software.For the PSO algorithm, the adaptive inertia weight was confined in[0.5,1],c1andc2was set as 2,and 100 particles were taken.
With the employment of penalty function, the constrained optimization was converted into an unconstrained optimization.The fitness of the unconstrained optimization was constructed as follow:
wherefis the objective function,Ciis a penalty function related to the design constraintgi(x),gi(x)≤0 means this design constraint is satisfied,gi(x)>0 means the contrary,nis the number of design constraints.The fitness would reach a quite large value,unless all the design constraints can be satisfied.
The optimization process was executed on the above-mentioned single desktop computer.Within fifteen minutes,the optimization result converges at 74 iterations.It signifies that the implementation of the optimization process is quite efficient.Each surrogate model has been run at least 7400 (74×100) times, which is far greater than the number of sample cases.Therefore, employing the surrogate models reduces the computational cost.In addition, the application of surrogate models would simplify the potential repeated optimization process.
Tab.8 lists the initial parameters (obtained from the sequence approach)and optimized parameters.All the constraints were checked for the optimized case and they were all satisfied, validating the feasibility of the optimization result.This result achieves a reduction of 19.3% for the objective function (in detail, 30.9% reduction for rigid riser cost, 10.5% reduction for the flexible jumper cost,66.8%reduction for mooring line cost and 49.3%reduction for AS cost).The integrated design approach based on the MDF-PSO framework can find the result within three days (including the time spent in the development of surrogate models),as against several weeks using the sequence design approach[12].
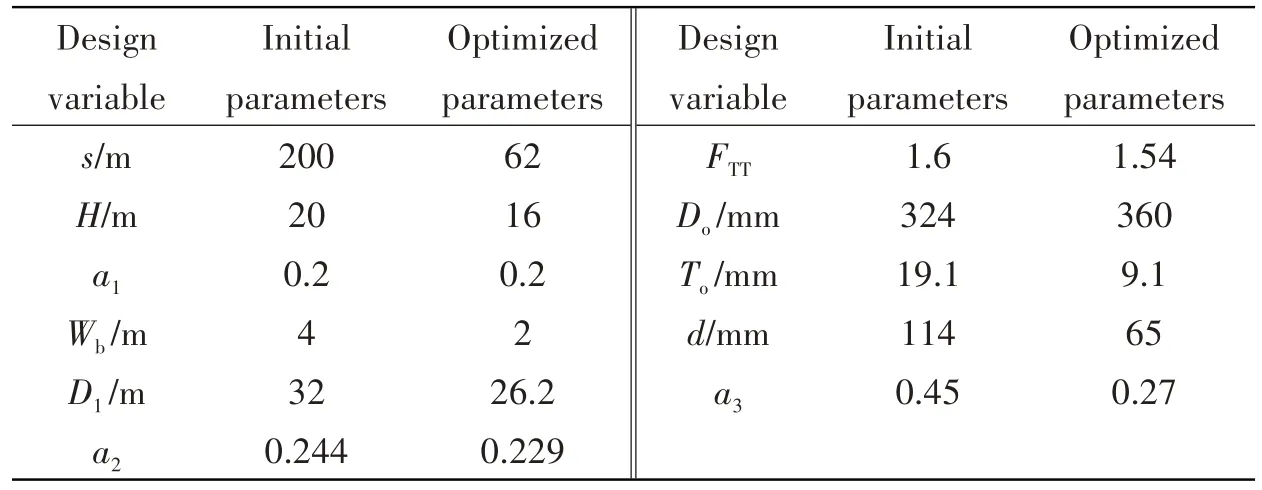
Tab.8 Initial parameters vs optimized ones
5 Summary and conclusions
This paper presents an integrated design for NextGen SPS that treats the AS, mooring lines,rigid risers and flexible jumpers as a whole system, through formulating the design process as an MDO problem.MDF architecture and PSO algorithm were employed to establish the design framework.Two sub-disciplines of hydrodynamic analysis and global performance analysis were defined.The CFD simulation method was adopted to calculate the drag coefficient (Cd)of AS,while the global performance parameters were calculated through using the time domain analysis method.The surrogate models, which were developed based on Latin hypercube sampling method and BPNN, replaced the CFD simulation and the time domain analysis in the optimization process.The following conclusions can be drawn:
(1)With the assistance of the surrogate model technique,the implementation of the MDF-PSO framework is quite efficient.
(2)The number of samples cases is far less than that of running surrogate models in the optimization process, demonstrating that the application of the surrogate models reduces the computational cost.
(3) Compared to the result of traditional sequence design approach, the obtained optimization result achieves a reduction of 19.3%for the objective function and the design cycle is shortened.
The study procedure in this paper would provide a reference for integrated design on the SPAR,TLP and the free standing hybrid risers.However,the design approach in this work is deterministic and the obtained result might become unfeasible when considering the uncertainties.Further study will focus on development of an uncertain approach.
Appendix A
A typical NextGen SPS model in ORCAFLEX was built as the base case.The base case and the routine should be located along the same path.addpath'E:Program Files(x86)OrcinaOrcaFlex10.0OrcFxAPIMATLAB'%Add the path of the MATLAB ORCAFLEX interface files
model=ofxModel; %Create an empty model
model.LoadData('BaseCase.dat'); %Loadthe base case data
OP=model('OP'); %Select the OP
OP.DragForceCoefficientX=x(1); %Set the drag coefficient
Type1=model('Complete Riser'); %Select the line type of the rigid riser
Type1.OD=x(2); %Set the outer diameter
Type2=model('Tether'); %Select the line type of the tether
Type2.MassPerUnitLength=x(3); %Set the mass per unit
model.RunSimulation; %Run the dynamic simulation on the modified case
A=Riser01.RangeGraph('Max von Mises Stress'); %Extract the stress along the rigid riser
B=OP.TimeHistory('Z'); %Extract the vertical position of the OP
C=Jumper01.RangeGraph('Curvature'); %Extract the curvature along the flexible jumper
D=Mooring01.RangeGraph('Effective Tension'); % Extract the effective tension along the mooring line
where“x(1),x(2),x(3)”are the predefined input parameters,“A,B,C,D”are matrices that are utilized to save results.
Appendix B
This automation is achieved by the STAR-CCM+macro,a Java program compiled and executed within the STAR-CCM+ workspace.The process to automating the repetitive task can be outlined as below:
(1) In the STAR-CCM+ workspace, perform a hydrodynamic analysis on AS and have all the actions recorded, including modeling, meshing, simulating and result exporting.Translate the actions into meaningful Java code and save in a Java macro file.
(2) According to the given AS geometric parameters, change the relevant parameters in the Java macro file.
(3)Run the modified Java macro file,execute the recorded actions to accomplish the repetitive task.
Thus, the hydrodynamic analysis could be automated by editing and running the Java macro file.
- 船舶力学的其它文章
- Overview of Some Important Factors for Wave Loads and Springing
- Analytical Approximations for Stick-slip Vibration of the Marine Rubber Bearing-shaft System
- Shaping the Structural Frequency Responses with an Improved Partial Eigenstructure Assignment by Minimizing Modal Energy
- Expansion Characteristics of Liquid-filled Cell on Hydrodynamic Ram Effect Subject to the Impact of High-speed Projectile
- An Improved Prediction Method for Structural Response Analysis of Offshore Wind Turbines
- Analysis on Plastic Responses of Metal Foam Sandwich Beams under Low Velocity Repeated Impacts

