
Global,regional,and national burden of gallbladder and biliary diseases from 1990 to 2019
2023-12-10 02:24:12ZhongZhuanLiLinJingGuanRongOuyangZhiXinChenGuoQingOuyangHaiXingJiang
Zhong-Zhuan Li,Lin-Jing Guan,Rong Ouyang,Zhi-Xin Chen,Guo-Qing Ouyang,Hai-Xing Jiang
Abstract BACKGROUND Gallbladder and biliary diseases (GABDs) are a major public health issue.AIM To analysis the cause-specific incidence,prevalence,and years lived with disability (YLDs) and its temporal trends of GABDs at the global,regional,and national level.Data on GABD were available from the Global Burden of Disease study 2019.METHODS The estimated annual percentage change (EAPC) was used to quantify temporal trend in GABD age-standardized incidence rates (ASIRs),age-standardized prevalence rate (ASPR),and age-standardized YLD rate (ASYR) by region,sex.We analyzed the relationship between the GABD burden and country development level using the human development index (HDI).RESULTS In 2019,the incident cases of GABD were 52003772,with an ASIR of 63432/100000 population.Globally,the number of incident cases and ASIR of GABD increased 97% and 58.9% between 1990 and 2019.Although,the ASPR and ASYR decreased from 1990 to 2019,the number of prevalent and YLDs cases increased.The highest ASIR was observed in Italy,and the highest ASPR and ASYR was observed in United Kingdom.The highest burden of GABD was found in low-SDI region,and the burden in female was significantly higher than males.A generally negative correlation (ρ=-0.24,P < 0.05) of GABD with the EAPC and human development index (HDI)(in 2021) were observed for ASIR.What’s more,no correlation in ASPR (ρ=-0.06,P=0.39) and ASYR (ρ=-0.07,P=0.36) of GABD with the EAPC and HDI (in 2021) were observed,respectively.CONCLUSION GABD remain a major global public health challenge;however,the burden of GABD varies geographically.Globally,the number of incident cases and ASIR of GABD increased between 1990 and 2019.The results of our study provide insight into the global disease burden of GABD and may assist policymakers in formulating effective policies to mitigate modifiable risk factors.
Key Words: Gallbladder and biliary diseases,incidence,prevalence,years lived with disability;The Global Burden of Diseases study;Estimated annual percentage changes
INTRODUCTION
Gallbladder and biliary diseases (GABDs) are common digestive system disorders comprising cholelithiasis,cholecystitis,other diseases of gallbladder and other diseases of biliary tract,such as cholangitis and bile duct obstruction)[1-3].According to the National Health and Nutrition Examination Survey III,gallbladder disease affects more than 20 million adults in the United States,including 14.2 million women and 6.3 million men[4],with an estimated cost of $6.2 billion[5].In the general population,the overall prevalence of gallstones is estimated to be between 10% and 15%;however,there is some variation between countries[6].Biliary colic symptoms are present in up to 20% of gallstone patients[7].If left undiagnosed and untreated,gallstones have a yearly risk of 1%-2% of developing into more complicated diseases.Moreover,severe conditions can quickly progress to systemic inflammatory response syndrome,sepsis,and even death[8-10].
GABDs not only have long-term detrimental effects on quality of life and productivity,but also frequently require hospitalization and surgical interventions,resulting in substantial healthcare costs and a significant financial burden on society[11].According to the data set of the United States Medical Survey,the total cost of cholelithiasis and cholecystitis in the United States alone was over $2.2 billion in 2009,rising to $4 billion in 2014[12].Therefore,a proper understanding of epidemiologic data and identification of groups at high risk of GABD is important to make sound health policy decisions and for effective resource allocations.
A study based on the Global Burden of Diseases Study (GBD) 2019 data reported an increase in the prevalence,death,and disability-adjusted life years (DALYs) rates of GABD from 1990 to 2019.however,the age-standardized rates (ASRs)decreased over the 30-year period[13].In addition to presenting global prevalence,death,and DALY rates,this study did not include an analysis of the incidence and years lived with disability (YLD) rates.Furthermore,it did not provide information on the regional and national burden.Moreover,the study only assessed the correlations between ASR and the sociodemographic index (SDI)[13] and not between the number of events and the human development index (HDI)and baseline ASR.Therefore,a comprehensive analysis of the incidence,prevalence,and YLDs of GABD is needed to enable informed policy making and for further research to reduce its burden.
In this study,using data from the GBD 2019 study,we presented the incidence,prevalence,and YLDs of GABD and their temporal trends from 1990 to 2019 in 204 countries and territories at the global,regional,and national levels.The association between estimated annual percentage changes (EAPCs),age-standardized incidence rates (ASIRs),agestandardized prevalence rates (ASPRs),and age-standardized YLDs rates (ASYRs) (1990),and HDI (2021) were also assessed at the national level.
MATERIALS AND METHODS
Study data
The GBD 2019 study conducted by the Institute for Health Metrics and Evaluation provided a comprehensive epidemiological assessment of 369 diseases and injuries,286 causes of death,and 87 risk factors across regions,countries,gender,and etiology[14].The study reported burden levels and trends of major diseases,injuries,and risk factors by region,sex,country,and age in 204 countries and territories,7 super regions,and 21 regions from 1990 to 2019.In our study,we utilized data obtained from the Global Health Data Exchange query tool (http://ghdx.healthdata.org/gbd-results-tool),which included the number of incidences and ASIR,as well as their percentages,from 1990 to 2019 based on global,regional,and national cause.
GBD 2019 categorized 204 countries and territories into 5 regions according to SDI quintiles-low-,low-middle-,middle-,high-middle-,and high-SDI regions-and into 21 GBD geographic regions[14-19].The present study was conducted in accordance with the Guidelines for Accurate and Transparent Health Estimates Reporting statement[19].DisMod-MR 2.1 model,an epidemiological state transition disease modeling software,and MR-BRT,a Bayesian metaregression software,were used to produce consistent disease estimates[14,18].The 2019 HDI for 187 countries and territories was provided by the United Nations Development Program.The HDI is a combined measure of health,education,and income in a given country: a long and healthy life,a knowledgeable,and a decent standard of living[20].
The 10threvision of the International Classification of Diseases coded GABDs as K80,K81,K82,and K83[14,18].In the present study,the data were extracted from the GBD 2019 and were estimated from the literature,clinical administrative,Poland claims,hospital discharges,the United States MarketScan claims,and southern sub-Saharan Africa data[14,18].
Statistical analysis
To analyze GABD trends from 1990 to 2019,the EAPCs in ASR were calculated[21].EAPC is a comprehensive statistical and widely used measure for assessing the ASR trends within a specific interval[22].The ASR and EAPC calculations have been proposed in previous studies[23].In brief,we fit the natural logarithm of ASR to calendar years to calculate the EAPC,which describes the long-term trend of the GABD burden.If the EAPC value and its lower boundary of 95%confidence interval (CI) were both greater than 0,we considered the ASR of GABD to increase,and if the EAPC value and its upper boundary of 95%CI were lower than 0,we considered the ASR to decrease.In addition,if the 95%CI of EAPC contained 0,we considered ASR to be stable over time[23].In addition,we also analyzed the correlations between EAPC and ASR in 1990 and between EAPC and HDI in 2019 at the national level to explore the factors influencing EAPC.All statistics were analyzed using the R statistical software program (version 3.4.2;R Foundation for Statistical Computing,Vienna,Austria).P-values ≤ 0.05 were considered statistically significant.
Patient involvement
In this study,secondary data analysis was performed and no patients were recruited as study participants.Patients did not participate in the formulation of the research question,study design,or overall conduct of the study.The dissemination of study findings does not involve patient involvement.All data analyzed in this study were previously published or existing data sources.
RESULTS
Global and national levels
In 2019,the incident cases of GABD were 52003772 [95% uncertainty interval (UI): 44202143-61211622),with an ASIR of 634.32 per 100000 population (540.21-742.93) (Table 1).From 1990 to 2019,the global number of incident cases of GABD increased by 97% (90% to 105%),and the global ASIR increased by EAPC=0.59 (0.42-0.76).Globally,the number of prevalent cases due to GABD was 193493378 (166626338-229375433) in 2019,and the ASPR was 2350.78 per 100000 population (2029.59-2778.69).The global number of prevalent cases of GABD increased by 52% (45% to 59%),and the global ASPR decreased by EAPC=-0.60 (-0.68 to -0.52) from 1990 to 2019.In 2019,GABD accounted for 4061843 (2595493-5953096) YLDs,with an ASR of 49.33 per 100000 population (31.51-71.96).The number of LYDs increased by 51% (44%-58%),and the ASR decreased by EAPC=-0.59 (-1.16 to -0.03) from 1990 to 2019 (Table 1).
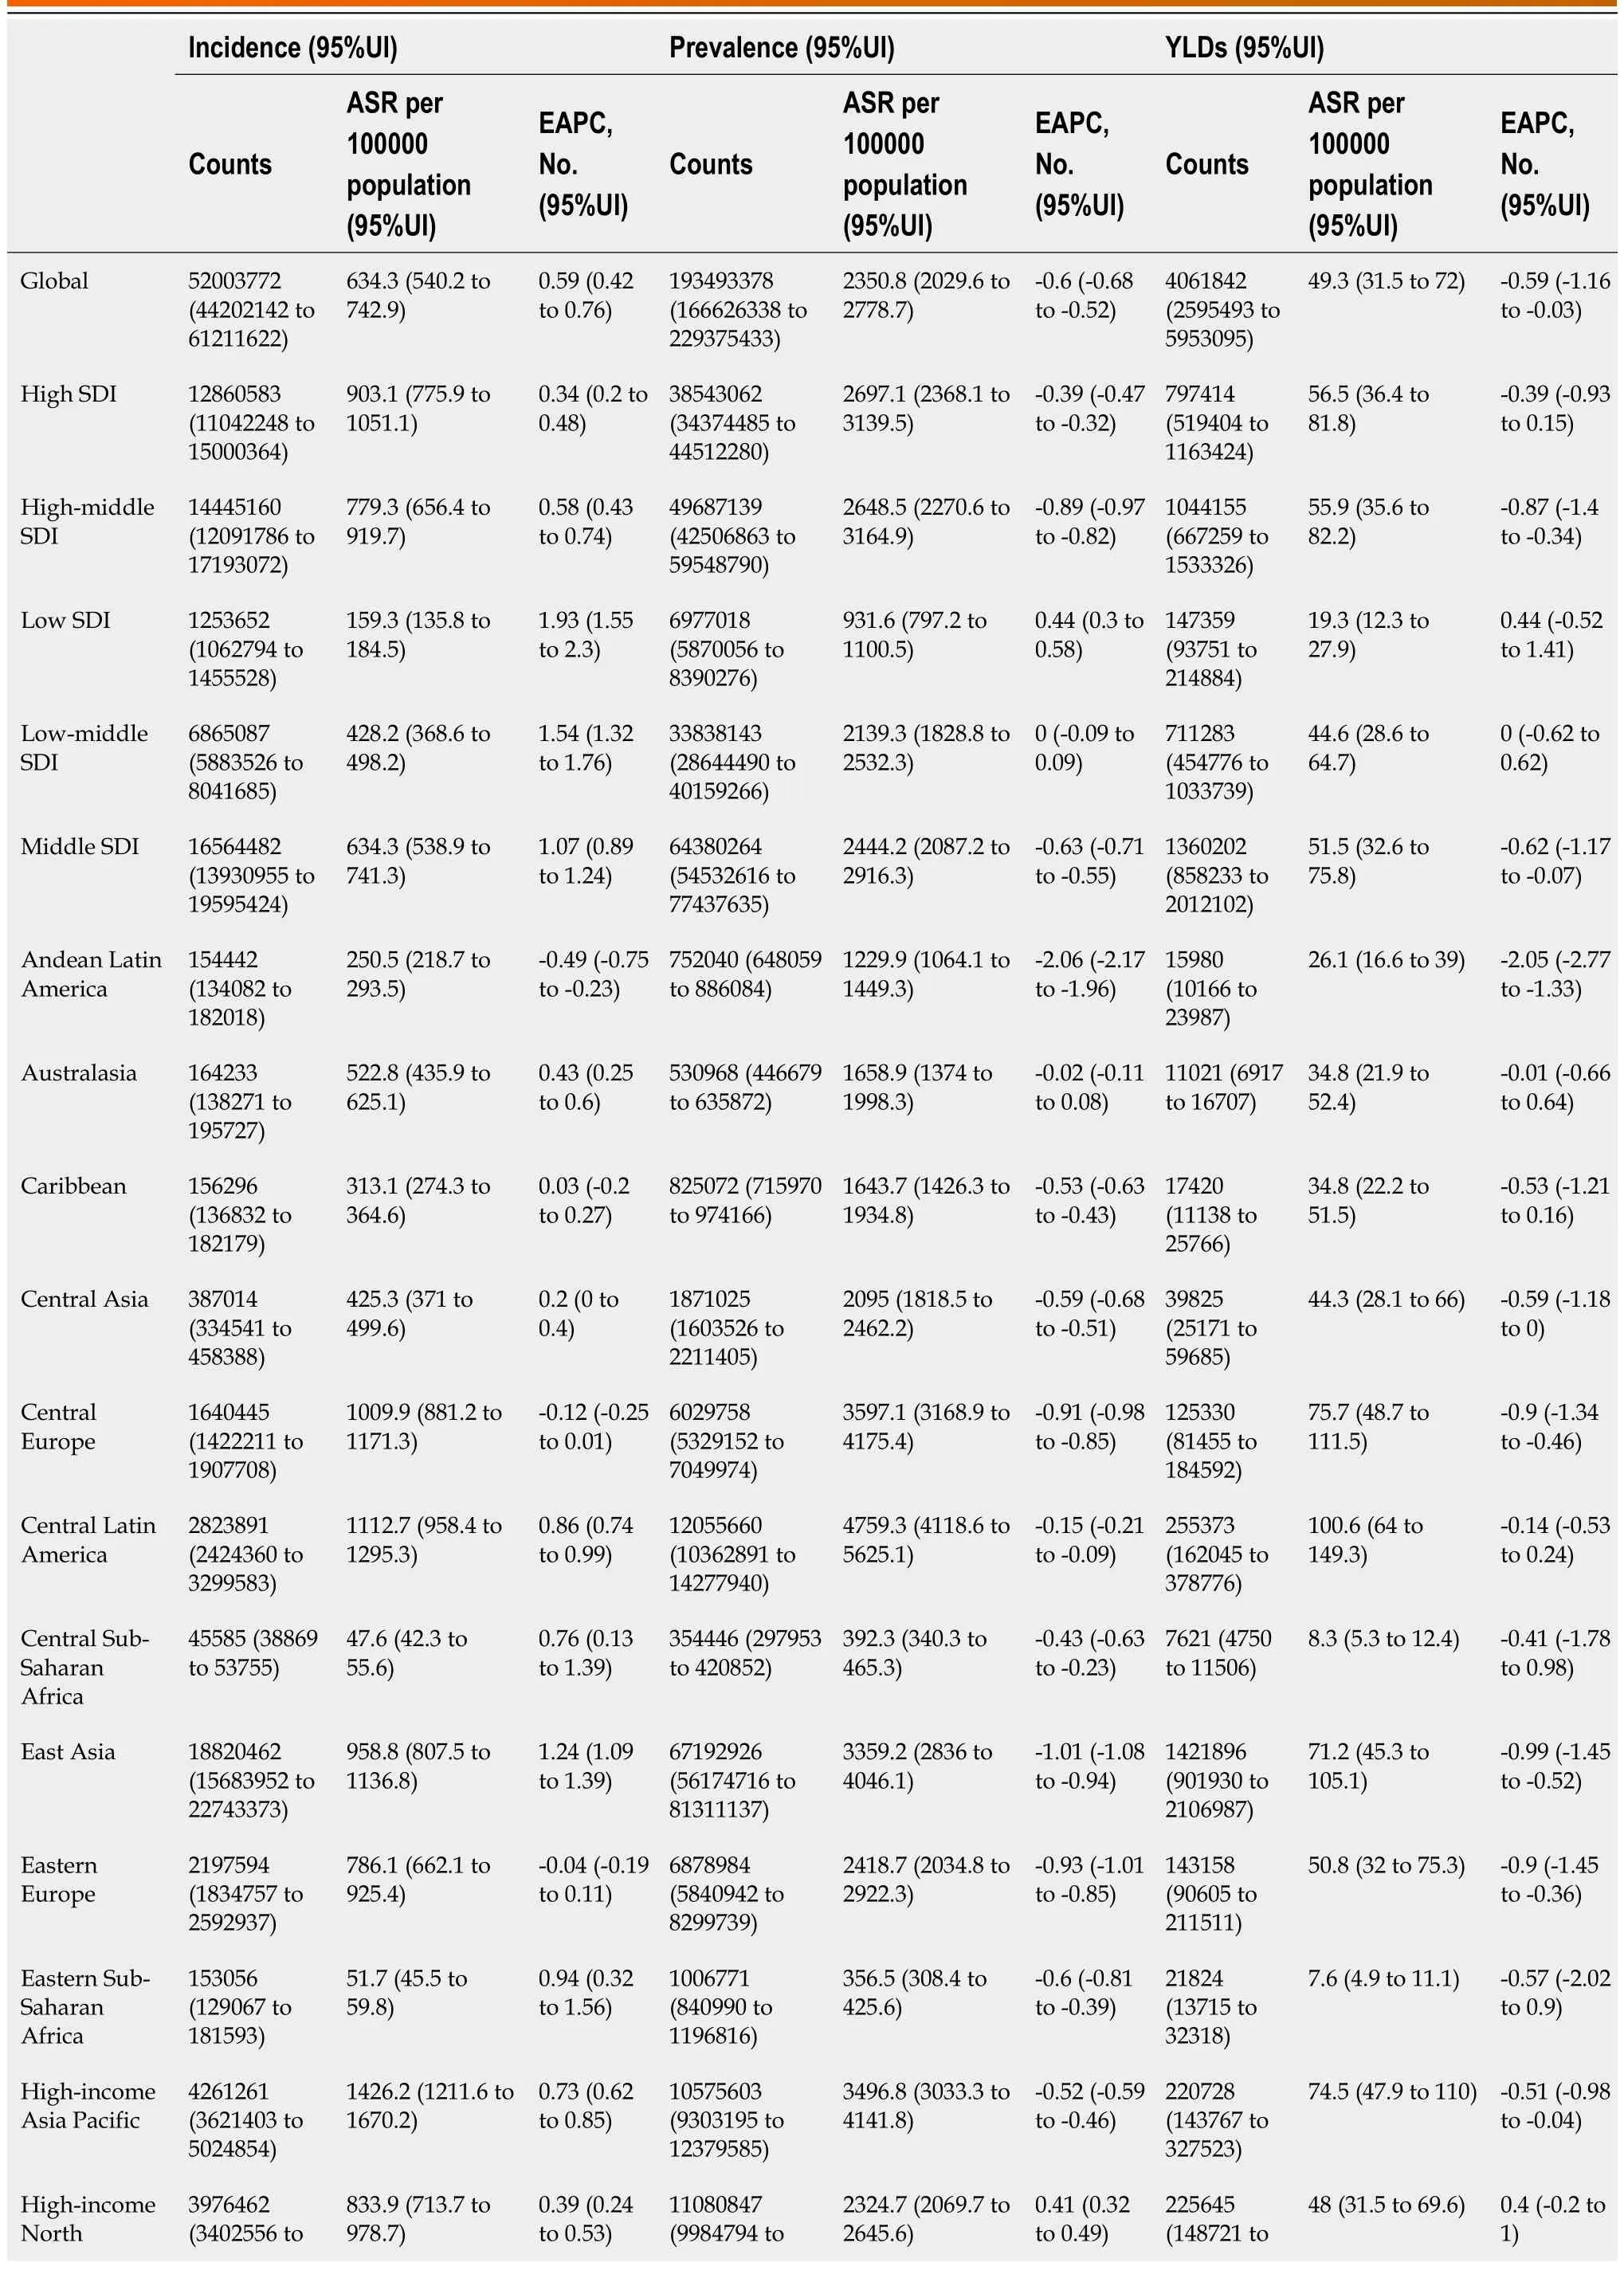
Table 1 Prevalent cases,incident cases,and years lived with disability for gallbladder and biliary diseases in 2019 for both sexes and estimated annual percentage change of age-standardized rates per 100000 populations from 1990 to 2019 by global burden of disease regions
In 2019,Italy [1718.36 per 100000 population (1441.49-2039.23] had the highest ASIR,followed by Japan [1614.18 per 100000 population (1366.14-1898.78)] and the United Kingdom [1593.45 per 100000 population (1339.08-1878.10),whereas Somalia (38.06 per 100000 population (33.42-43.73)],Guinea [38.40 per 100000 population (33.08-45.33)],and Guinea-Bissau [38.78 per 100000 population (33.57-44.46)] had the lowest ASIRs (Figure 1A,Supplementary Table 1).From 1990 to 2019,Qatar (775%,689% to 856%) and Latvia (-14%,-21% to -6%) had the most pronounced increased and decreased and decreased changes,respectively (Figure 1B).From 1990 to 2019,the largest ASIR increase was observed in India(EAPC=3.18,2.92-3.45) and Brazil (EAPC=1.68,1.55-1.82).During this period,a total of 32 countries or territories had a decrease in the GABD ASIR,with the largest ASIR decrease occurring in Argentina (EAPC=-1.43,-1.72 to -1.14)(Figure 1C,Supplementary Table 1).
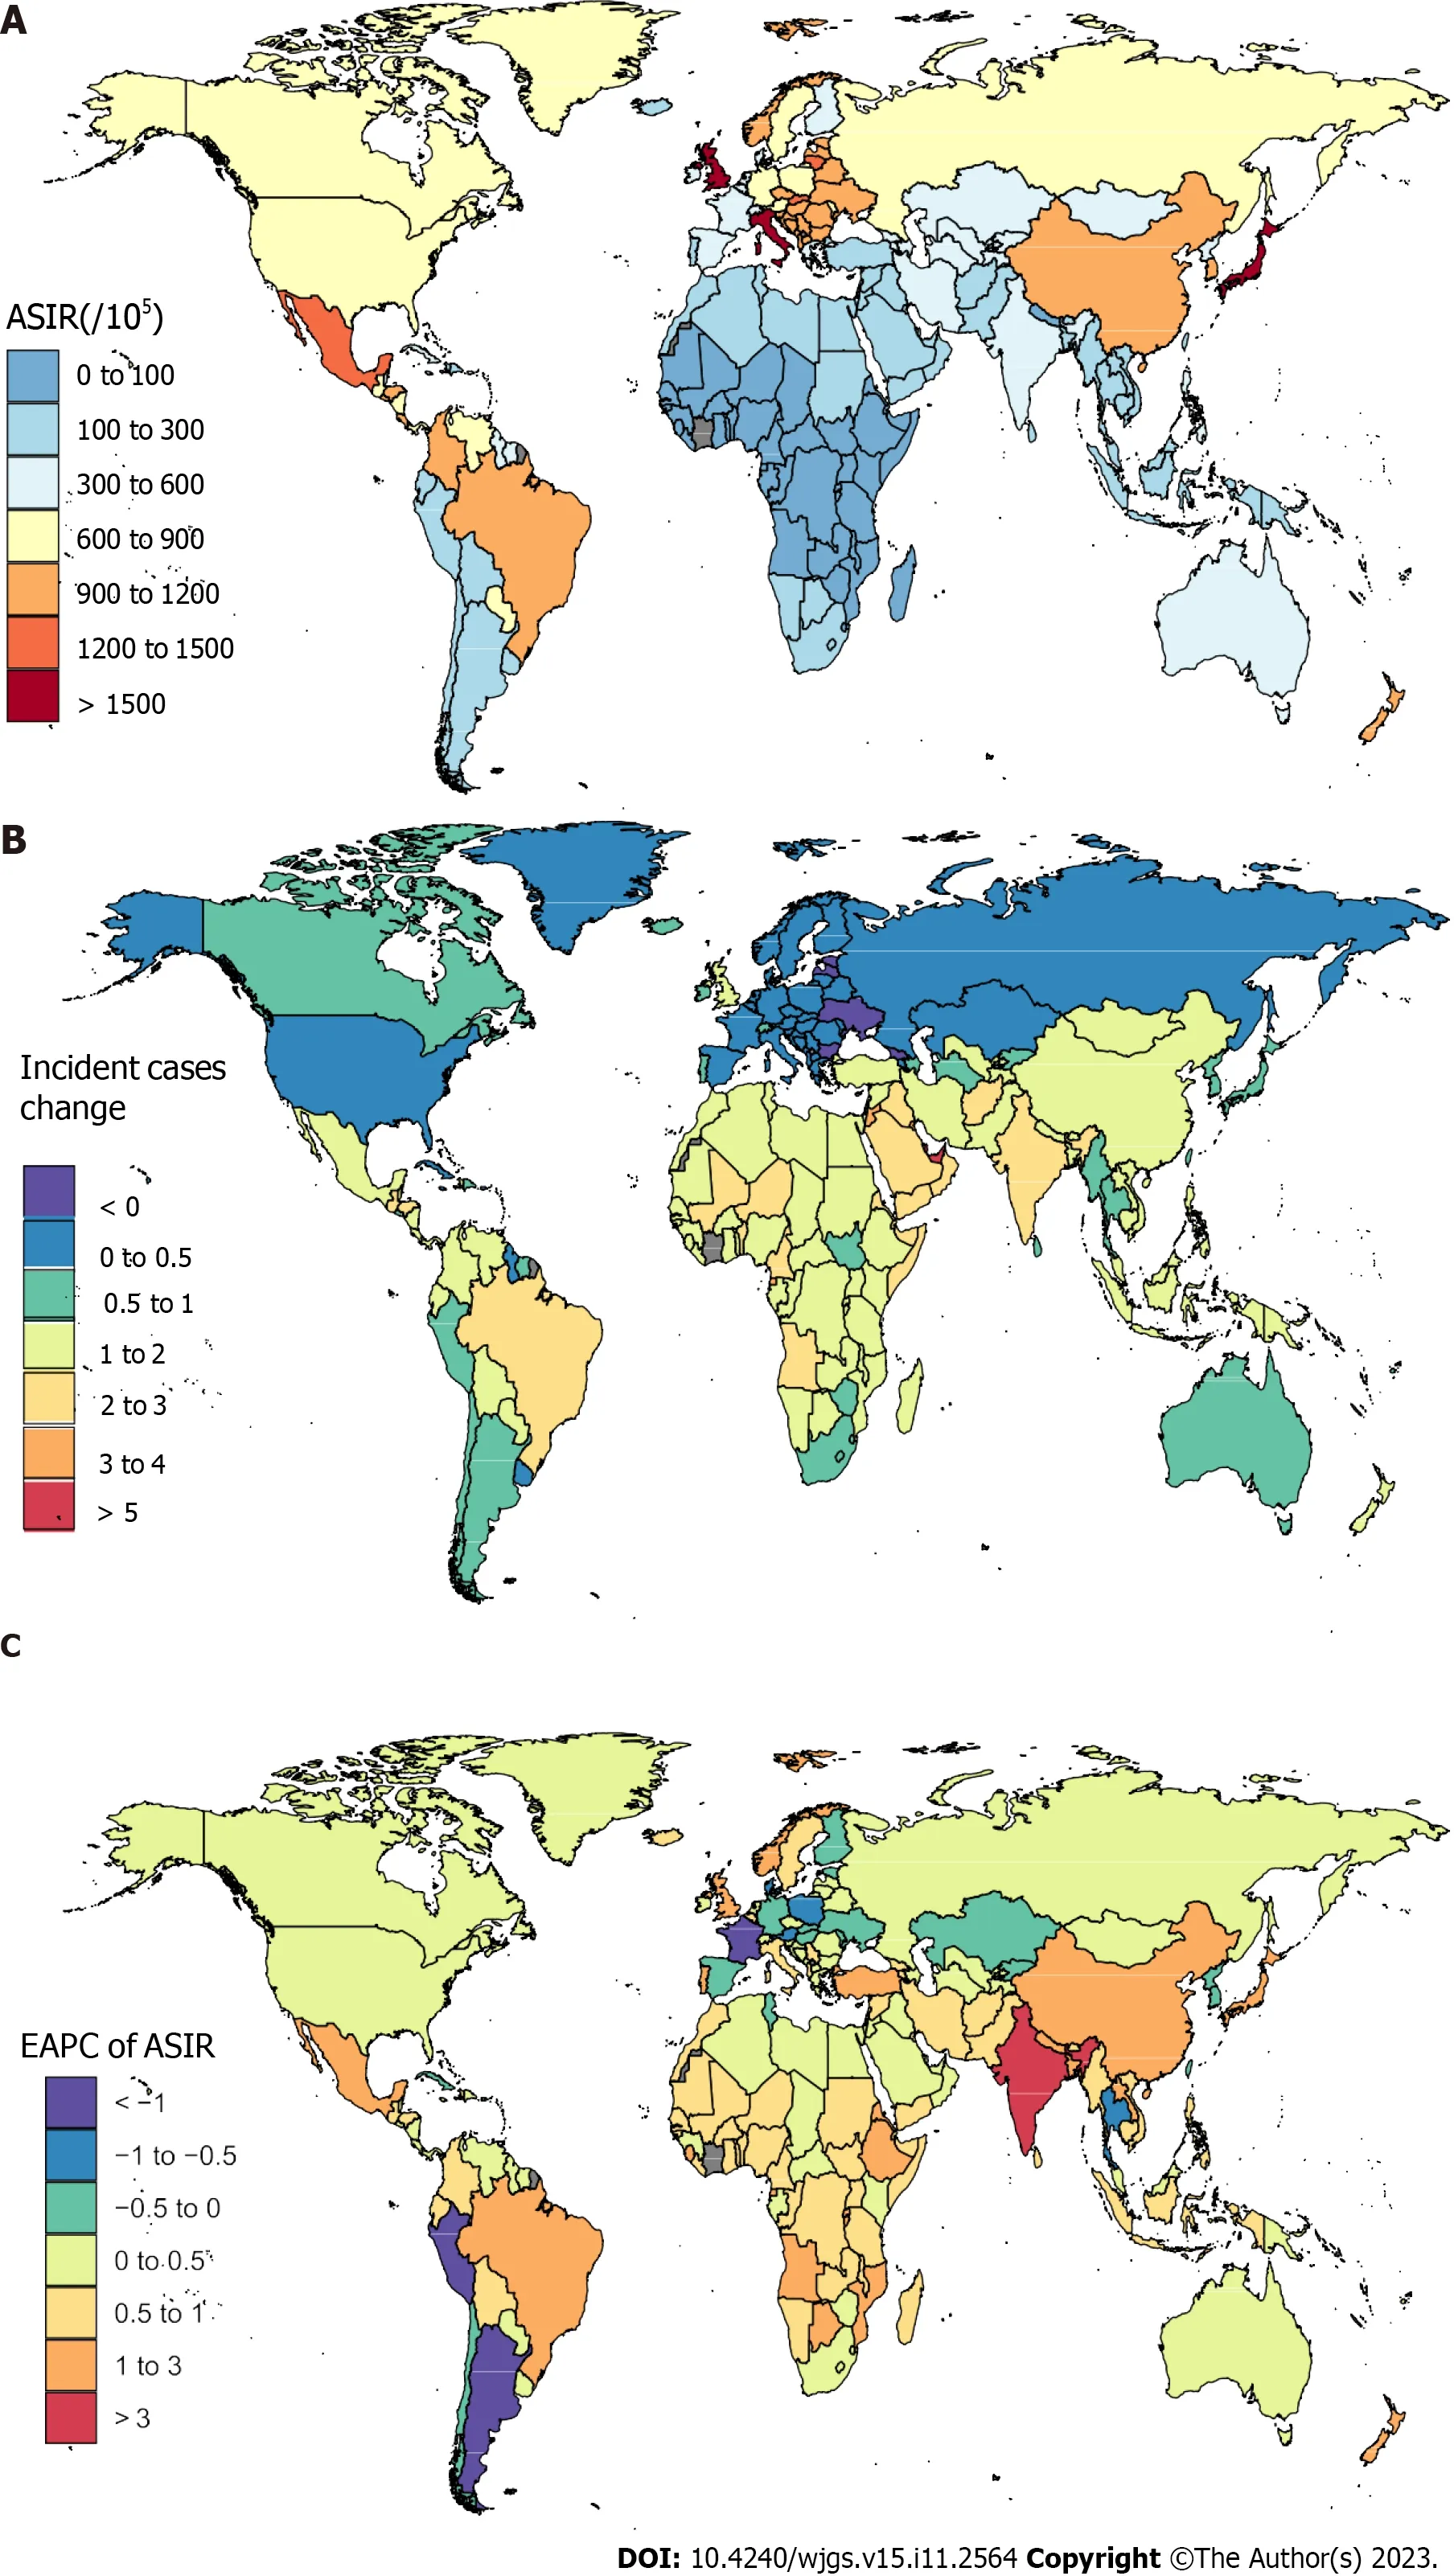
Figure 1 The global disease burden of gallbladder and biliary diseases for both sexes in 204 countries and territories. A: The agestandardized incidence rate (ASIR) of gallbladder and biliary disease (GABD) in 2019;B: The relative change in incident cases of GABD between 1990 and 2019;C:The estimated annual percentage change of GABD ASIR from 1990 to 2019.ASIR: Age-standardized incidence rate;EAPC: Estimated annual percentage change.
In 2019,the UnitedKingdom [6508.08 per 100000 population (5545.0 to 7764.50)] observed the highest ASPR,followed by Honduras [6070.86 per 100000 population (5273.68-7142.56)] and Italy [5448.65 per 100000 population (4619.27-6558.62)],whereas Cabo Verde [241.78 per 100000 population (196.60-290.47)],Sao Tome and Principe [277.51 per 100000 population (233.02-326.76)],and Nigeria [288.85 per 100000 population (235.57-356.61)] had the lowest ASPRs.From 1990to 2019,the most pronounced increased and decreased changes in the number of prevalent cases were observed in the United Arab Emirates (581%,496% to 669%) and Latvia (-27%,-34% to -21%),respectively (Supplementary Table 2).The largest ASPR increases were observed in India (EAPC=1.64,1.54-1.74) and New Zealand (EAPC=0.90,0.82-0.97) from 1990 to 2019.During this period,a total of 185 countries or territories experienced decreases in the GABD ASPR,with the largest ASPR decrease occurring in Peru (EAPC=-2.88,-2.98 to -2.78) (Supplementary Table 2).
At the national level,the highest GABD ASYR was observed in the United Kingdom [136.51 per 100000 population(86.400199.28)] in 2019,followed by Honduras [128.37 per 100000 population (82.34-192.13)] and Italy [115.01 per 100000 population (72.88-168.92)],whereas Cabo Verde [5.23 per 100000 population (3.28-7.82)],Sao Tome and Principe [5.97 per 100000 population (3.72-9.08)],and Nigeria [6.19 per 100000 population (3.89-9.17)] had the lowest.From 1990 to 2019,the most pronounced increased and decreased changes in the number of YLDs were observed in the United Arab Emirates(571.7%,447.4% to 723.5%) and Latvia (-27.4%,-34.3% to -20.0%),respectively (Supplementary Figure 1 and Supplementary Table 3).The largest ASYR increases were observed in India (EAPC=1.66,0.94-2.38) and New Zealand (EPC=0.93,0.42-1.44) between 1990 and 2019.A total of 185 countries or territories experienced an ASYR decrease during this period,with the largest decrease occurring in Peru (EAPC=-2.86,-3.56 to -2.14) (Supplementary Table 3).
SDI regions levels
From 1990 to 2019,the number of incident cases showed an increasing trend in both sexes,and since 2018,it began to decrease in the high-and middle-SDI quintiles.The numbers of incident cases increased in males and females across high-middle-SDI,low-,and low-middle-SDI quintiles from 1990 to 2019.In 2019,the highest increases in incident cases were observed in the middle-SDI regions [16564482.19 (95%UI: 13930955.39-19595424.22)],whereas the greatest decreases were observed in the low-SDI regions [1253652.02 (95%UI: 1062794.93-1455528.77)] (Figure 2A).From 1990 to 2019,the numbers of prevalent and YLD cases showed an increasing trend in both sexes in all SDI quintiles.The highest numbers of prevalent cases were observed in the middle-SDI regions [64380264.74 (95%UI: 54532616.95-77437635.83)],and the lowest prevalence cases were observed in low-SDI regions [6977018.13 (95%UI: 5870056.77-8390276.97)] in 2019.The highest YLD cases were observed in the middle-SDI regions [1360202.73 (95%UI: 858233.94-2012102.01)],and the lowest YLD cases were observed in the low-SDI regions [147359.90 (95%UI: 93751.28-214884.56)] in 2019.From 1990 to 2019,low-SDI regions showed a more prominent increase in incident cases (4.6-fold) than high-SDI regions (Figure 2A).Low-SDI regions showed a more prominent increase in prevalent (4.2-fold) and YLD cases (4.2-fold) than high-middle-SDI regions.
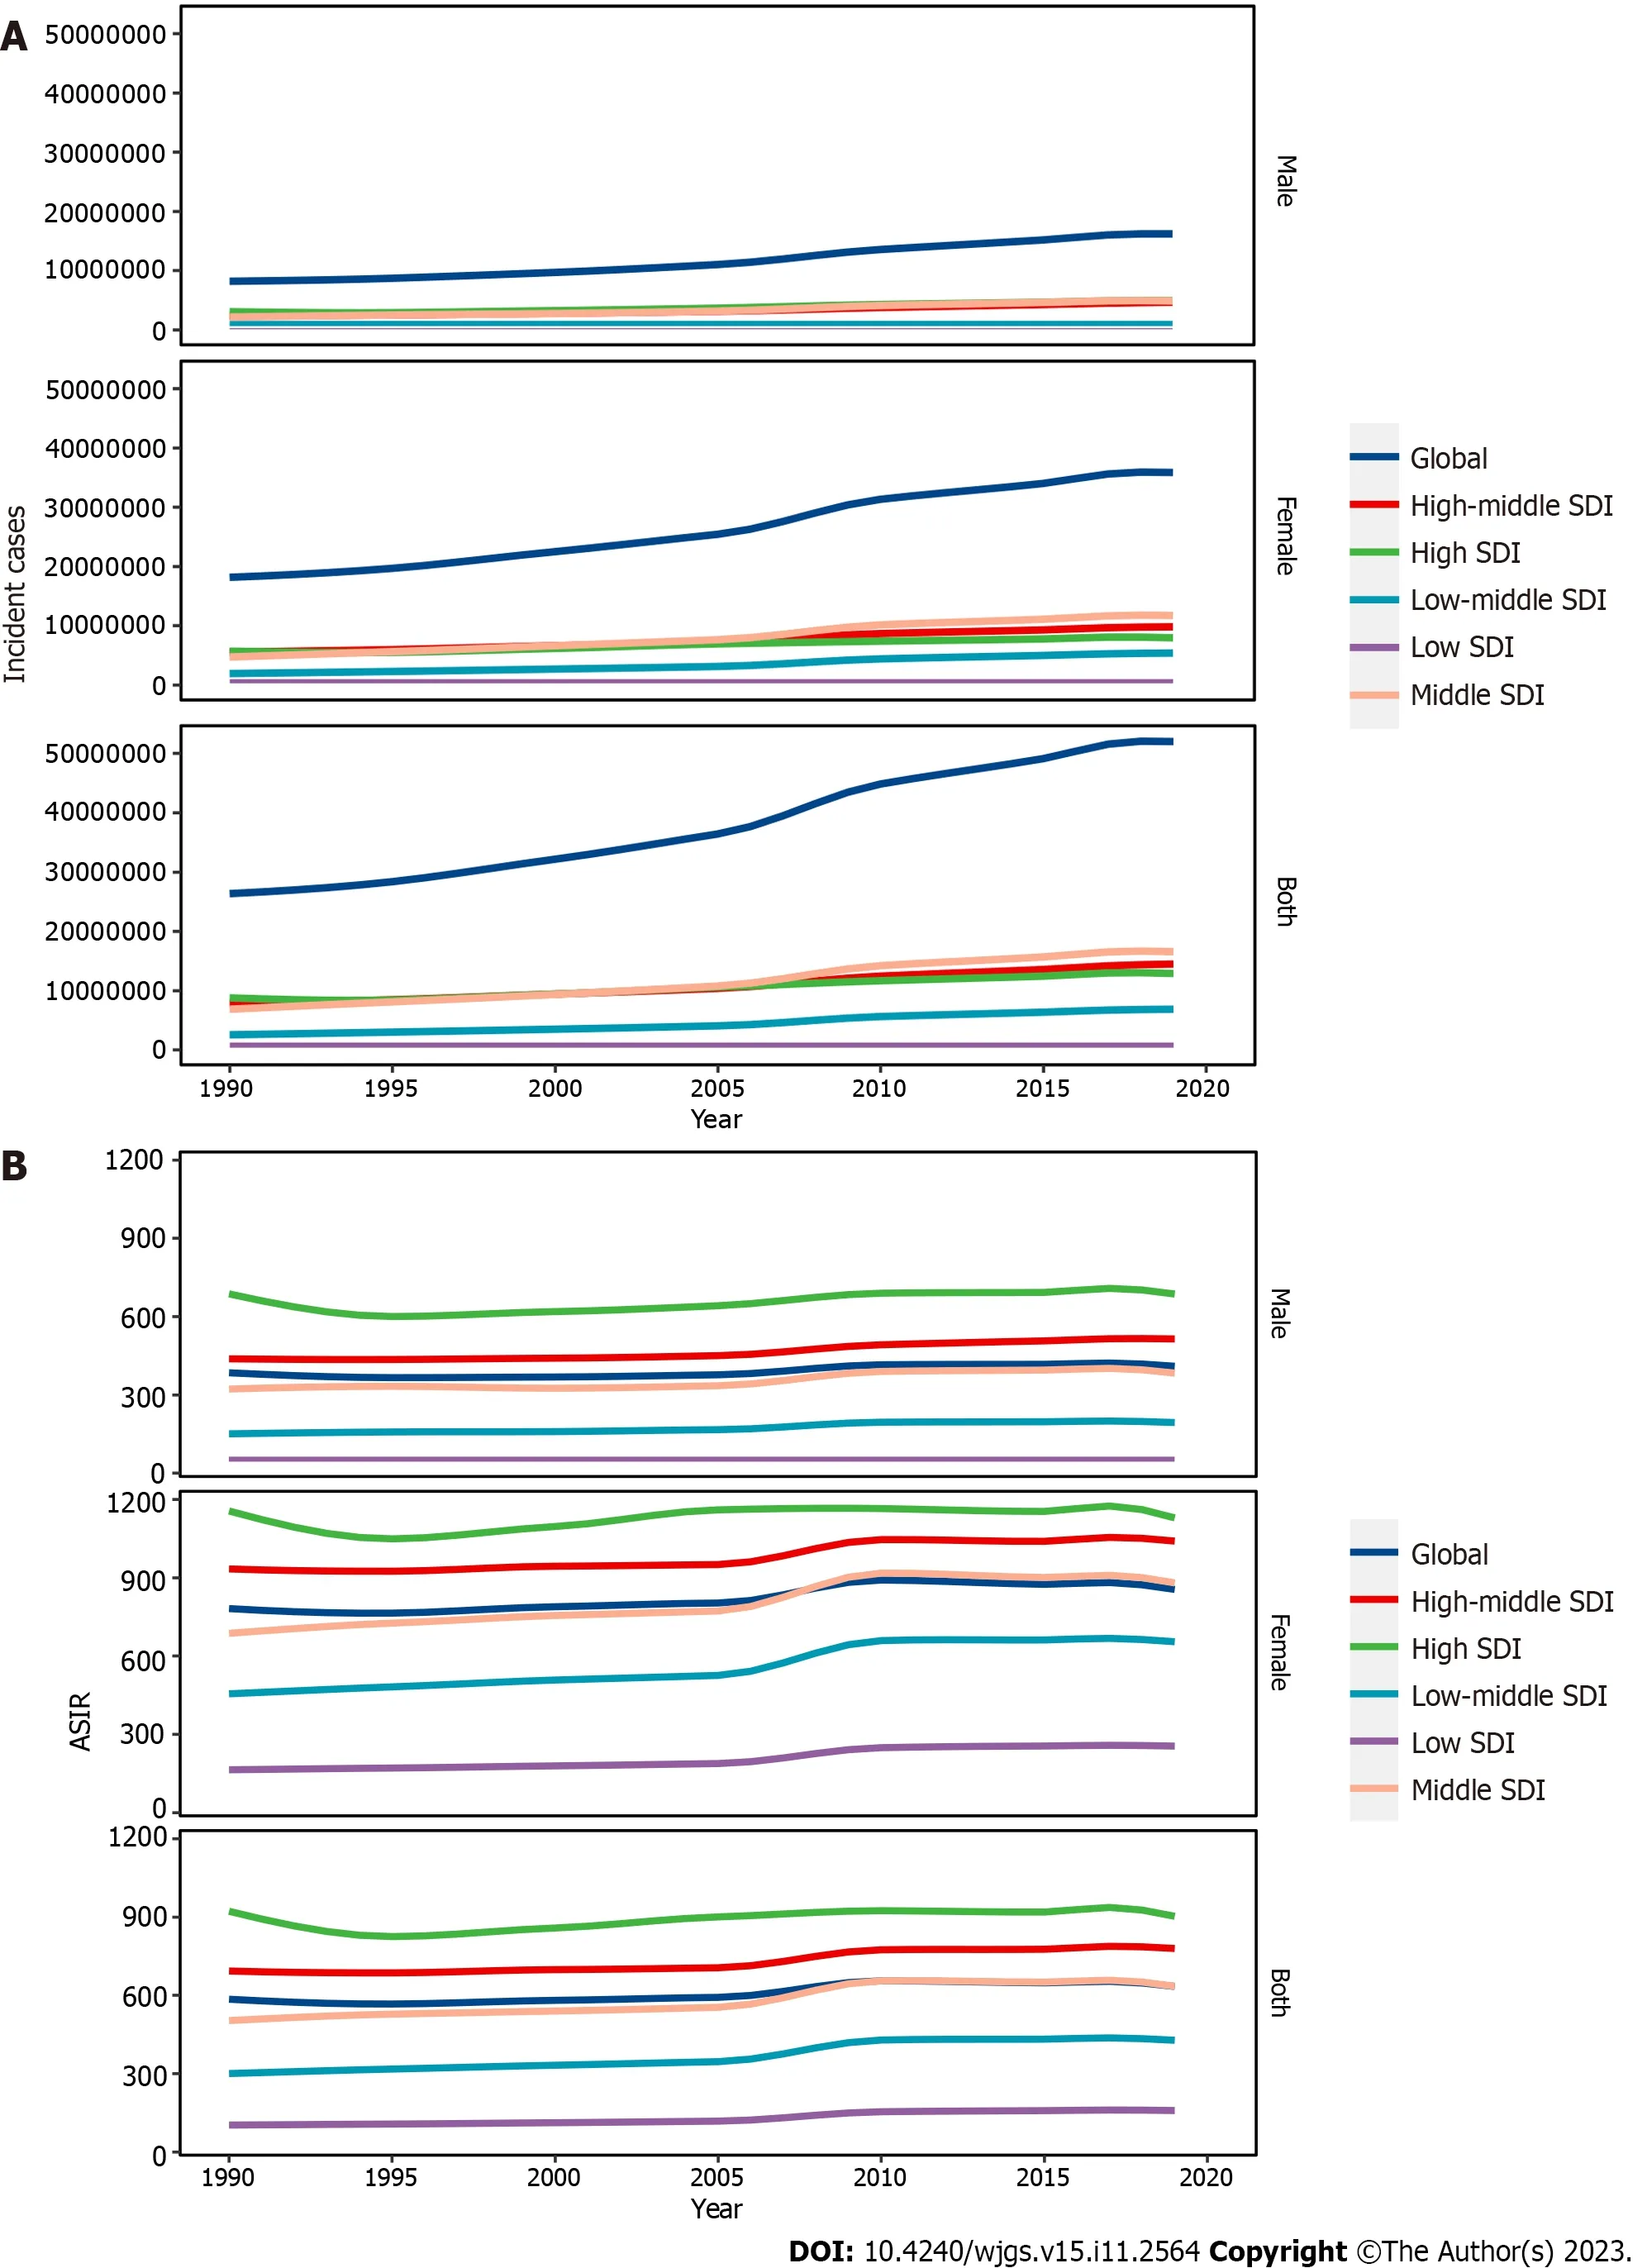
Figure 2 Incident cases,age-standardized incidence rate of gallbladder and biliary diseases at global and regional level from 1990 to 2019. A: Incident cases;B: Age-standardized incidence rate.ASIR: Age-standardized incidence rate;SDI: Sociodemographic index.
From 1990 to 2019,GABD ASIR in females decreased from 1990 in the high-SDI and high-middle-SDI regions and increased after 1995.This was then followed by a decline in 2010,an increase after 2015,and a decrease again after reaching its peak in 2018.ASIR in males decreased from 1990,began to increase after 1995,and decreased after reaching its peak in 2018.In the high-middle-SDI regions,ASIR in males decreased in 1990,began to increase after 1994,and decreased after reaching its peak in 2018.However,the ASIR in low-SDI and low-middle-SDI regions showed an increasing trend in both sexes.In the middle-SDI regions,ASIR in females increased in 1990,and decreased after reaching its peak in 2010.Furthermore,ASIR in males increased in 1990 and decreased after reaching its peak in 2017.The highest ASIR was observed in high-SDI regions [903 (95%UI: 776-1051)],and the lowest ASIR was observed in low-SDI regions[159 (95%UI: 136-184)] in 2019 (Figure 2B).
In the high-SDI regions,GABD ASPR in females decreased in 1990,increased after 1996,declined in 2000,increased again after 2011,declined again in 2015,and increased again in 2017.ASPR in males decreased in 1990 and began to increase after 2011.In the high-middle-SDI quintile,the ASPR in both sexes gradually declined.In the low-SDI,lowmiddle-SDI,and middle-SDI regions,ASPR in females and males decreased in 1990,began to increase after 2005,and then decline after 2010.The highest ASPRs were observed in high-SDI regions [2697 (95%UI: 2368-3139)],and the lowest ASPRs were observed in low-SDI regions [932 (95%UI: 797-1100)] in 2019.
The ASYR in females and males showed a decreasing trend in the high-SDI and high-middle-SDI regions.In the low SDI and low-middle-SDI regions,the ASYR in both sexes gradually decreased until 2005 and declined after reaching a maximum in 2010.The ASYR in males gradually decreased until 2006 and declined after reaching a maximum in 2011 in the middle-SDI regions.The ASYR in females gradually decreased until 2005 and declined after reaching a maximum in 2010 in the middle-SDI regions.The highest ASYR cases were observed in high-SDI regions [57 (95%UI: 36-82)],and the lowest ASYR cases were observed in low-SDI regions [19 (95%UI: 12-28)] in 2019.Compared to high-SDI regions,low-SDI regions showed a more prominent increase in ASIR (5.6-fold).The highest decrease in the absolute ASPR (2.0-fold) and ASYR (2.0-fold) was observed in the high-middle-SDI quintile.The greatest increasing changes in the absolute ASIR were observed in low-SDI regions [EAPC=1.93 (1.55 to 2.30)] from 1990 to 2019.The greatest increasing ASPR and ASYR changes were observed in low-SDI regions [EAPC=0.44 (0.30-0.58),and EAPC=0.44 (-0.52 to 1.41),respectively],whereas the greatest decreasing ASPR and ASYR changes were observed in high-middle-SDI regions [EAPC=-0.89 (-0.97 to -0.82),and EAPC=-0.87 (-1.40 to -0.34),respectively] (Table 1).
21 GBD regions levels
In 2019,among the 21 GBD regions,the highest numbers of incident,prevalent,and YLD cases was observed in East Asia[18820462 (15683952-22743374),67192927 (56174716-81311138),and 1421897 (901930-2106987),respectively] and South Asia [5531860 (4673821-6539869),29094357 (23807912-35617849),and 605844 (385259-891933),respectively],and the lowest number of cases was Oceania [15180 (13016-17782),103799 (87862-122072),and 2197 (1379-3315),respectively] and Central sub-Saharan Africa [45585 (38870-53756),354446 (297954-420852),and 7621 (4751-11507),respectively] (Figure 3A,Supplementary Figures 2A and 3A).From 1990 to 2019,the changes in the numbers of incident,prevalent,and YLD cases differed between the 21 GBD regions,with the largest increases and decrease in all metrics observed in South Asia [2.62(2.43-2.83),1.58 (1.41-1.73),and 1.56 (1.39-1.72),respectively].and Eastern Europe [0.06 (0.01-0.13),-0.14 (-0.19 to -0.08),and -0.14 (-0.19 to -0.08),respectively] (Figure 3B,Supplementary Figures 2B and 3B).
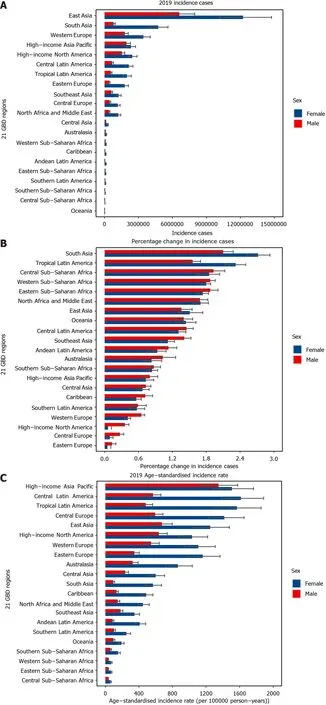
Figure 3 Levels and trends in all ages incidence cases of gallbladder and biliary diseases across 21 global burden of diseases regions by sex. A: The incidence cases of gallbladder and biliary disease (GABD) in 2019;B: The percentage change in incidence cases of GABD from 1990 to 2019;C: The age-standardized incidence rate (ASIR) of GABD in 2019;D: The percentage change in ASIR of GABD from 1990 to 2019.GBD: Global Burden of Diseases Study;EAPC: Estimated annual percentage change.
The highest ASIRs,ASPRs and ASYRs were observed in high-income Asia Pacific [1426.23 per 100000 population(1211.62-1670.16)],Central Latin America [4759.26 per 100000 population (4118.61-5625.11)],and Central Latin America[100.62 per 100000 population (64.01-149.28),respectively] (Figure 3C,Supplementary Figures 4A and 5A).From 1990 to 2019,the changes in the ASIR were also different between the 21 GBD regions,with most countries showing an increasing trend.The largest decrease was observed in the Southern Latin America [-107.9% (-137.0% to -78.7%)],whereas the largest increases were observed in South Asia [292.0% (264.0%-320.1%)] and Tropical Latin America [166.0% (152.6%-179.5%)](Figure 3D).Furthermore,during this period,the changes in the ASPR and ASYR were also different between the 21 GBD regions,with most countries showing a decreasing trend.Andean Latin America [-206.4% (-216.9% to -196.0%) and -205.0% (-276.7% to -132.7%),respectively] had the largest decrease in ASPR and ASYR (Supplementary Figures 4B and 5B).
Age and sex patterns
Incident cases,prevalent cases,and YLDs varied by age and sex.In addition,these metrics increased with age,reaching their highest levels in the 50-54 age groups for both females and males.This was then followed by a decreasing tend with increasing age.The number of incident,prevalent,and YLD cases was higher in females than in males across all age groups.The ASIR,ASPR,and ASYR of GABD increased nonlinearly with increasing age and were higher in females than in males for all age groups in 2019 (Figure 4,Supplementary Figures 6 and 7).
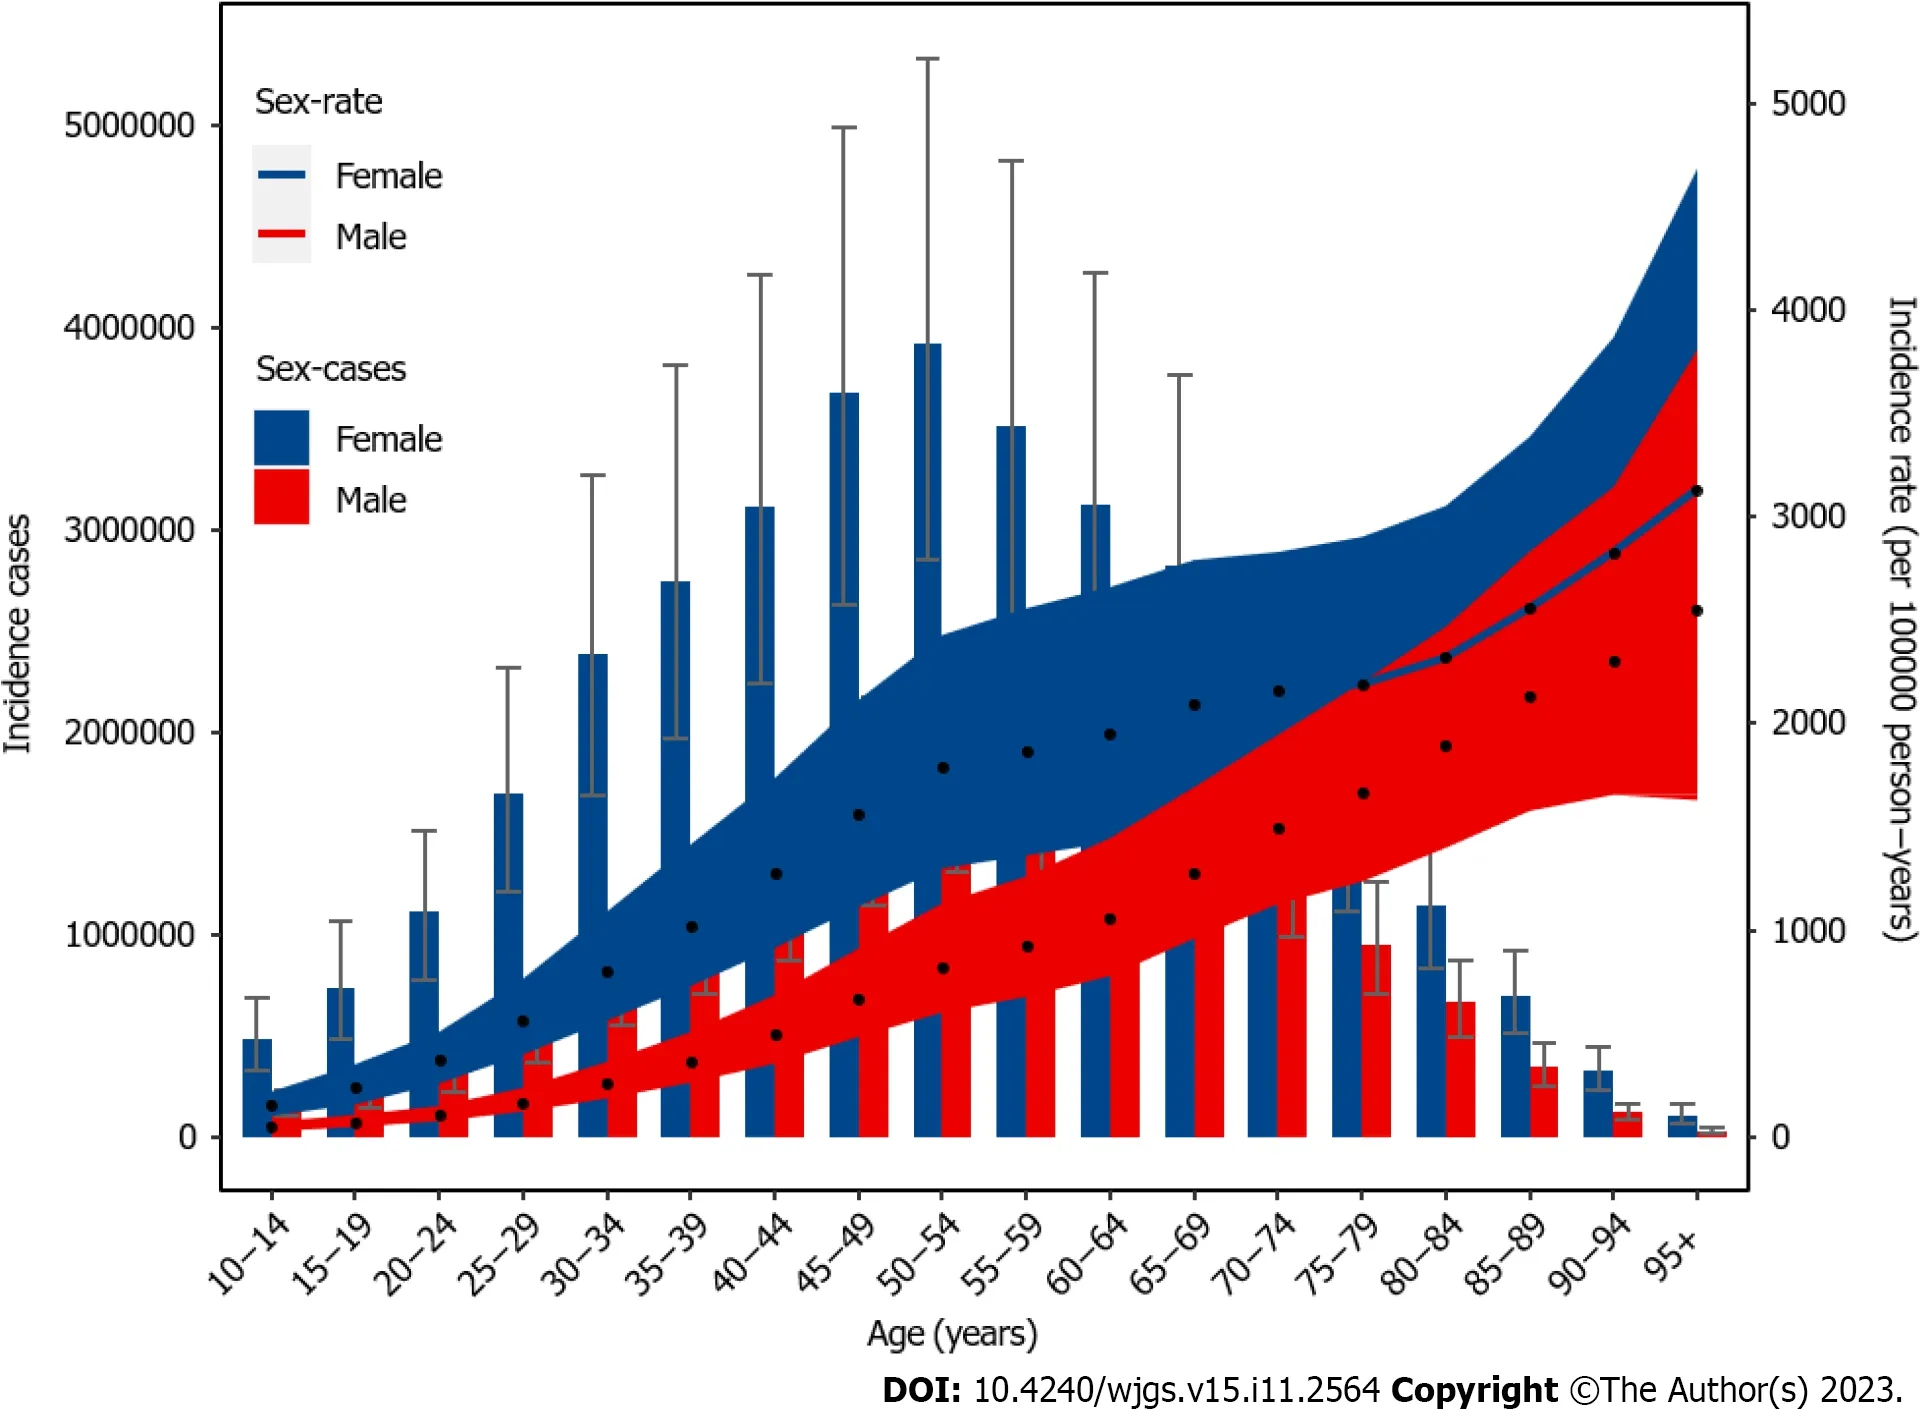
Figure 4 Age-specific numbers and rates of incident cases of gallbladder and biliary diseases by sex,2019.
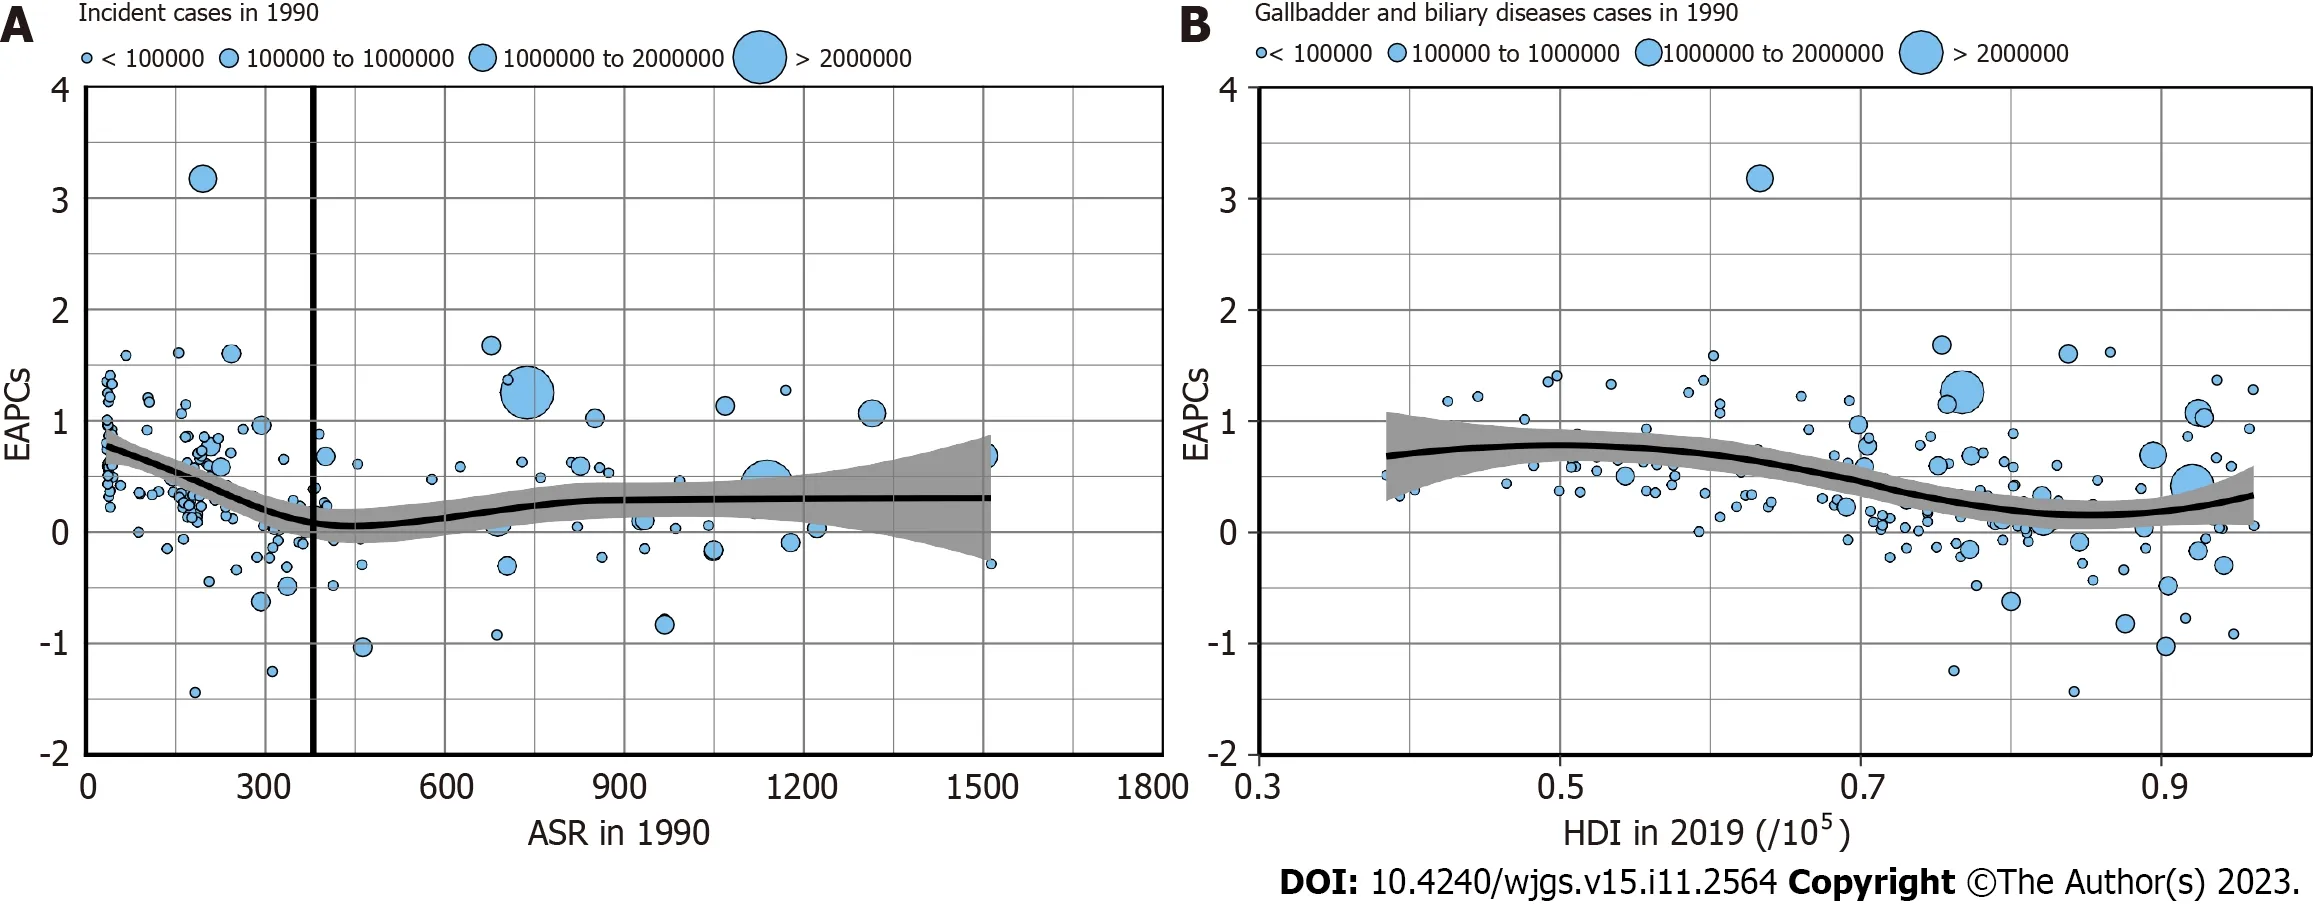
Figure 5 The correlation between estimated annual percentage change and gallbladder and biliary diseases age-standardized incidence rate in 1990 and human development index in 2021. A: The correlation between estimated annual percentage change (EAPC) and gallbladder and biliary diseases age-standardized incidence rate in 1990;B: The correlation between EAPC and human development index (HDI) in 2021.The circles represent countries that were available on HDI data.The size of the circle is increased with the cases of gallbladder and biliary diseases.The ρ indices and P-values presented in (A) and(B) were derived from Pearson correlation analysis.EAPC: Estimated annual percentage change;HDI: Human development index;ASR: Age-standardized rate.
Factors influencing EAPC
As shown in Figures 5A and B,EAPC was significantly associated with the ASIR (in 1990) and HDI (in 2021).A significant negative correlation (ρ=-0.46,P< 0.05) between the EAPC and ASIR (in 1990) was found when the baseline ASIR was ≤ 380 per 100000 population.However,no correlation was found when the ASIR was ≥ 380 per 100000 population (ρ=0.08,P=0.54).In addition,GABD negatively correlated (ρ=-0.24,P< 0.05) of GABD with the EAPC and HDI (in 2021).
Supplementary Figures 8A and B show that EAPC significantly associated with ASPR (in 1990) but not with HDI (in 2021).A significant negative correlation (ρ=-0.18,P< 0.05) between EAPC and ASPR (in 1990) was found when the baseline ASPR was ≥ 600 per 100000 population.Similarly,a significant negative correlation was found when ASPR was ≤600 per 100000 population (ρ=0.32,P< 0.05).However,no correlation (ρ=-0.06,P=0.39) between EAPC and HDI (in 2021) was observed.
Supplementary Figures 9A and B show that the EAPC significantly correlated with ASYR (in 1990) but not with HDI(in 2021).A significant negative correlation (ρ=-0.15,P< 0.05) between EAPC and ASYR (in 1990) was found when the baseline ASYR was ≥ 30 per 100000 population.In contrast,no correlation was found when the ASYR was ≤ 10 per 100000 population (ρ=-0.20,P=0.24).However,no negative correlation (ρ=-0.07,P=0.36) of GABD between EAPC and HDI(in 2021) were found.
DISCUSSION
In this study,we analyzed the temporal trends of GABD incidence,prevalence and YLDs at the global,regional,and national levels from 1990 to 2019.During this period,while the global GABD ASIR showed an increasing trend,ASPR and ASYR experienced an overall decreasing trend.By contrast,the number of incidents,prevalence,and YLD cases increased from 1990 to 2019.Consistent with previous research[13],this study suggested that GABD is one of the major causes of burden globally.In contrast to prior research[13],our study specifically analyzed the number,ASIR rate,and YLD rate of GABD globally and in 5 SDI regions,21 GBD regions,and 204 countries.In addition,we employed the EAPC method to quantify GABD trends over the last 30 years.
From 1990 to 2019,both the number of incident cases and ASIR experienced an increasing trend globally,which may be attributed to the growing global population and increased life expectancy in recent years.We found that high-SDI regions had the highest ASIR,ASPR,and ASYR in 2019.However,low-SDI regions experienced the greatest increased in ASIR and an increasing trend in ASPR and ASYR.In addition,high-SDI regions had the lowest increased in ASIR.These finding indicated that the GABD burden may be related to factors such as obesity,dietary patterns,and physical exercise.The prevalence of obesity was higher in high-SDI regions than in low-SDI regions,which could be attributed to food shortages in the latter[24,25].However,healthy dietary patterns in high-SDI regions,such as decreased consumption of preserved and salted foods and increased consumption of fresh fruits and vegetables,and physical exercise,may have contributed to a lower increase in ASIR from 1990 to 2019.On the contrary,improved diets,such as increased consumption of fat and high-calorie foods,in low-SDI regions may have led to an increasing trend of ASIR in GABD[26].Laparoscopic cholecystectomy (LC) is the gold standard procedure for the treatment of acute gallbladder diseases.However,nonsurgical management includes endoscopic ultrasound-guided gallbladder drainage (EUS-GBD) and percutaneous transhepatic gallbladder drainage (PT-GBD) was also a choice for the treatment of acute cholecystitis.However,in some low-SDI regions,they can only conduct open cholecystectomy and cannot performed less invasive LC,EUS-GBD,and PT-GBD due to limited medical resources,which may lead to higher prevalence and YLDs[27,28].Furthermore,we found that high-income Asia Pacific countries,including Japan,have a high ASIR of GABD,whereas the least developed regions such as the sub-Saharan Africa region (e.g.,Somalia and Guinea) had lower ASIR in 2019.From 1990 to 2019,developing countries,such as India and Brazil,showed a high increasing trend[29].Our study was consistent with this finding that developed countries or regions have a higher GABD burden.Taken together,these results suggested that developed countries had higher ASIR,whereas developing and underdeveloped regions and countries showed a higher increasing trend.
Previous studies have identified age,gender,obesity,and diabetes mellitus,among other,as the risk factors for GABD[4].In this study,we observed an increased incidence rate of GABD in females compared to males across all age groups,with the highest rates observed in the 50-54 age group.These findings indicated that the GABD burden is greater in females than in males and that new cases are more common in the middle-aged population.A previous study reported a cumulative incidence of 0.81% in females and 0.66% in males in Italy,in line with our study[30].The standardized incidence rate of GABD was higher in female (≥ 15 per 100000 person-years) than in male (≤ 6 per 100000 person-years)children from 1993 to 2012[31].This could be attributed to the following factors.First,estrogen increases the secretion of biliary cholesterol and reduces gallbladder contraction,leading to an increased cholesterol saturation in bile,which can promote gallstone formation and the development of biliary diseases.Females have higher levels of estrogen than males,particularly during their reproductive years,which may explain their increased susceptibility to GABD[32,33].Moreover,previous animal studies have shown that female reproductive hormones stimulate the formation of gallstones by increasing bile cholesterol excretion and endogenous synthesis[33].Second,females are more likely to be obese,have a sedentary lifestyle,and consume a high-fat diet,all of which are risk factors for GABD[25,30].A high-fat diet may result in reduced fecal excretion of bile acids,thus decreasing the bile acid pool and promoting bile supersaturation,leading to lithogenicity[34].Third,pregnancy increases the risk of developing gallstones due to changes in progesterone and estrogen levels and increased pressure on the gallbladder from the growing uterus[4,35,36].Finally,genetic factors may make females more susceptible to GABD than males[37].Given the higher burden of GABD in females,we recommend that greater attention be paid to the prevention and treatment of GABD in this population by implementing interventions to reduce this disparity.Ascorbic acid supplementation,treating iron deficiency,and increasing vegetable consumption are potential interventions that may reduce the GABD burden in females[38].
A study indicated that the incidence of stone formation is almost twice as high in females compared to males,and this disparity decreases after menopause[39].In the 20-24 age group,the GABD incidence rate in females is 3.5 times higher than in males;however,this ratio decreases to 1.2 times in the 85-89 age group,which represents the smallest gender gap.This finding confirms the reduction in the incidence gap between males and females after menopause The highest incidence rates of GABD in both males and females were observed in the 95-plus age group,highlighting the higher risk of gallstone disease in older individuals[40,41].Therefore,more attention and resources,such as regular health check-ups,encouraging physical activity,improving their dietary habits,and managing chronic conditions such as diabetes and metabolic syndrome,should be allocated to elderly individuals to prevent GABD.
Although Lietal[13] evaluated the relationship with SDI,to our knowledge,our study was the first to assess the correlation between ASIRs and EAPCs and HDI in each country.Compared with SDI,HDI is more widely used for comparing levels of human development between countries and over time.From 1990 to 2019,the amplitudes of ASIR variations were significantly negatively associated with the baseline ASIRs.This finding indicated that countries with lower ASIRs in 1990 may have experienced an increase in ASIRs.This may be attributed to limited public health resources,which prevented these countries from prioritizing GABD prevention over other public health disease prevention initiatives.Furthermore,our analysis found a significant negative association between EAPC and HDI in 2019 for GABD,suggesting that countries with higher HDI in 2019 experienced a lower burden of GABD.For instance,developed nations such as France and Denmark exhibited a decrease in GABD.
The present study has several limitations.First,the robustness and reliability of GBD estimates for GABDs could be influenced by the quality and quantity of the modeling data.Due to the absence or sparsity of data from some countries and territories,the burden estimates relied heavily on the modeling data.Therefore,large-scale population-based health surveys should be conducted to obtain more representative and comprehensive data for better estimation.Second,variations in prevention strategies,diagnostic criteria,and management policies in different countries and territories were not evaluated,which may cause substantial discrepancies even among countries with similar HDI.Third,stratification by anatomic location of GABD was not provided in the GBD 209 estimates.Therefore,to improve the accuracy of the estimates,data including information on anatomic subtypes should be obtained,if feasible.Fourth,the potential variations in the effects of prevention and management strategies between low-to middle-SDI and high-SDI countries were not considered in this study.Therefore,future studies exploring these variations to better understand their impacts on the disease burden are warranted.
CONCLUSION
GABD remains a major global public health challenge,and the disease burden varies geographically.Between 1990 and 2019,the number of cases and ASIR of GABD increased globally.In addition,although GABD ASPR and ASYR decreased,the number of prevalent and YLD cases increased.The highest burden of GABD was observed in low-SDI regions,and the burden was significantly higher among females than males.We believe that the findings of this study will provide insight into the global disease burden of GABD and assist policymakers in formulating effective policies to mitigate modifiable risk factors.
ARTICLE HIGHLIGHTS
Research background
Gallbladder and biliary disease (GABD) remains a major global public health challenge,and the disease burden varies geographically.
Research motivation
From 1990 to 2019,the number of cases and age-standardized incidence rate (ASIR) of GABD increased globally.What’s more,although GABD age-standardized prevalence rate (ASPR) and age-standardized lived with disability (YLD) rate(ASYR) decreased,the number of prevalent and YLD cases increased.
Research objectives
We aim to research the incidence,prevalence,and YLDs of GABD and their temporal trends from 1990 to 2019 in 204 countries and territories at the global,regional,and national levels.The association between estimated annual percentage changes (EAPCs),ASIRs,ASPRs,and ASYRs (1990),and human development index (HDI) (2021) were also assessed at the national level.
Research methods
The study used EAPC to quantify the age-standardized incidence of GABD by region,sex,and cause.ASIRs,ASPR and ASYR.Socio-demographic index (SDI) was used to analyze the relationship between GABD burden and national development level.
Research results
In 2019,the incident cases of GABD were 52003772,with an ASIR of 634.32 per 100000 population.Globally,the number of incident cases and ASIR of GABD increased 97% and 58.9% between 1990 and 2019.Although,the ASPR and ASYR decreased from 1990 to 2019,the number of prevalent and YLDs cases increased.The highest ASIR was observed in Italy,and the highest ASPR and ASYR was observed in United Kingdom.The highest burden of GABD was found in low-SDI region,and the burden in female was significantly higher than males.A generally negative correlation (ρ=-0.24,P< 0.05)of GABD with the EAPC and HDI (in 2021) were observed for ASIR.What’s more,no correlation in ASPR (ρ=-0.06,P=0.39) and ASYR (ρ=-0.07,P=0.36) of GABD with the EAPC and HDI (in 2021) were observed,respectively.
Research conclusions
From 1990 to 2019,the number of cases and ASIR of GABD increased globally.What’s more,although GABD ASPR and ASYR decreased,the number of prevalent and YLD cases increased.The highest burden of GABD was observed in low-SDI regions,and the burden was significantly higher among females than males.
Research perspectives
We believe that the findings of this study will provide insight into the global disease burden of GABD and assist policymakers in formulating effective policies to mitigate modifiable risk factors.
ACKNOWLEDGEMENTS
We appreciate the works by the Global Burden of Disease study 2019 collaborators.We thank Bullet Edits Limited for the linguistic editing and proofreading of the manuscript.
FOOTNOTES
Co-first authors:Zhong-Zhuan Li and Lin-Jing Guan.
Co-corresponding authors:Guo-Qing Ouyang and Hai-Xing Jiang.
Author contributions:Li ZZ,Guan LJ,Jiang HX,and Ouyang GQ conceived,designed and refined the study protocol;Li ZZ,Guan LJ,Ouyang R,and Chen ZX were involved in the data collection;Li ZZ,Guan LJ,and Ouyang GQ analyzed the data;Li ZZ,Guan LJ,and Jiang HX drafted the manuscript;All authors were involved in the critical review of the results and have contributed to,read,and approved the final manuscript.Li ZZ and Guan LJ contributed equally to this work as co-first authors;Ouyang GQ and Jiang HX contributed equally to this work as co-corresponding authors.The reasons for designating Ouyang GQ and Jiang HX as cocorresponding authors are threefold.First,the research was performed as a collaborative effort,and the designation of co-corresponding authorship accurately reflects the distribution of responsibilities and burdens associated with the time and effort required to complete the study and the resultant paper.This also ensures effective communication and management of post-submission matters,ultimately enhancing the paper's quality and reliability.Second,the overall research team encompassed authors with a variety of expertise and skills from different fields,and the designation of co-corresponding authors best reflects this diversity.This also promotes the most comprehensive and in-depth examination of the research topic,ultimately enriching readers' understanding by offering various expert perspectives.Third,Ouyang GQ and Jiang HX contributed efforts of equal substance throughout the research process.The choice of these researchers as co-corresponding authors acknowledges and respects this equal contribution,while recognizing the spirit of teamwork and collaboration of this study.In summary,we believe that designating Ouyang GQ and Jiang HX as co-corresponding authors of is fitting for our manuscript as it accurately reflects our team's collaborative spirit,equal contributions,and diversity.
Supported bythe Liuzhou Science and Technology Plan Project,No.2021CB0101.
Conflict-of-interest statement:All the authors report no relevant conflicts of interest for this article.
PRISMA 2009 Checklist statement:The authors have read the PRISMA 2009 Checklist,and the manuscript was prepared and revised according to the PRISMA 2009 Checklist.
Open-Access:This article is an open-access article that was selected by an in-house editor and fully peer-reviewed by external reviewers.It is distributed in accordance with the Creative Commons Attribution NonCommercial (CC BY-NC 4.0) license,which permits others to distribute,remix,adapt,build upon this work non-commercially,and license their derivative works on different terms,provided the original work is properly cited and the use is non-commercial.See: https://creativecommons.org/Licenses/by-nc/4.0/
Country/Territory of origin:China
ORCID number:Lin-Jing Guan 0000-0002-9690-6565;Guo-Qing Ouyang 0000-0002-0130-7958.
S-Editor:Wang JJ
L-Editor:A
P-Editor:Zhao S
 World Journal of Gastrointestinal Surgery2023年11期
- World Journal of Gastrointestinal Surgery的其它文章
- Systematic sequential therapy for ex vivo liver resection and autotransplantation: A case report and review of literature
- Gastric inflammatory myofibroblastic tumor,a rare mesenchymal neoplasm: A case report
- Comprehensive treatment and a rare presentation of Cronkhite-Canada syndrome: Two case reports and review of literature
- Isolated traumatic gallbladder injury: A case report
- Metachronous primary esophageal squamous cell carcinoma and duodenal adenocarcinoma: A case report and review of literature
- Organ sparing to cure stage IV rectal cancer: A case report and review of literature