A multilayer network model of the banking system and its evolution
Jiang Qiao Liu Xiaoxing,2 Ma Qianting
(1 School of Cyber Science and Engineering,Southeast University,Nanjing 211189,China)(2 School of Economics and Management,Southeast University,Nanjing 211189,China)(3 College of Finance,Nanjing Agricultural University,Nanjing 210095,China)
Abstract:A multilayer network model of the banking system is constructed based on the Pearson,Spearman,and Kendall correlations among stock returns.The three correlations correspond to the multilayer network’s Pearson,Spearman,and Kendall layers.This paper empirically analyzes the evolutionary characteristics of the multilayer network structure of the banking system from 2011 to 2020,using data from China’s listed banks.The following are the principal findings based on empirical research.Firstly,the large state-owned banks are more active within the banking system.Secondly,the interlayer correlation of the multilayer banking network exhibits volatility,with the Spearman and Kendall layers showing a higher correlation than the Pearson layer.Thirdly,the constructed bank multilayer network exhibits small-world characteristics.Fourthly,all bank nodes influence each layer of the banking multilayer network.The present research reveals the dependency structure between various correlations of bank yield fluctuations,which has a specific theoretical reference value for maintaining the banking system’s smooth operation.
Key words:multilayer network model; banking system; network evolutionary characteristics; small-world characteristics; dependency structure
Commercial banks are a significant part of the modern financial system and an indispensable financial intermediary for the economic system’s health and stability.Commercial banks form intricate business associations through various forms,such as interbank lending and investment[1].A complex network can represent the complex credit and debt relationships among commercial banks,with commercial banks serving as the network’s nodes and the credit and debt relationships serving as the network’s edges.Complex network relationships between commercial banks facilitate the efficient and rational allocation of liquidities in the interbank financial market.Simultaneously,however,it causes the risk of a single financial institution to rapidly spread to other banks,thus transforming it into a systemic risk for the entire banking industry[2].Therefore,studying the complexity of interbank linkages from the perspective of complex networks will aid in a deeper understanding of the banking system’s complex microstructure.In addition,it has significant reference value for preserving the stability of the interbank market and enhancing the quality and efficacy of the development of commercial banks.
The complex network theory is widely employed in the study of the structural characteristics of the banking network,and it is an effective tool for studying the correlation between financial entities.Current research focuses extensively on the single-layer correlation among banks.Scholars have discovered that Japan’s interbank payment network[3],Brazil’s interbank risk exposure network[4]and Russia’s interbank loan network[5]show scale-free properties.Both the US interbank payment network[6]and the UK interbank payment network[7]show small-world attributes.Meanwhile,the structure of the Austrian[8],Colombian[9],and German interbank lending networks[10]is hierarchical.Moreover,the Brazilian[11]and the Dutch interbank market interbank lending network[12]have a money center structure.Lastly,the interbank overnight lending market network in Italy[13]and the interbank risk exposure network in Mexico[14]show dynamic evolution characteristics.
In addition,some scholars have begun studying the multilayer relevance among banks.For example,Langfield et al.[15]constructed the bank’s risk exposure network and capital network,and they found that the risk exposure network has a more pronounced core edge structure than the capital network.In Mexico,Poledna et al.[16]built a four-layered banking network comprised of interbank deposits and loans,securities cross-holdings,derivatives,and foreign exchange relations.They found that the degree distribution of these four-layer networks has a thick power-law tail,and the correlation between different network layers is distinct.Meanwhile,Bargigli et al.[17]built a multilayer network of Italian banks based on interbank guarantee relationships and different maturity dates.They discovered that medium-sized banks were occasionally at the core,whereas large banks were always at the core.Aldasoro and Alves[18]evaluated interbank assets and liabilities and built a multilayer network of European banks with varying maturities.They found distinct core-periphery structures between different layers.Moreover,Berndsen et al.[19]constructed a three-layer network based on the financial payment relationship between Colombia’s sovereign bond,foreign exchange,and interbank markets.The average path length of these networks was found to be short,whereas the aggregation coefficient was large scale.Hüser et al.[20]constructed a multilayer bond cross-holding network based on the debt types and debt grades of European banks.They showed that the multilayer aggregation network has a high degree of aggregation.
The aforementioned research focuses primarily on the direct relationship between the banking system’s single-layer network and the multilayer network.In fact,direct correlations exist among financial institutions.However,many indirect correlations,such as common asset correlations and yield volatility correlations,also exist.Li et al.[21]built an interbank common loan network based on the banks-enterprise loan relationship.They determined that the co-loan network always shows a core-peripheral structure and a small-world property with a nine-year lifespan.The multiple constructed from financial data by Musmeci et al.[22]reveals significant changes in the network’s internal multiplex properties that are associated with periods of financial stress.
Considering that studies on the indirect correlation between banks are scarce,this present paper aims to analyze in depth the micro-dependency structure of the indirect multilayer correlation between banks from the perspective of different yield fluctuation correlations.Accordingly,this study focuses primarily on the three correlations of bank return volatility: Pearson correlation[23],Spearman correlation[24],and Kendall correlation[25].The micro basis of complex multilayer bank correlations is deconstructed by analyzing the dependency structure between the different correlations of bank yield fluctuations.Compared with existing research,this study contributes to the existing literature in the following ways.First,a method for constructing the bank multilayer network model is proposed.Second,it investigates the structural features and evolutionary characteristics of the bank multilayer network.Third,this article reveals the inherent relationship between multilayer correlations between banks and stock market prices.
1 Model
This study develops a multilayer network model for banks using bank stocks as nodes and the correlation of returns between stocks as edges.Among them,three kinds of correlations between stocks are mainly considered,namely,the Pearson,Spearman,and Kendall correlations,which are represented by the Pearson,Spearman,and Kendall correlation coefficients,respectively.
1.1 Correlation calculation
1.1.1 Pearson correlation

(1)

1.1.2 Spearman correlation

(2)

1.1.3 Kendall correlation

(3)
1.2 Multilayer network construction

At the same time,the concept of “distance” is introduced.At timet,the distance matrixd=[di,j(k)]and the weight matrixw=[wi,j(k)]of the distance between stockiand stockjin thek-th correlation network are shown in the following equations.
(4)
wi,j(k)=edi,j(k)
(5)

Based on the preceding calculation process,this paper constructs the aforementioned three network layers.Notably,we are constructing a fully interconnected network,so network edges are inevitable.In addition,this article constructs a weighted network,so the degree of nodes is not an integer.The weight matrix corresponds to the weights of the network’s edges.The banking multilayer network model has been constructed thus far.
2 Empirical Analysis
2.1 Data
We initially selected 37 banking stocks based on the Wind database.In addition,we eliminated 16 stocks suspended for less than 30 consecutive trading days and whose daily log return is not zero for 30 consecutive trading days.Therefore,we collected 16 stocks of Chinese listed banks in 2 432 trading days from January 1,2011 to December 31,2020.Using forward weighting,we processed all stocks’ daily closing price data.Following the initial data processing,we can obtain the daily log-return data for 16 stocks for a total of 2 431 trading days.In this study,the time windowEis 1 month,the network intervalδis 1 month,and there are 120 total stock correlation networks.We divide the 16 stocks into three categories based on the Wind database’s bank classification standard: large state-owned banks,national joint-stock banks,and regional banks.
2.2 Node degree of multilayer network

(6)
Tab.1 measures the node degree of the bank multilayer network and its sub-networks in the Chinese interbank market’s 120th stock correlation network.As shown in Tab.1,the mean value and volatility of the Pearson layer network are high,whereas those of the Kendall layer network are low.This indicates that the Pearson layer network shows a better degree of correlation.

Tab.1 Node degree of banking multilayer network
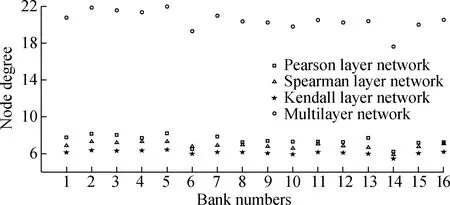
To better describe the internal characteristics of the bank multilayer network,we show in Fig.1 the node degree distribution of the bank multilayer network in the 120th stock correlation network,where the abscissa and the ordinate represent the bank number and the node degree,respectively.Among them,numbers 1-5 represent large state-owned banks,6-13 represent national joint-stock banks,and 14-16 represent regional banks.The large state-owned banks have relatively high node degrees of the banking multilayer network,whereas the national joint-stock banks and regional banks have relatively low node degrees.It also indicates that large state-owned banks have a greater level of banking system activity.

Fig.1 Node degree distribution of banking multilayer network
2.3 Degree correlation of multilayer network
The degree correlation of the bank multilayer network is a crucial indicator for characterizing the relationships between various network layers.Specifically,the degree correlation of the bank multilayer network describes the correlation strength between different layers in the multilayer network.The higher the interlayer correlation value,the stronger the positive correlation between the two layers.Referring to the research of Battiston et al.[27],we expressed the degree correlation of the multilayer networkWas follows:
(7)
Fig.2 depicts the 120-period evolution of the degree correlation of the bank’s multilayer network over time.It primarily illustrates the correlation between the degree of any two of the three network layers (i.e.,the Pearson,Spearman,and Kendall layer networks).As shown in Fig.2,the interlayer degree correlation of multilayer networks shows volatility.The mean value of the Pearson-Spearman interlayer degree correlation curves is 0.848 1,most of which are above 0.5.Meanwhile,the mean value of the Pearson-Kendall interlayer degree correlation curves is 0.853 9,most of which are above 0.5.Moreover,the mean value of the Spearman-Kendall interlayer degree correlation curve is 0.996 1,and most are above 0.95.

(a)
This indicates that the overall correlation between the three-layer networks is positive,and the interlayer degree correlation between the Spearman and Kendall layer is higher.This could be due to the fact that both correlation indicators are rank correlations.In addition,the interlayer correlation of the multilayer network between banks presents a degree of volatility; in June 2014,in particular,the interlayer correlation showed a significant decline,indicating that market conditions may have a notable impact on it.Similarly,Poledna et al.[16]constructed a multilayer financial network in Mexico and found that the interlayer degree correlation demonstrates a certain degree of volatility.The bank multilayer network structure constructed in the present paper replicates this characteristic of actual financial networks,thereby validating the model’s rationality.
2.4 Clustering coefficient of multilayer network
The clustering coefficient of a multilayer network is used to describe the proximity of clustering among nodes in a multilayer network.In particular,it is used to describe the degree of interconnection between neighboring nodes of any node in a multilayer network.The aggregation of multilayer networks should consider not only the aggregation of intralayer connections but also the aggregation of interlayer connections,which have a greater apparent multilayer complexity than single-layer networks.

(8)
The clustering coefficient of nodeiin the multilayer networkWis expressed as:
(9)
Further,the clustering coefficient of the entire multilayer network can be defined as the average value of all nodes.
Fig.3 depicts the evolution curve of the multilayer network’s clustering coefficient from 2011 to 2020.As shown in Fig.3,the mean value of the clustering coefficient throughout the entire evolution process is 10.255 2 and fluctuates in the range of 5-20.The average clustering coefficient of the random network at the same scale is 1.463 8,which explains why the banking multilayer network constructed in this study has a high clustering coefficient.This demonstrates that the whole multilayer network of the banking system has maintained a high level of aggregation throughout its evolution.It also shows the close relationship between bank businesses.

Fig.3 Clustering coefficient of banking multilayer network
2.5 Average path length of multilayer network
The average path length of the bank-firm multilayer network represents the distance between any two nodes in the bank-firm system.Referring to Boccaletti et al.[26],we expressed the average path length of a multilayer networkWas
(10)
whereNdenotes the number of nodes in the network,andduvis the shortest path connectinguandv.
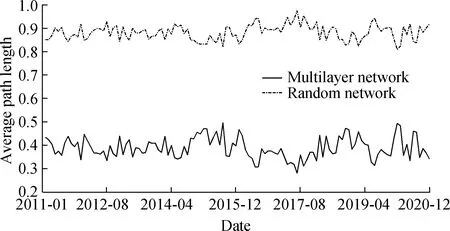
Fig.4 illustrates the evolution curve of the multilayer network’s average path length from 2011 to 2020.It also demonstrates that the mean path length throughout the entire evolution process is only 0.388 6.Moreover,the distance between any two nodes in the entire 16-node banking system is approximately 0.4.Meanwhile,the average path length fluctuates smoothly between 0.25 and 0.5.The average path length of random networks of the same size is 0.882 2,indicating that the average path length of the banking multilayer network constructed in this paper is short.In a similar vein,Berndsen et al.[19]found that the average path length of the multilayer network is minimal in an empirical study of the Colombia multilayer fi-nancial network.Based on the clustering coefficient and average path length,the banking multilayer network constructed in this paper appears to exhibit small-world characteristics.

Fig.4 Average path length of banking multilayer network
2.6 Participation coefficient of multilayer network
The participation coefficient of the bank multilayer network can be used to describe the participation degree of bank nodes in each layer network.Referring to the research of Battiston et al.[28],we express the multilayer participation coefficientPiof the multilayer networkWin the following equation.
(11)
Moreover,the participation coefficient of the whole multilayer networkWis the average value of all nodes’ multilayer participation coefficient.
Fig.5 illustrates the multilayer participation coefficient of the banking multilayer network node in the 120th month.The abscissa and ordinate represent the bank numbers and the nodes’ multilayer participation coefficient,respectively.In addition,numbers 1-5,6-13,and 14-16 denote large state-owned banks,national joint-stock banks,and regional banks,respectively.According to statistical analysis,all bank nodes’ average multilevel participation coefficient is 0.997,and they are all above 0.994.Fig.5 demonstrates that each bank node in the banking multilayer network has a higher multilayer participation coefficient.This indicates that all bank nodes have increased activity across all layers in the banking multilayer network.

Fig.5 Participation coefficient of nodes in banking multilayer network
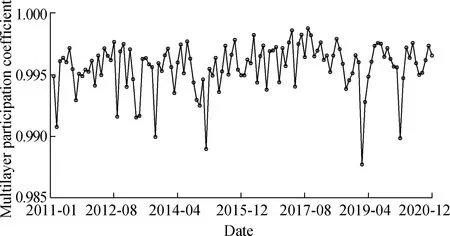
To further characterize the activity of the banking multilayer network throughout the entire evolution process,we show in Fig.6 the evolution curve of the bank multilayer network’s participation coefficient from 2011 to 2020.Fig.6 depicts the average value of all bank nodes for the multilayer network participation coefficient of the banking system.It also indicates that the average multilayer participation coefficient in the evolution of the entire banking system is significantly greater than 0.985.This demonstrates that all bank nodes have the potential to influence all layers in the multilayer network.

Fig.6 Participation coefficient of banking multilayer network
3 Conclusions
1) The correlation between large state-owned banks is high,whereas that between regional banks is low.The Pearson layer network demonstrates a greater correlation.In banking multilayer networks,the large state-owned banks have relatively high node degrees,whereas the national joint-stock banks and regional banks have relatively low node degrees.This indicates that the large state-owned banks are more active within the banking system.
2) The interlayer correlation of the multilayer banking network exhibits a degree of volatility.A higher interlayer degree correlation exists between the Spearman and Kendall layers.This study presents a multilayer banking network with a high clustering coefficient and a short average path length,exhibiting apparent small-world characteristics.All bank nodes in the bank multilayer network exhibit a higher multilayer participation coefficient,indicating that all bank nodes have the potential to influence all network layers.
3) From the perspective of multilayer network theory,this study investigates in depth the evolution characteristics of the multilayer relevance of banking system.For deconstructing the interbank dependency structure between linear and nonlinear correlations,this study is of great reference value.This paper’s findings not only advance the research of multilayer network theory in the banking system but also have practical implications for preserving interbank market stability.
 Journal of Southeast University(English Edition)2023年3期
- Journal of Southeast University(English Edition)的其它文章
- Vibration analysis of circular Janus MoSSe plates
- Effect of market integration on green economic growth: Evidence from 30 Chinese provinces
- Experimental study on the static load performance of steel-concrete composite external joints after fatigue loading
- Database-based error analysis of calculation methods for shear capacity of FRP-reinforced concrete beams without web reinforcement
- Improved complex modal superposition method with inclusion of overdamped modes
- Influence of consumer information investment on supply chain advertising and pricing strategies
