Experimental study on the static load performance of steel-concrete composite external joints after fatigue loading
Tan Yingliang Zhu Bing Cui Shengai
(School of Civil Engineering,Southwest Jiaotong University,Chengdu 610031,China)
Abstract:To study the effect of fatigue loading on the static performance of the external joint of the steel truss web-concrete composite (STWCC) structure,three joint models were designed and constructed with a scale ratio of 1∶3.The failure mode and load-displacement curve of the joint were obtained through static load testing and post-fatigue static load testing.The load-strain curve of the gusset plate was plotted.The changes in mechanical performance indexes,such as the yield load,ultimate load,rigidity,and ductility coefficient of the joint,were comprehensively analyzed.The results showed that the gusset plate was the key load-bearing component of the STWCC joint,and gusset plate failure was the typical failure mode of the external joint.Although fatigue load had a minor impact on the mechanical performance of the joint before yielding,it exerted a remarkable impact post yielding.Compared with the specimen subjected to only static loading,the specimen without fatigue failure exhibited a 4% lower ultimate bearing capacity and a 28% lower ductility coefficient,while the specimen with fatigue failure exhibited a 25% lower ultimate bearing capacity and a 52% lower ductility coefficient.Fatigue cracks induced stress redistribution in the gusset plate and increased the strain in the regions without fatigue cracks.The strain increase rate decreased with increasing distance from the fatigue cracks.
Key words:steel truss web-concrete composite structure; composite external joints; model test; static load after fatigue; mechanical performance
The steel-concrete composite structure,combining the advantages of both steel and concrete,has been widely implemented in recent years[1-4].The steel truss web-concrete composite (STWCC) bridge is a novel architectural structure that has emerged in the past few years.It consists of top and bottom concrete slabs,steel truss webs,and prestressed steel bundles.In this bridge design,steel truss webs replace the webs of concrete box girders,thereby circumventing the issues caused by concrete web cracking.This design improves structural permeability,reduces structural self-weight,increases bridge span,and reduces substructure size.Owing to these advantages,the STWCC structure has been widely implemented in bridge engineering,with examples including the Arbois Bridge,Bras de la Plaine Bridge,Shinchun Bridge,and Kinokawa Bridge[5-6].However,this structure is still in its early stages in China.The mechanical performance of the joint is crucial for the safety and durability of the entire structure[7-10].The STWCC joint connects the steel truss web with the top and bottom concrete slabs,playing a key role in force transmission and serving as one of the critical components of composite truss bridges.
The STWCC joint can be classified into two types: the embedded joint and external joint.In the former type,the steel truss webs are directly embedded into the concrete chord members.In the latter type,the steel truss webs are connected to the chord members through gusset plates.Extensive research has been conducted on the mechanical performance of the STWCC joint.Furuichi et al.[11]conducted an experimental study on an embedded steel box joint to investigate its load-bearing capacity and failure mode.This type of joint was utilized in the first STWCC bridge in Japan,known as the Kinokawa Bridge.Jung et al.[10]performed static load testing on various embedded joints and observed that all joints lost their load-bearing capacity due to concrete damage.Xue et al.[12]conducted static load testing on the truss joint with encased concrete to examine the load-bearing ratio between the steel truss and encased concrete.Duan et al.[13]developed a PBL-tubular joint and conducted static load testing,revealing that the joint ultimately failed due to concrete shear damage in the intersection zone of the steel tubes.Zhou et al.[14]conducted static load testing on an embedded joint,which eventually lost its load-bearing capacity owing to severe chord cracking and compression buckling of the steel truss webs.Yin et al.[15]compared the static performances of embedded and external joints,revealing that the chord members of embedded joints exhibited earlier cracking than those of external joints.In summary,premature chord cracking poses challenges to the structural safety and durability of bridges.Zhou et al.[16]conducted 1∶3 scale static load testing on external joints,which resulted in joint failure owing to compression buckling of the gusset plate.By strengthening the gusset plate,the failure mode of the joints shifted to the gusset plate tensile fracture.Zhou et al.[17]also conducted numerical simulations and theoretical analysis of the rotational stiffness of external joints,proposing a formula for calculating their initial rotational stiffness.Tan et al.[18]performed 1∶2 scale tests on external joints to validate their excellent load-bearing capacity and to investigate the strain distribution across each component.He et al.[19]and Shao et al.[20]conducted scale tests on the external joints of a steel truss web-ultrahigh-performance concrete structure to verify the feasibility of applying external joints to composite arch bridges.Jung et al.[5]and Liu et al.[21]conducted fatigue performance experiments on embedded joints but did not conduct post-fatigue static load tests.
These scholars have investigated various forms of STWCC joints and have achieved remarkable results.The studies primarily focused on embedded joints,with limited research on the fatigue performance and post-fatigue static loading performance of external joints.Therefore,in the present research,building upon Ref.[22],we conducted post-fatigue static load testing on the external joints of the first railway STWCC box girder bridge in China to investigate their static performance after fatigue loading.The study examined the failure mode,load-displacement relationship,ultimate bearing capacity,post-yield deformation capacity,and strain distribution across the gusset plate.This paper can serve as a reference for the design of external joints in STWCC bridges.
1 Experiment
1.1 Specimen design
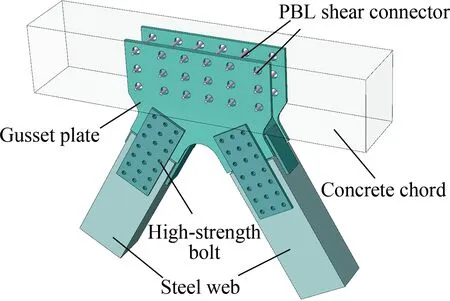
According to the overall design of the first double-track high-speed railway STWCC box girder bridge in China,as outlined in Ref.[23],the joint with the highest gusset plate stress amplitude was selected.Three identical external joint models (see Fig.1(a)),namely S1,F1,and F2,were designed and fabricated at a scale ratio of 1∶3.Following the principle of similitude,the concrete chord size for the scaled joint was 1764 mm×334 mm×367 mm (length×width×height); the gusset plate size was 776 mm×629 mm×16 mm (length×width×thickness); the steel web section size was 268×184 mm with a thickness of 20 mm; the longitudinal steel bar diameter was 12 mm,and the stirrup diameter was 8 mm.Additionally,18 holes with a diameter of 40 mm were precut on the gusset plate,and 14 mm diameter steel bars were inserted through the holes to serve as PBL shear connectors.The joint models are depicted in Figs.1(b) and (c).
(a)
1.2 Mechanical properties of raw materials
The materials used for the scaled models and the prototype were of the same grade.The steel structure,concrete chord member,and rebar grades were Q370qE,C50,and HRB400,respectively.The mechanical properties of the raw materials for concrete and rebar were measured in accordance with Chinese standards (GB/T 50081—2019[24]and GB/T 228.1—2010[25]),as shown in Tab.1.The mechanical properties of the Q370qE steel plates were measured by the commissioned steel structure manufacturer; the yield strengthfywas 452 MPa,the tensile strengthfuwas 583 MPa,and the elastic modulusEwas 206 GPa.

Tab.1 Material mechanical properties
1.3 Measurement-point layout and loading scheme
The layout of measurement points is illustrated in Figs.1(b) and (c).A laser displacement sensor was positioned at one end of the concrete chord to measure the joint displacement,while strain rosettes (B22 to B30) were placed on the gusset plate to monitor its strain.The loading scheme for the external joint models is depicted in Fig.2.Horizontal loads were applied to the concrete chord using a hydraulic jack or a mechanical testing and simulation (MTS) system anchored to the reaction wall.The steel truss web was connected to the steel base through axis pins,and the steel base was connected to the reaction floor using steel bolts.To investigate the static performance of the external joints after fatigue loading,Specimen S1 underwent only static load testing,while Specimens F1 and F2 were subjected to fatigue testing before static load testing.

(a)
1.3.1 Static load test
Prior to formal loading,preloading was conducted (maximum load of 1 600 kN) to eliminate assembly gaps and calibrate the loading equipment.Subsequently,a hydraulic jack with a maximum capacity of 6 300 kN was utilized for graded loading.The load increment for each grade was 400 (loadF<2 000 kN),200 (2 000 kN≤F≤3 000 kN),and 100 kN (F>3 000 kN).After each loading grade,the load was held for 5 min,and data were then collected.
1.3.2 Fatigue test
To determine the influence line of internal forces for the most critical joint,a finite element model of the entire bridge was developed.The internal force history curve of the joint under the China railway passenger transport standard live load was obtained.Through the rain flow method,the amplitude of internal forces and the corresponding number of loading cycles were determined.According to the Palmgren-Miner linear cumulative rule,the equivalent loading amplitude for 2 million cycles was calculated.The equivalent loading amplitude for the scaled joint was determined as 260 kN,and the corresponding design stress amplitude for the joint plate was 53.2 MPa,following the similarity principle.The MTS loading system was used for the fatigue tests.Prior to the formal fatigue test,12-grade preloading (maximum load of 600 kN) was conducted.Specimen F1 was subjected to fatigue loading for 2.5 million cycles at the designed stress amplitude of 53.2 MPa,with upper and lower loading limits of 40 and 300 kN,respectively.Specimen F2 was subjected to fatigue loading for 2.5 million cycles with a stress amplitude of 73.6 MPa (1.4 times the designed value) and upper and lower loading limits of 40 and 400 kN,respectively,at a loading frequency of 3.5 Hz.After every 5×10⁵cycles of loading,the loading was halted,and a static load test with a maximum load of 600 kN was conducted.Following the fatigue test,Specimens F1 and F2 were subjected to post-fatigue static load testing,following the loading scheme of Specimen S1.
2 Experimental Phenomena and Failure Mode
2.1 Static load test
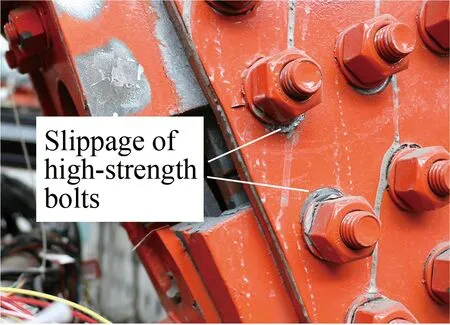
According to the findings from the static load testing of external joints[22],the failure process of Specimen S1 under static loading can be described.Initially,when the load was below 3 800 kN,Specimen S1 remained intact without any visible damage.As the load reached 3 800 kN,the gusset plate and the pressed steel truss web experienced compression,resulting in the peeling of paint from the surface of the gusset plate.At a load of 4 000 kN,a crack with a horizontal angle of 23° appeared in the middle of the B side of the chord.When the load reached 4 400 kN,the splice plate with hand holes on the pressed side buckled.A further increase in the load to 4 800 kN caused the high-strength bolts connecting the gusset plate and the splice plate to slip (see Fig.3(a)).Upon reaching a load of 5 200 kN,the chord cracks rapidly expanded,and the splice plate with hand holes exhibited tensile necking (see Fig.3(b)).Eventually,Specimen S1 was damaged owing to the tensile fracture of the gusset plate in tension (see Fig.3(c)).The joint failure mode is illustrated in Fig.3.
(a)
2.2 Fatigue test
During the fatigue test,Specimen F1 was subjected to 2.51 million cycles of loading with the designed stress amplitude,and it did not exhibit any fatigue failure.Specimen F2 was subjected to fatigue loading with a stress amplitude of 1.4 times the designed value.After 1.4 million cycles of loading,through-thickness cracks emerged in the junction area of gusset plate B near the loading end and the ribbed stiffener of the gusset plate.The fatigue loading continued until the number of cycles reached 2.51 million.The fatigue cracks in Specimen F2 did not propagate further,and no damage was observed in other members,such as the concrete chord and steel truss web.The details of the fatigue cracks of Specimen F2 are shown in Fig.4.The position of the fatigue cracks in Specimen F2 coincided with the fracture location of the gusset plate in Specimen S1.The fatigue cracks occurred at the junction of the concrete chord and the steel gusset plate and the junction of the ribbed stiffener and the steel gusset plate.Moreover,the presence of high-strength bolt openings also contributed to the weakening of the gusset plate,turning the region where fatigue cracks occurred into a critical load-bearing part of the external joints in the STWCC structure.

Fig.4 Fatigue crack details of Specimen F2
2.3 Post-fatigue static load test
Post-fatigue static load testing was conducted on Specimens F1 and F2 following the loading scheme of Specimen S1.When the load was below 4 000 kN,Specimen F1 showed no significant damage.As the load reached 4 000 kN,cracks appeared on the B side of the chord,and these cracks expanded as the load increased.At 4 500 kN,cracks emerged on the A side of the chord,and the splice plates with hand holes exhibited necking and warping on the tension and compression sides,respectively.When the load reached 5 000 kN,the chord cracks intensified,the high-strength bolts experienced noticeable slippage,the gusset plate underwent significant deformation,and necking occurred in the gusset plate on the tension side.We tried to further increase the load but failed to stabilize the load.Considering that Specimen F1 could not withstand a larger load,its ultimate bearing capacity was 5 000 kN.The static failure mode of F1 resembled that of Specimen S1,with lower damage levels observed in each component.The failure mode of Specimen F1 is depicted in Fig.5(a).

(a)
When the load was below 3 600 kN,Specimen F2 did not exhibit any noticeable damage.However,once the load reached 3 600 kN,the fatigue cracks on gusset plate B began to expand.At 3 900 kN,the high-strength bolts displayed significant slippage,the fatigue crack width further increased,and dislocation appeared along the loading direction.Eventually,the fatigue crack width reached 4 mm,with a dislocation of 3 mm along the loading direction.As the cracks of Specimen F2 gusset plate were too wide,there was a risk of sudden collapse.Therefore,for safety reasons,no higher external loads were applied,and the ultimate bearing capacity of Specimen F2 was determined to be 3 900 kN.The failure mode of Specimen F2 is depicted in Fig.5(b).
3 Experimental Results and Discussion
3.1 Load-displacement curve
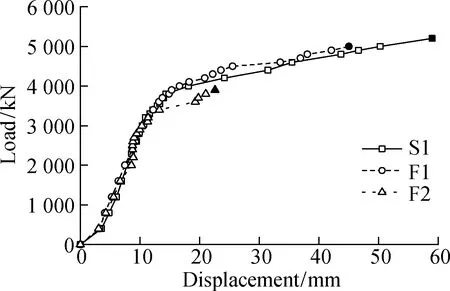
The load-displacement curves of Specimens S1,F1,and F2 are presented in Fig.6(a).The failure process of the external joints in the STWCC structure under static loading can be divided into four stages (see Fig.6(b)).Taking the failure process of Specimen S1 as an example,the four stages are as follows: 1) Gap elimination stage.In this stage,despite the preloading conducted before the static load testing,there existed an assembly gap.Consequently,the slope of the load-displacement curve in this stage was smaller than those in the subsequent stages.The load increment in this stage was 400 kN,and the corresponding displacement ranged from 0 to 3.54 mm.2) Elastic stage.In this stage,the joint displacement increased linearly with the load.The load increment was 2 800 kN,and the corresponding displacement ranged from 3.54 to 10.90 mm.3) Elastic-plastic stage.In this stage,the displacement exhibited nonlinear growth with the load,and the displacement rate increased.The load increment was 600 kN,and the corresponding displacement ranged from 10.90 to 14.36 mm.4) Plastic stage.In this stage,the displacement increased rapidly,and the slope of the load-displacement curve decreased.The load increment was 1 400 kN,and the corresponding displacement ranged from 14.36 to 59.01 mm.
(a)
Fig.6 demonstrates that the load-displacement curves of Specimens S1,F1,and F2 initially overlapped,particularly during the elastic stage.However,discrepancies emerged in the later stages of loading,particularly after entering the plastic stage.When the load was below 3 200 kN,the disparities in the load-displacement curves were minimal.Once the load surpassed 3 200 kN,the displacement of Specimen F2 increased rapidly.At a load of 3 600 kN,the displacements of Specimens F1 and F2 were 99% and 145% of that of Specimen S1,respectively.The differences in the load-displacement curves between Specimens F1 and S1 became prominent after the load exceeded 3 800 kN.At a load of 4 200 kN,the ratio of the displacement of Specimen F1 to that of Specimen S1 was 69%.Furthermore,under loading conditions exceeding 3 800 kN,the displacement of Specimen F1 remained consistently smaller than that of Specimen S1 at all load levels.The displacement values of the specimens under different loads are presented in Tab.2.

Tab.2 Displacement of the specimens
3.2 Static performance indexes
Tab.3 demonstrates the static performance indexes of the three specimens,including yield loadNy,ultimate loadNu,joint stiffnessK,ductility coefficientμ,and displacementD.Neis the load borne by the joint in the elastic stage,and the corresponding displacement isDe;Nyis the yield load determined by the farthest point method[26],and the corresponding displacement is the yield displacementDy;Nuis the ultimate load,and the corresponding displacement is the ultimate displacementDu;Kis the initial stiffness used to evaluate the elastic deformation resistance of joints,which can be regarded as the slope of the load-displacement curve in the elastic stage; for Specimen S1,K=Ne/De=(3 200-400)/(10.90-3.54)=380.43 kN/mm;μis the ductility coefficient used to evaluate the deformation capacity of the joint after yielding,μ=Du/Dy.As shown in Tab.3,Specimen F1 exhibited a 3% increase in yield load and a 5% decrease in initial stiffness compared with Specimen S1.Specimen F2 experienced an 11% reduction in yield load and an 8% decrease in joint stiffness compared with Specimen S1.When the joints reached the yield point,Specimen F1 demonstrated a 4% decrease in ultimate load and a 28% decrease in ductility coefficient compared with Specimen S1.Similarly,Specimen F2 exhibited a 25% decrease in ultimate load and a 52% decrease in the ductility coefficient compared with Specimen S1.These results indicate that fatigue loading had a more pronounced impact on the post-yield static performance of the external joints than on the pre-yield static performance.The fatigue-induced cracking of the gusset plate significantly reduced the ultimate bearing capacity and deformation capacity of Specimen F2 after yielding.In summary,fatigue loading has a relatively smaller effect on the pre-yield static performance of the composite external joints but exerts a more significant influence on the post-yield static performance.

Tab.3 Static performance indexes of the specimens
3.3 Load-strain curves of gusset plate
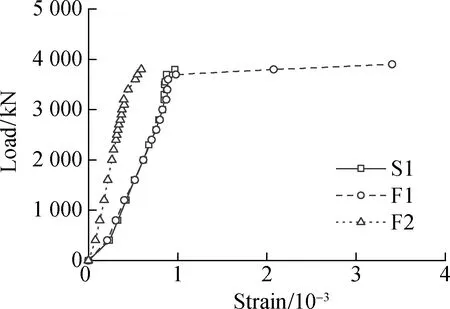
Fig.7 illustrates the load-strain curves of the gusset plates for Specimens S1,F1,and F2.Only the results with strains below 3.5×10⁻³are presented,as the strains of the gusset plates exceeded the ultimate strength of the steel in the later stages of loading.As shown in Fig.7,the load-strain curves of Specimen F1 and S1 gusset plates essentially overlapped,and the displacement growth trends were similar; however,a clear difference between the strain of Specimens F2 and S1 suggested that the post-fatigue static performance of external joints of the STWCC structure without fatigue damage did not undergo an extensive change compared with that of the joints not subjected to fatigue loading.The strain of B22 in Specimen F2 was less than that of B22 in Specimen S1 (see Fig.7(a)).Conversely,the strain of B23 and B26 in Specimen F2 was greater than that of B23 and B26 in Specimen S1 (see Figs.7(b) and (c)).The strain values of measurement points B24 to B27 exhibited a similar pattern to that of B23.Fig.7(d) presents the strain distribution of measurement points B22 to B27 for Specimens S1 and F2 at different load levels: 800,2 000,and 2 800 kN.At a load of 2 000 kN,the strain values at measurement points B22 to B27 in Specimen F2 exhibited an increase of-58%,57%,24%,20%,19%,and 20%,respectively,compared with the corresponding measurement points in Specimen S1.This indicates that stress redistribution occurred and that the load that should have been borne by the area experiencing fatigue cracks was transferred to other areas of the gusset plate.Furthermore,the growth of strain from B23 to B27 gradually slowed down,suggesting a diminishing influence of fatigue cracks on the strain distribution of the gusset plate with increasing distance from the fatigue cracks.At loads of 800 and 2 800 kN,the strain distribution of the gusset plate for Specimen F2 exhibited a similar pattern to that observed at 2 000 kN.
(a)
4 Conclusions
1) Gusset plate failure occurred in static load tests,fatigue tests,and post-fatigue static load tests,and the failure of the gusset plate remarkably impacted its mechanical performance.The gusset plate was the key load-bearing component of the external joints.
2) The failure process of the joints under static loading comprised four stages: the gap elimination stage,elastic stage,elastic-plastic stage,and plastic stage.Fatigue loading had a more pronounced effect on the post-yield load-displacement relationship than on the pre-yield load-displacement relationship.
3) The mechanical performance of the joints after yielding was considerably influenced by the fatigue load.Fatigue loading resulted in a degradation of the ultimate bearing capacity and a reduction in the ductility coefficient to varying degrees.The static performance of the joints with fatigue failure in the fatigue tests was more substantially impacted by the fatigue load.Compared with the joint subjected to only static loading,the joints without fatigue failure exhibited a 4% lower ultimate bearing capacity and a 28% lower ductility coefficient,whereas the joints with fatigue failure exhibited a 25% lower ultimate load capacity and a 52% lower ductility coefficient.
4) Fatigue cracks in the gusset plate caused stress redistribution within the joint.This led to an increase in strain in other areas of the gusset plate,and the growth of strain slowed down as the distance from the fatigue cracks increased.
 Journal of Southeast University(English Edition)2023年3期
- Journal of Southeast University(English Edition)的其它文章
- Vibration analysis of circular Janus MoSSe plates
- Effect of market integration on green economic growth: Evidence from 30 Chinese provinces
- Database-based error analysis of calculation methods for shear capacity of FRP-reinforced concrete beams without web reinforcement
- Improved complex modal superposition method with inclusion of overdamped modes
- A multilayer network model of the banking system and its evolution
- Influence of consumer information investment on supply chain advertising and pricing strategies
