Directional-to-random transition of cell cluster migration
Yang Zeng(曾阳), Bingchen Che(车丙晨), Dan Sun(孙聃), Ce Zhang(张策), and Guangyin Jing(经光银)
1State Key Laboratory of Photon-Technology in Western China Energy,Institute of Photonics and Photon-Technology,Northwest University,Xi’an 710127,China
2School of Physics,Northwest University,Xi’an 710127,China
Keywords: cell migration,random walk,active wetting,cell cluster
1.Introduction
The migratory behavior of cells plays a critical role in various biological processes, including organ development,wound healing,and tumor metastasis.[1–6]Traditionally,studies on cell migration have primarily focused on understanding the regulatory mechanisms driven by chemical signals.[7–13]However, recent research has shed light on the cooperative role of physical cues present in the cellular environment in conjunction with chemical signals.[14–18]For instance,cells can perceive and migrate along gradients of substrate stiffness,[14]exhibiting collective movement through physical interactions,[15,16]and undergoing polarization within microconfinement.[17,18]Despite these advancements,the regulatory effects of crowding,which is a dominant environmental factor in tissues,remain relatively unexplored.
In this study, we aim to bridge this knowledge gap by utilizing a microfluidic chip for the cultivation and real-time monitoring of 3T3 fibroblast clusters with varying densities using live cell microscopy.Our observations reveal dynamic migratory behavior in response to changes in the environmental conditions,particularly crowding.Initially,cells at the periphery demonstrate directed movement;however,this collective behavior diminishes over time.We investigate the transition from directional to random movement by taking into account the influence of both cell density(i.e.,crowding)and the total number of cells.To further understand the contribution of physical effects, such as entropy, we employ the Langevin dynamics model,[19,20]commonly used for passive particles,to simulate the migratory behavior of cell clusters.
Our findings provide compelling evidence that the disassembly of cell clusters, resulting in the transition from directional to random movement,exhibits similarities to the behavior of passive particles.Of particular note,we identify crowding, represented by the effective particle diameter, as a critical factor in this transition.By investigating the influence of crowding and physical characteristics on the regulation of migratory behavior,our study contributes to a more comprehensive understanding of cell migration in complex environments.
2.Result
2.1.Monitoring the migratory behavior of collective cells
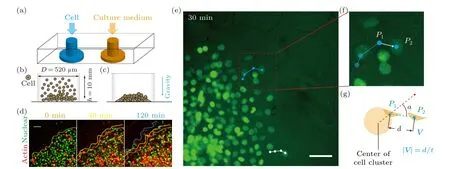
To investigate cell migration in a crowded environment,we devise and construct a microfluidic chip that enables realtime observation of the migratory behavior of cell clusters(Figs.1(a)and S1(a)).The microfluidic chip is designed with dimensions comparable to a 96-well plate and contains 90 individual culture chambers, making it suitable for potential applications in high-throughput drug screening tests.Each chamber is connected to two inlets: one for cell loading and the other for supplying cell culture medium (Fig.1(a)).The diffusion of nutrients within the microfluidic chip ensures that the cell clusters are not affected by shear flow.Cells are introduced into the microfluidic chip through the punched inlets,which have a cylindrical structure with an approximate diameter of 520 µm (Figs.1(b) and 1(c)).The seeding density of cells can be adjusted by varying the number of cells, allowing for different substrate coverage ranging from 80%(monolayer)to 200%(>2 cell layers)(Fig.S2)).
Via live cell imaging, we monitor the movement of cell clusters in real-time (Figs.1(d)–1(g) and Movie S1)).Cells are tracked by customized Matlab programs.When the cell seeding density exceeds 100% (i.e., the substrate is covered with more than one layer of cells),we only track the cells that are adherent to the substrate and in the peripheral region of the cell colony(Movie S1)),as only these cells display motility.Also, it should be noted that, the peripheral cells are less crowded even at high seeding densities (Fig.1(e)), such that they can be unambiguously tracked.Our results demonstrate that within the first 2 hours of incubation on-chip, collective cells (i.e., the ones in the peripheral region) move coordinatively in the radial direction, showing distinctive migratory behavior (i.e., moving speed and direction) from cells in the central region.

Fig.1.Experimental set-up of microfluidic chip for monitoring the migratory behavior of collective cells in real-time.(a)–(c)Schematic shows that the microfluidic chip contains two inlets,one for cell loading and the other one allowing fresh culture medium to diffuse to the cellular environment.It is demonstrated that cells are loaded into the well-plate,with diameter D being 520µm and height h being 10 mm,and pulled down to the bottom by gravity.(d)–(f)The microfluidic chip is placed on a live cell culture system,in which the migratory behavior of 3T3 fibroblasts can be monitored in real-time.(d)The morphology of the cell cluster is marked and color coded according to the culture time.(e)–(g)Trajectories of individual cells demonstrate that collective cells in the peripheral region move in the radial direction.Scale bars denote 50µm in all figures.
2.2.Velocity distribution in the cell cluster
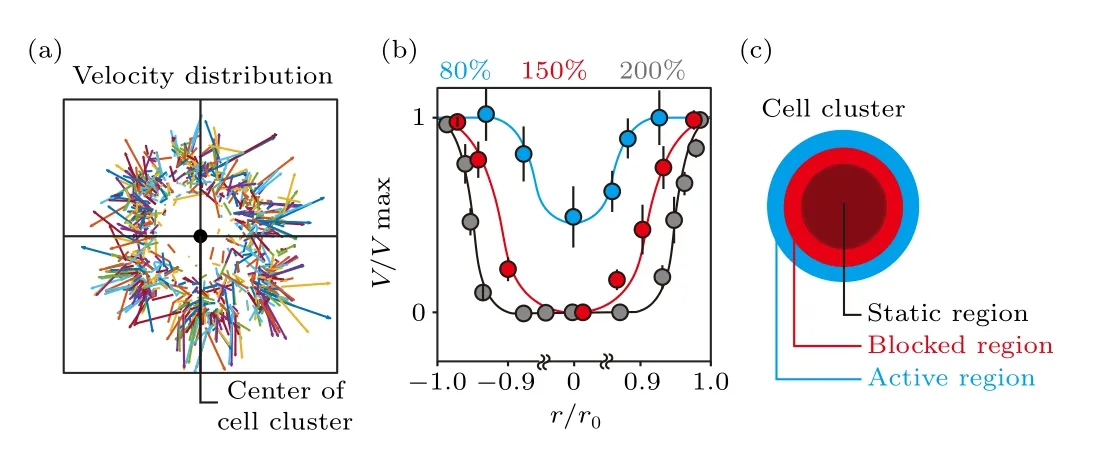
The velocity vector field of collective cells in the cluster at the initial stage reveals that at 200%density,cells at the peripheral region move in the radial direction,and show considerably higher velocity as compared to the ones located in the central region(Fig.2(a)).Regardless of the seeding cell density and location of individual cells in the cluster, cells gain similar velocities once they start to move (Fig.S3).By analyzing the velocity distribution in over 20 cell clusters (cells loaded into one culture chamber defined as a cell cluster),whose size is normalized to their initial radius and velocity normalized to the maximum value (i.e.,r/r0, the peripheral region is reflected byr/r0=1 orr/r0=-1; andV/Vmax),we conclude that similar velocity distribution remains at different cell densities,i.e.,high at the edge and low in the center(Fig.2(b)).The differences lie in that even though cells in the central region remain static due to confined space, the static area expands with increasing cell density.When the substrate is not fully covered(i.e.,80%cell density),the randomly distributed free space makes it possible for cells located in the cluster center to start to move at the initial stage.Still, cells in the peripheral region possess the highest velocity.The cell cluster can,therefore,be divided into three regions with different motion states (Fig.2(c)).Being closest to the free space,cells in the peripheral region,i.e., the active region,show the highest velocity.The movement of cells at the edge creates free space for the polarization of followers.Therefore, cells located in the inner region move considerably slower as compared to the leading cells, i.e., in the blocked region.Buried deep inside the cluster, an overly crowded cellular environment leaves no space for the polarization and movement of individual cells,and thus forms the static region.

Fig.2.Distribution of cell migration velocity within the first 1 hour of collective cells disassembly.(a) At 200% seeding cell density, which means the stacking of 2 cell layers,the movement of individual fibroblasts is tracked within the first hour following cell loading.The velocity distribution(i.e.,vector)is plotted by connecting the starting and ending points of the trajectories,in which the length of the vectors represents velocity.(b)Velocity distribution of cell migration reveals that a portion of collective cells remain static only in the crowded cellular environment (i.e., 150% and 200%).(c) Schematic shows that cells are most active(high velocity)at the peripheral region of the cluster, i.e., the active region.The averaged velocity decreases gradually to zero untill reaching the center,i.e.,the blocked and static regions.
2.3.Transition from directional to random migration of collective cells
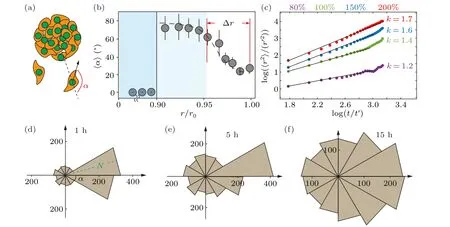
To characterize the movement direction of the cell cluster,we define a deviation angleα,which represents the angle difference between the migration direction of individual cells and the radial direction(Fig.3(a)).The deviation angleαranges from 0 toπ,representing the outwards and inwards movement along the radial direction, respectively.We observe that the deviation angle of the collective cells in cluster shows similar distribution as the velocity distribution, i.e.,∼80◦in the blocked region and∼20◦in the active region(Figs.2(c)and 3(b)).The deviation angle is defined as zero in the static region,where cells are motionless.When collective cells move in the radial direction,the averagedαis close to zero.In contrast,the random movement of collective cells leads to an averaged deviation angle of∼90◦.Therefore, it is reasonable to conclude that in the active region, where cells move fast,the migration is also directional (Figs.2(b) and 3(b)).It is conceivable that the directional migration resembles the superdiffusion of passive particles.While, the random cell movement is similar to the normal diffusion.Consistently, at high cell density(i.e.,200%),marginal cells(r/r0>0.95)migrate in the radial direction nearly following a relation as〈r2〉∼tk,and with scaling indexk>1,indicating a super diffusive migration process (Fig.3(c)).When the seeding cell density is low(i.e.,80%),the movement of the cell cluster is almost random,which is reflected by a considerably smallerk=1.2.
Notably, the distribution of deviation angle at the marginal region of 200%cell cluster changes over time.The number of cells moving along the radial direction decreases substantially, i.e., the temporal distribution reflects the dissipation of single cell migration within 15 hours of incubation on the chip (Fig.S4).In the meantime, collective cells undergo a transition from directed to random movement during unjamming from the cluster, i.e., from blocked region to active region.The final morphology of collective cells shows in Fig.S5.

Fig.3.The quantification for radial cell migration via the deviation angle.(a)Schematic shows that during cell unjamming from the colony,the deviation angle α defines if the cell moves along a relatively straight line or in a random manner.(b) It is observed that only at the peripheral region of the cell colony, which is r/r0 >0.95 of the colony radius, the deviation angle of cell migration is relatively small,showing radial movement.(c)The diffusion exponent of β in the outermost cells of different density clusters(i.e.,r/r0>0.95)indicates that the directed migration of cells depends on the degree of cell crowding r′=1µm and t′=1 s.(d)–(f)Distribution of leading cells’deviation angle during the unjamming process of cell colonies with 300% seeding cell density and 800 µm colony size, after being deposited in the well-plate for(d)1 hour,(e)5 hours and(f)15 hours.The green N value in the radial direction represents the number of cells in the range of the deviation angle.
2.4.Discussion and concluding remarks
In this study, we model the overly crowded cellular environmentin vivousing a stack of fibroblasts.Our results demonstrate that the capacities of collective cells migrating from one point(P)to another(P′)depend greatly on the seeding cell density, i.e., unjamming of individual cells from a cluster and transportation to a faraway location is more effective in a relatively crowded cell colony(Fig.S6).For example,single fibroblasts can migrate following a relatively straight line originating from a stack of cells, resulting in a considerably longer migration distance within a defined period of time,e.g.,∼30 µm for 100% cell density and∼15 µm for 80%.Although the crowded cellular environment is a physical factor reflecting merely the number of cells located within a unit area, it is worth noting that in a crowded environment, each cell fights for free space for adhesion,polarization and migration.We, therefore, suspect that the physical interactions instead of chemical communication among collective cells play an important role.
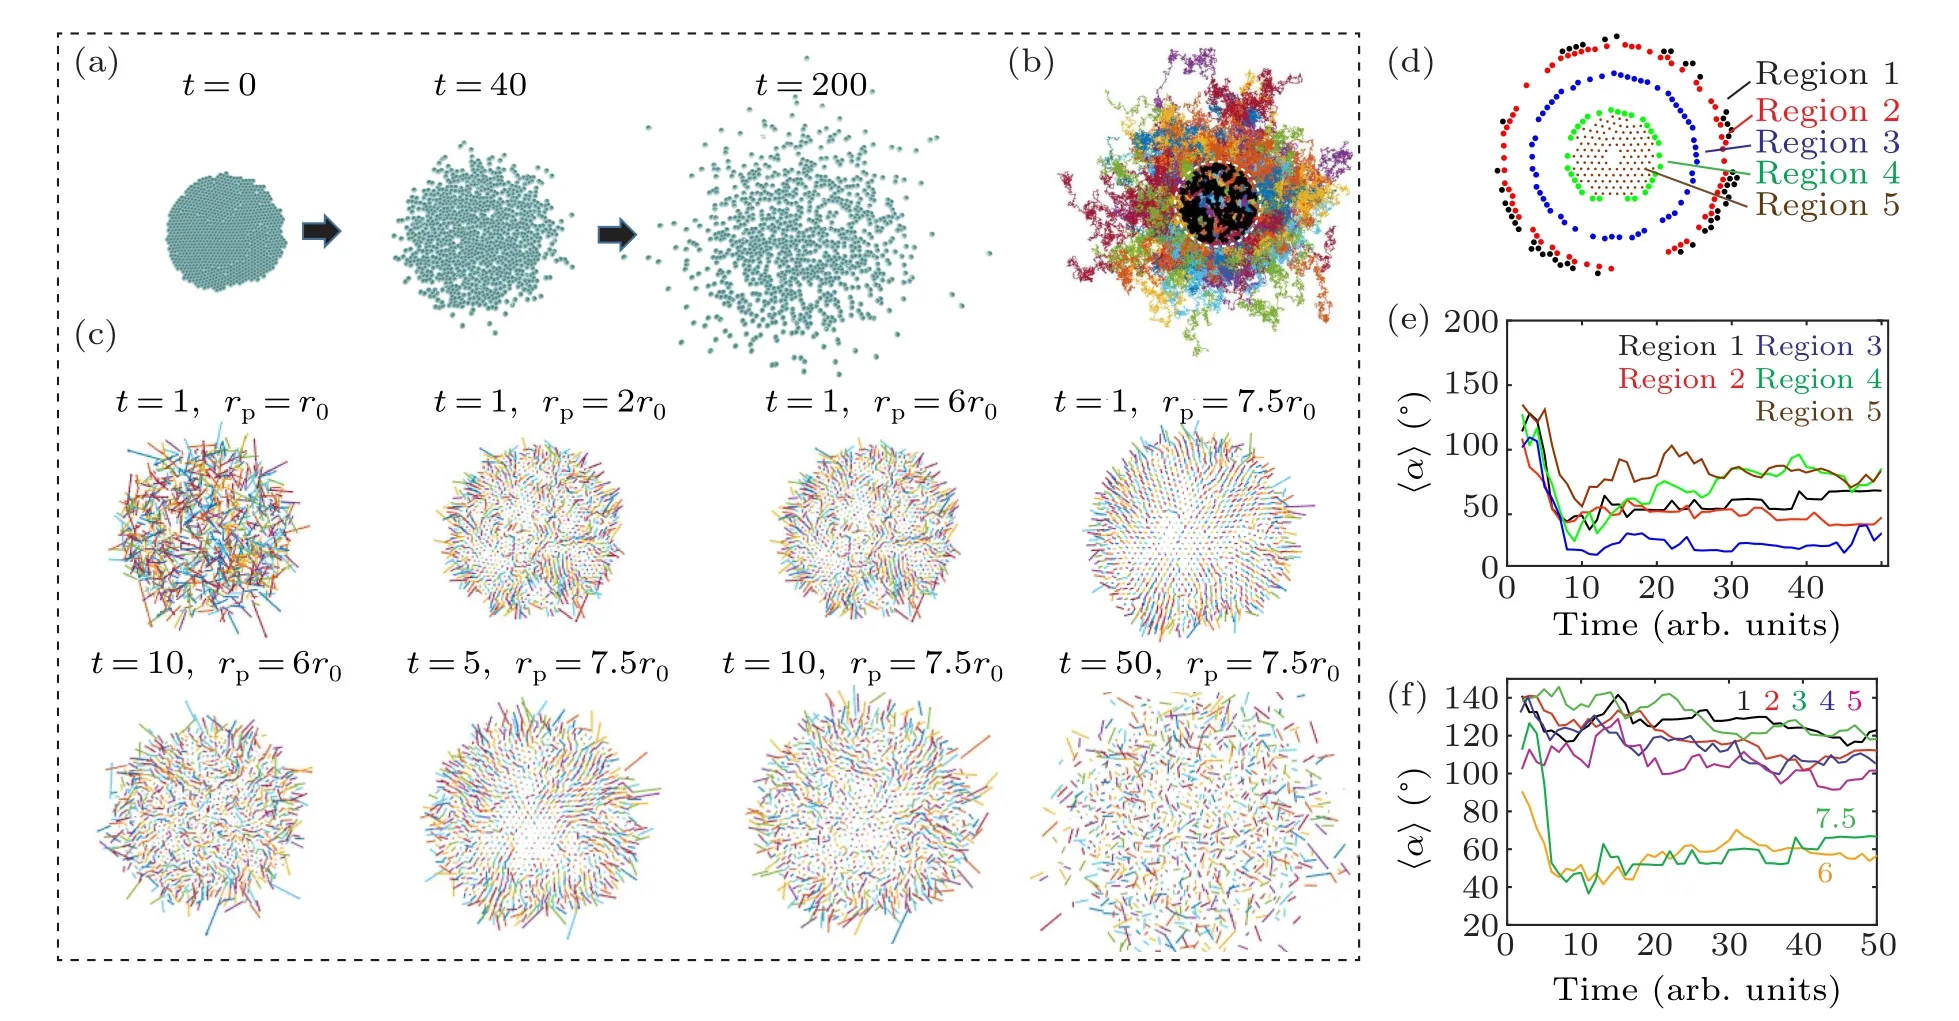
To verify the hypothesis,we model the diffusion of a collection of passive particles from a higher to a lower concentration using the Langevin dynamics simulation (Fig.4 and Movie S2).[21]By adjusting the distance between particler0and the effective particle sizerp,the crowded environment can be simulated,in which entropy drives these particles to move to the open space.For example,rp=7.5·r0represents an initial density of 750%.Similar to cell migration, radial movement of passive particles emerges only at the peripheral region of the cloud and high seeding density (Figs.4(a)–4(e)), indicating that entropic force (i.e., concentration gradient) plays a crucial role.[22,23]Moreover,the clear transition from directional to random migration is also observed in the cloud of particles at high density,which resembles the migration of cell clusters(Fig.4(f)).These results indicate that physical interactions among collective cells(i.e.,entropy)are the key factor regulating the migratory behavior of cell cluster.

Fig.4.Cell radial movement of collective cells resembles the migratory behavior of passive particles.(a)–(b)Langevin dynamics simulation reveals trajectories of individual passive particles.(c)Velocity vectors of individual particles reveal that in an overly crowded environment(i.e.,rp>r0),the radial moment emerges at the initial stage.The persistence of cell movement is proportional to the initial packing density.(d)–(e) Particles located in different regions of the colony show different migratory behavior,which is reflected by distinctive deviation angles.(f)The emergence of cell radial movement depends on the effective particle density,where the effective particle size rp is 1 times,2 times,3 times,4 times,5 times,6 times and 7.5 times of particle–particle distance r0.
Overall, our studies identify the physical properties of the cellular environment (i.e., crowding) and physical interactions among collective cells that play crucial roles in regulating the migratory behavior of cell clusters.These results present new challenges to the development of drug targeting at cancer metastasis, because unlike environmental chemical cues, which regulate biological processes via signaling cascades, the physical effects affecting the migration of collective cells may be insensitive to conventional therapeutic approaches.
3.Experimental materials and methods
3.1.Design and fabrication of the microfluidic chip
The microfluidic chip design was created using Auto-CAD (Autodesk Inc., San Rafael, CA, USA).The chip templates were subsequently generated through UV-lithography on SU-8 3025 photoresist (Microchem, Westborough, MA,USA) (Fig.S1(a)).To construct the chip, a mixture of 70 g of PDMS(10:1 monomer-to-catalyst ratio)was prepared, debubbled, and poured onto a patterned silicon wafer treated with trimethylchlorosilane.The PDMS was then cured by heating at 80◦C for 60 min.Inlets and outlets were created by punching holes before plasma bonding between different layers and sealing with glass slides.The complete chip was subsequently cured for a minimum of 24 h at 80◦C before utilization.
3.2.Cell cultures and loading
3T3 fibroblasts were transfected with H2B-GFP to enable cell tracking.[24,25]Cytoskeletal elements and specifically actin were visualized by staining the cells using the SiR-actin kit(Cytoskeleton,Inc.,US).Fibronectin was diluted with PBS to a concentration of 20 µg/ml, following a dilution ratio of 1:20, prior to treating the microfluidic chip for the adherent culture of fibroblasts.Specifically,before loading the cells,the fibronectin solution was injected into the cell culture chambers and incubated for 2 hours at 37◦C(Fig.S1(b)).Subsequently,the microfluidic chip was thoroughly rinsed with a PBS solution (Fig.S1(b)).During the experiment, the conditions for cell culture were maintained using a temperature control and incubator system (OKOLab, NA, Italy) to ensure a constant temperature of 37◦C,humidity above 98%,and 5%CO2.The PDMS chip was covered with a stage top incubator connected to a humidifier and a gas exchanger.
3.3.Live-cell fluorescence microscopy and data analysis
Image acquisition was performed using a Nikon Ti2-ECLIPSE microscope equipped with an automated translational stage and a digital CMOS camera (ORCA-Flash 4.0,Hamamatsu,Japan).The stage movements and image acquisition were controlled using the NIS elements software(Nikon,Japan).To track the movement of cell clusters,a custom MATLAB program was utilized.This program extracted motion speed and direction information from the trajectories of individual cells,allowing for precise analysis of cluster dynamics.
3.4.Langevin dynamics simulation of the passive particles
Physical characteristics of the particles(i.e.,diameter and interactions) are defined as the cutoff of the Lennard–Jones potentialELJ[19,20]between particles
whereεLJ=10KBT, the depth of the potential well,σis the distance between two particles when the potential energy of the interaction is exactly zero,dandr0are the distance between particles and particle diameter.Below the cutoffrp,the interaction between particles is purely repulsive.The cutoffrpcan,therefore,be treated as the effective diameter
Whenr0is changed,dchanges with it,and it’s inversely correlated,under the number of particles is constant.Thereforeσandrpboth change with them.
Acknowledgments
Project supported by the National Natural Science Foundation of China(Grant Nos.51927804 and 12174306)and the Natural Science Basic Research Program of Shaanxi Province of China(Grant No.2023-JC-JQ-02).
- Chinese Physics B的其它文章
- The application of quantum coherence as a resource
- Special breathing structures induced by bright solitons collision in a binary dipolar Bose–Einstein condensates
- Effect of short-term plasticity on working memory
- Effect of mono-/divalent metal ions on the conductivity characteristics of DNA solutions transferring through a microfluidic channel
- Off-diagonal approach to the exact solution of quantum integrable systems
- In-plane spin excitation of skyrmion bags

