Development of a new 17-item Asthenopia Survey Questionnaire using Rasch analysis
Na Lin, Xiao-Man Li, Mao-Yuan Yang, Li Tian, Zhi-Hua Li, Jie-Li Mao, Jia-Fang Zhang,Jie Chen, Fan Lyu, Ru-Zhi Deng
1National Clinical Research Center for Ocular Diseases, Eye Hospital, Wenzhou Medical University, Wenzhou 325027,Zhejiang Province, China
2Wenzhou Medical University, Wenzhou 325027, Zhejiang Province, China
Abstract
● KEYWORDS: asthenopia; 17-item Asthenopia Survey Questionnaire; Rasch analysis; scoring mode
INTRODUCTION
Asthenopia, also known as visual fatigue, is a subjective symptomatic disease, which can result in symptoms including visual impairment, eye discomfort, or systemic symptoms after experiencing an excessive load on the eyes[1-2].The prevalence of asthenopia has received attention in the scientific literature for over 30y.How to gauge prevalence is challenging due to the wide variety of subject conditions, along with the range of methodologies that are applied to identify asthenopia.Recent data showed the number of people with asthenopia was significantly growing with the increasing use of digital devices[3].The prevalence of asthenopia ranged from 53.3% to 71.0% in adults[4-6].A recent Meta-analysis including data from 2465 subjects who under 18-year-old estimated an overall prevalence of 19.7%, ranging from 12.4% to 26.4%[7].
In the assessment of asthenopia, a problem lies in the imprecise definition of asthenopia in most published studies, due to the use of unstructured and non-validated questionnaires, which only have one dimension and do not have a calculated score for prediction[8-10].Most existing used asthenopia questionnaires are designed for a condition-specific disease, not specifically designed for asthenopia, such as dry eye questionnaire (5-Item Dry Eye Questionnaire[11]), binocular visual dysfunction questionnaire (Convergence Insufficiency Symptom Survey[12])and video terminal syndrome (The Computer-Vision Symptom Questionnaire[13-14]or Digital Eye Strain Questionnaire[15]).
Among them, our research group previously developed a 19-item Asthenopia Survey Questionnaire (ASQ)-19 stands out as the most comprehensive asthenopia questionnaire[16].Its design was based on classical test theory, the items were selected from a review of the scientific literature, and it was validated with a broad consensus among experts, using a pre-test, a pilot test, and a re-evaluation[16].While the item statistics of classical test theory depend on the sample size of the test, and the hypothetical parallel test is impossible to achieve in actual situations[17-18].Rasch analysis is a psychological measurement technology used to compile and revise measurement tools[19].It focuses on each item of the scale, uses mathematical functions to evaluate the relationship between individual ability and item difficulty, and accurately evaluates the potential ability of patients and the correlation between items[20], the accuracy of the scales must be guaranteed.
This study aimed to validate the psychometric properties of ASQ-19 by Rasch analysis and obtain a calculated score for prediction, providing a practical survey questionnaire for clinical application and epidemiological studies.
SUBJECTS AND METHODS
Ethical ApprovalAll procedures performed in studies involving human participants followed the ethical standards of the Eye Hospital of Wenzhou Medical University Scientific Ethics Committee and with the 2013 Declaration of Helsinki and its later amendments or comparable ethical standards.The study was approved by the Bioethics Committee of the Eye Hospital of Wenzhou Medical University (No.2016-YKY-8).Informed consent was obtained from all individual participants included in the study.
Study DesignThis prospective, cross-sectional study consisted of four phases.Phase 1 assessed the original ASQ-19 and obtained the ASQ-18.Phase 2 investigated new asthenopia participants by using ASQ-18 and obtained the ASQ-17.Phase 3 investigated additional new asthenopia participants by using ASQ-17 and was adopted to be the final version.Phase 4 recruited non-asthenopia participants by using ASQ-17 and obtained the cut-offvalue of ΑSQ-17.
Totally 739 participants from the Eye Hospital of Wenzhou Medical University (from January 2018 to January 2021) were eligible, and 680 were involved in the result analysis (with an effective rate of 92.0%:4.0% were invalid due to missed sections, and the rest 4.0% were due to making multiple choices for one question).Inclusion criteria were as follows:1) The patient had asthenopia complaints; 2) The patient was older than 16-year-old and could understand the questionnaire.Totally 583 participants diagnosed with asthenopia met the Expert Consensus for the Diagnosis and Treatment of Asthenopia (2014)[1].Totally 97 non-asthenopia participants met the inclusion criteria but were not diagnosed with asthenopia.
Sample SizeTo achieve stable item calibrations within 1/2 logits and have 95% confidence, the minimal sample size for each round of Rasch analysis in the study was set at 64 participants[21].
19-item Asthenopia Survey QuestionnaireThis study was based on our previously developed ASQ-19[16](Table 1).ASQ-19 has nineteen items included in three dimensions: seven items of ocular organic symptoms (Dimension A), seven items of visual functional symptoms (Dimension B), and five items of systemic symptoms (Dimension C).The scoring mode was “Frequency” × “Intensity”.“Frequency” has a fourpoint response rating scale from “never” (0), “occasionally”(1), “often” (2) to “always” (3) according to the frequency of symptoms.“Intensity” was divided into “mild” (1), “moderate”(2) and “severe” (3).The score of each item was the product of the scores of frequency and intensity, resulting in seven scores for each item (i.e., 0, 1, 2, 3, 4, 6, and 9).The total score of the questionnaire was the sum of the scores of each item.The higher the score, the more severe the symptoms of asthenopia.
Psychometric Characteristics Index of Rasch AnalysisThe following psychometric parameters were considered in the Rasch analysis to assess the psychometric properties of an instrument.
DimensionalityDimensionality was assessed using the item-fit statistics, the mean square (MnSq) and the principal component analysis of the residuals (PCΑR).Infit and Outfit MnSq both measured the extent of fitness of each item to the questionnaire construction.Infit statistics was more sensitive to inliers and therefore was considered more informative.A criterion of MnSq from 0.5 to 1.5 was considered a productive item for measurement[22].The first contrast in the residuals indicated whether there were other patterns within the variance that were not explained by the principal component.An eigenvalue of less than 2.0 and an unexplained variance in the first contrast of less than 10% would indicate that the instrument was measuring only one construct[23].
Category orderAn essential part of the assessment was to examine the extent to which the respondents use response categories in an orderly fashion.The option sorting analysis provided the additional benefit that it could be usedto determine the optimal number of response categories.If the analysis shows redundancy or disruption to category order, it may be necessary to combine adjacent response categories[23].It was also important to examine the frequency of responses in each category.At least 10 responses per rating scale category were recommended[24].
Person separationPerson separation is a measurement of the questionnaire’s precision, which is defined as the ability of the instrument to distinguish personal ability in different groups.Person separation index (PSI) and person separation reliability(PSR) were used and higher values indicated better reliability.

Table 1 Characteristics of study participants in phase 3
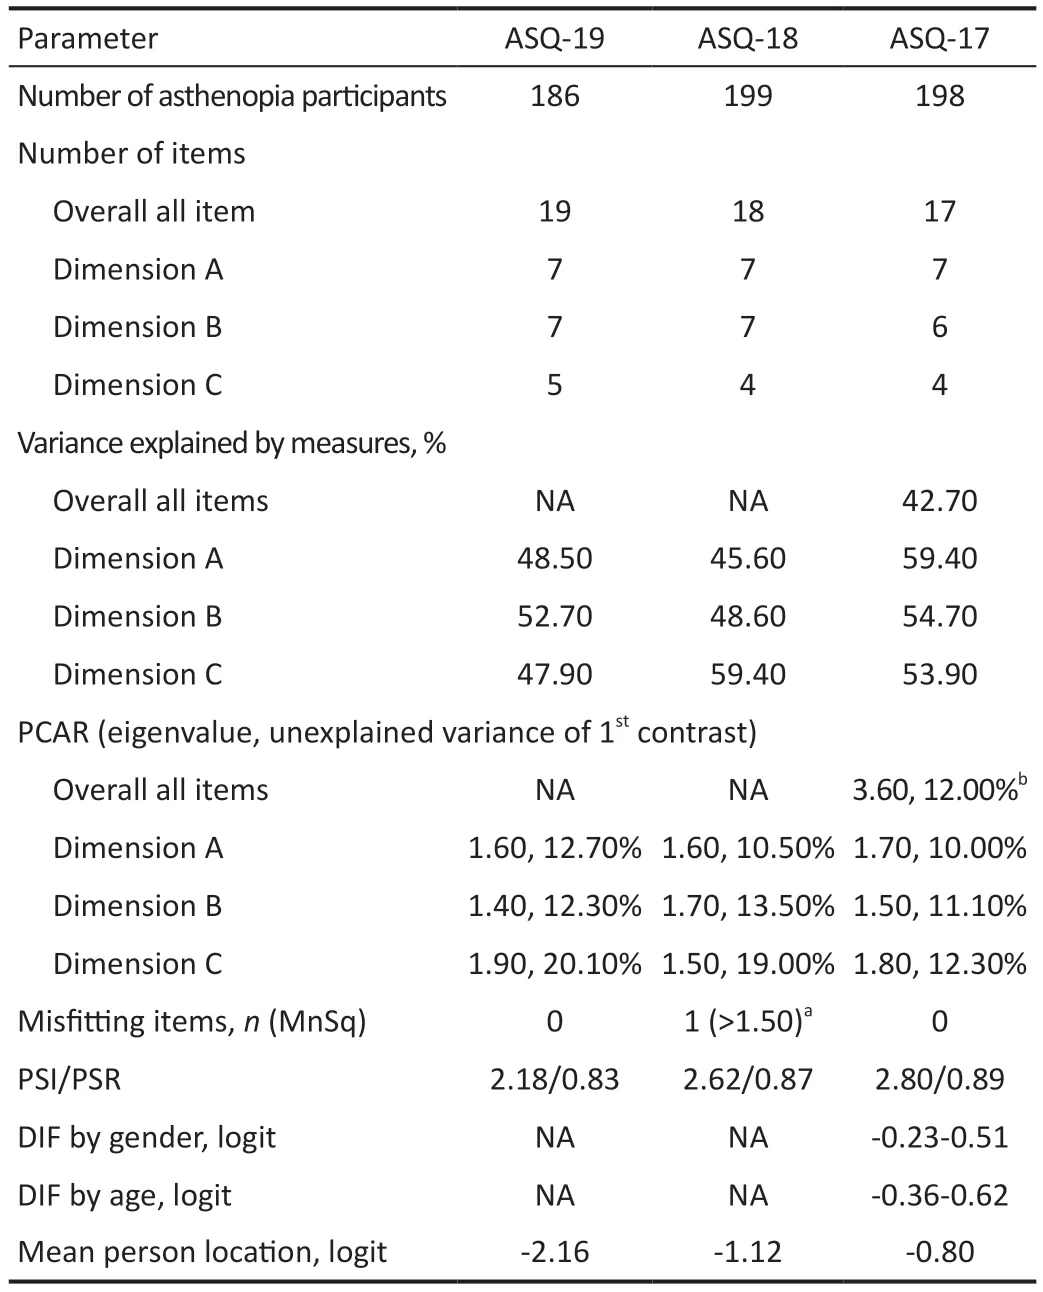
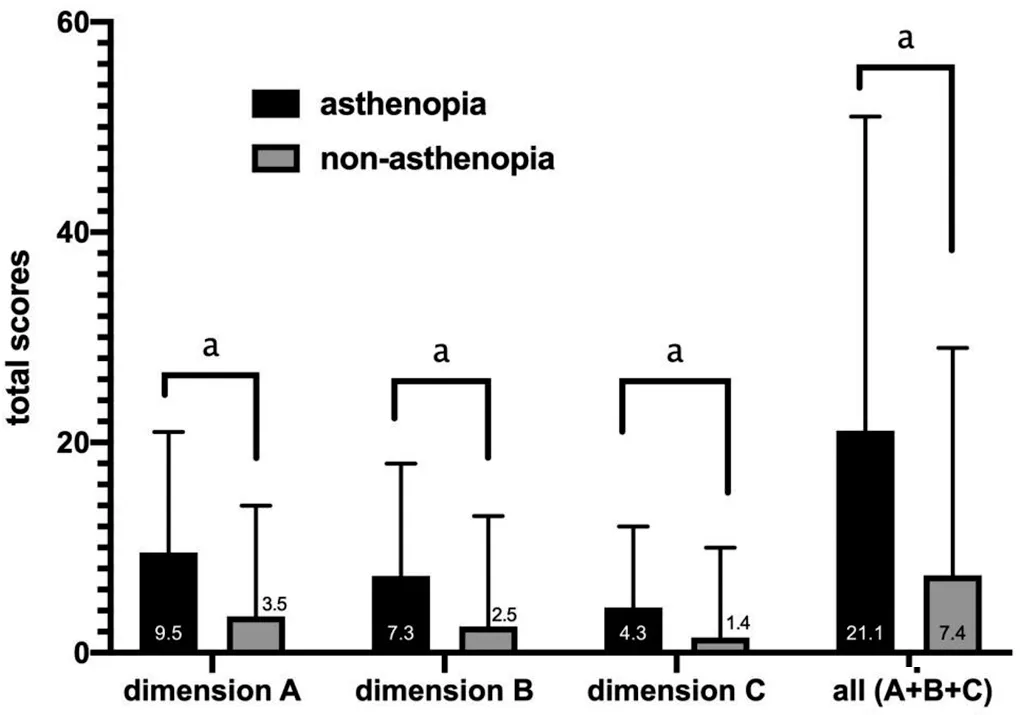
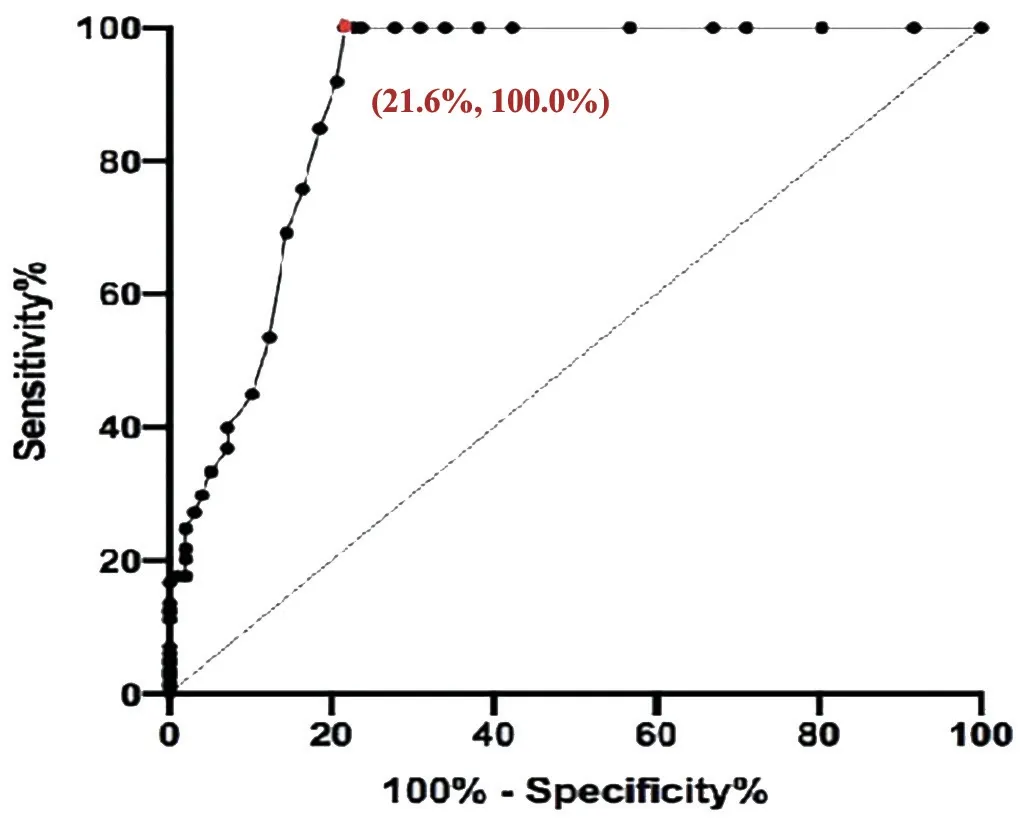
Differential item functioningDifferential item functioning(DIF) test was performed to assess whether the items of the instrument function similarly for all individuals at the same ability level regardless of their characteristics.For the DIF testing, the respondents were stratified by gender (male/female), age (≥mean age/ TargetingTargeting refers to whether the difficulty of items matches the abilities of the individuals.Targeting was estimated by the difference in person and item means. Predictive Ability of QuestionnaireThe ability of the questionnaire to predict asthenopia diagnoses (cut-off value)was analyzed by receiver operating characteristic curve(ROC)[25].The optimal cut-off value was determined by the point whereby the Youden’s index was maximized (Youden’s index=sensitivity +specificity -1)[26]. Clinical Verification and Quality ControlTwo attending ophthalmologists conducted ophthalmic examinations and made a diagnosis.Participants were asked to self-complete the questionnaires after obtaining a definite diagnosis. Two trained researchers collected the survey questionnaires from these patients.Patients had sufficient time to finish the questionnaires.Researchers assisted the participants if the participants were unclear about the questionnaire.The integrity of the questionnaire (whether the participants missed a section,whether they had multiple answers for a given section,etc.)was monitored once per week. Statistical AnalysisContinuous variables were described as mean±standard deviation when data had a normal distribution and median (interquartile range, IQR) when data had a nonnormal distribution.Independentt-test was used in normal distribution variables, while the Chi-square test and Wilcoxon rank sum test were used in non-normal distribution variables.The operation about data input was carried out by two people used by EpiData (version 3.1, Denmark).The data were analyzed using SPSS (version 25.0, Chicago, USA) and Winsteps(version 3.72.3, Beaverton, USA).AllPvalues were 2-sided.APvalue <0.05 was considered statistically significant. Characteristics of ParticipantsA total of 583 participants with asthenopia and 97 with non-asthenopia were included.There were 186 asthenopia participants [median (Q1, Q3)age: 29 (25, 33)y, 36% males] in phase 1, 199 asthenopia participants [median (Q1, Q3) age: 30 (24, 39)y, 38.2% males]in phase 2, 198 asthenopia participants [median (Q1, Q3) age:28 (25, 33)y, 44.4% males] and 97 non-asthenopia normal control [median (Q1, Q3) age: 29 (24, 33)y, 52.6% males] in phases 3 and 4.There was no statistically significant age and gender difference between the 198 asthenopia and 97 normal controls (Table 1). Phase 1: Assessment of the Original ASQ-19There were no misfitting items in the ΑSQ-19 (both the Infit and Outfit MnSq values of all items were 0.75-1.49), indicating that the items measured a single construct.This was further supported by the PCAR, which showed that the variances explained were 48.5%, 52.7%, and 47.9% in Dimensions A (ocular organic symptoms), B (visual functional symptoms) and C (systemic symptoms) respectively.The eigenvalue and unexplained variances explained in the first contrast in Dimensions A,B, C were 1.60, 1.40, 1.90 and 12.70%, 12.30%, 20.10%respectively.ASQ-19 also had a PSI value of 2.18 and a PSR value of 0.83. The number of responses for 0, 1, 2, 3, 4, 6, and 9 scores was 102, 502, 1030, 890, 645, 313 and 52 respectively (met the standard of more than 10 responses per rating scale category).Option sorting analysis (Figure 1) showed the curve peaks of 1, 2, 3 scores covered with each other, and 4, 6 scores covered each other.Scores with curve peak covered each other should be combined into one option.Thus, the scoring mode should be reconsidered. Project suitability analysis showed that the mean person location was -2.16 logit, meaning that the average scores of items were lower than the average scores of individuals.This suggests that the items were more difficult than individuals’ability.Moreover, we found that a few patients had difficulty distinguishing between the 18thitem “Did eye discomfort make you feel anxious?” and the 19thitem “Did eye discomfort make you feel depressed?” in clinical practice.Their average item location on the Wright map were close, indicating the similar difficulty. Consequently, we adjusted the item scoring mode to “Intensity”scoring, a four-point Likert response rating scale from “never”(0), “mild” (1), “moderate” (2) to “severe” (3).The 18thand 19thitems were combined into a new item, so a new 18-item Asthenopia Survey Questionnaire (ASQ-18) was obtained. Phase 2: Assessment of the ASQ-18There was one misfitting item in the ASQ-18 (the Infit and Outfit MnSq values of the 11thitem were 1.55 and 1.60 respectively, the rest seventeen items were 0.80-1.27) indicating that the 11thitem didn’t fit the construct well.The 11thitem “Did you feel blur or ghosting when looking far?” was eliminated. The number of responses for 0, 1, 2, 3 scores were 1426, 1323,623 and 210 respectively (met the standard of more than 10 responses per rating scale category).Option sorting analysis(Figure 1) showed the curve peaks of 0, 1, 2, 3 scores were separated from each other and in the same order, indicating the four options were reasonable. The mean person location was -1.12 logit, which was closer than ASQ-18, but still out of the standard value. The eigenvalue and unexplained variance explained in the first contrast and PSI/PSR were similar to ΑSQ-19 (Table 2),indicating the items were measuring single construct and good reliability. Consequently, we deleted the 11thitem, so another new 17-item Asthenopia Survey Questionnaire (ASQ-17) was obtained. Phase 3: Assessment of the ASQ-17For ASQ-17, both the Infit and Outfit MnSq values of all items were between 0.67 and 1.48, while the standard values are from 0.5 to 1.50, which indicates that there was no misfitting item. The mean person location was -0.80 logit (which met the standard of less than 1.0 logit), which is better than ASQ-18, indicating that ASQ-17 has good targeting between the difficulty of items and individual ability. The variance explained by the principal component and the unexplained variance explained by the first contrast inthe overall 17 items were 42.7% and 3.60 (more than the standard value of 2.00), indicating ASQ-17 has more than two dimensions.However, the variance explained by the principal component was 59.4%, 54.7%, 53.9% in Dimensions A, B,and C, respectively, which were closer to 60.0% and better than ASQ-18.The eigenvalue and unexplained variance in the first contrast in Dimensions A (ocular organic symptoms), B(visual functional symptoms) and C (systemic symptoms) were 1.70, 1.50, 1.80, and 10.00%, 11.10%, 12.30% (were closer to 10.00% than ASQ-19 and ASQ-18) respectively, indicating that three dimensions setting was reasonable for ASQ-17, and that unnecessary to be divided into more dimensions. Table 2 Overview of results of ASQ-19, ASQ-18, and ASQ-17 by Rasch analysis The responses for 0, 1, 2, 3 scores were 453, 1846, 864, and 203 respectively (met the standard of more than 10 responses per rating scale category).The results of option sorting analysis(Figure 1) and PSI/PSR (Table 2) were within the standard and similar to ASQ-18. DIF analysis showed the functional differences of each item by gender were -0.38-0.51 logit, by age were -0.36-0.62 logit,indicating ASQ-17 has no significant difference between gender and age, and was suitable for different gender and age populations.Consequently, the new ASQ-17 was adopted as the final version (Table 3). Phase 4: The Predictive Ability of the ASQ-17Figure 2 showed the mean total scores of Dimensions A, B, and C and all three dimensions in asthenopia participants were significantly higher than non-asthenopia participants, which were 9.5±4.1vs3.5±3.2, 7.3±3.3vs2.5±2.7, 4.3±2.2vs1.4±2.0,and 21.1±8.1vs7.4±7.0 respectively (allP<0.001). Figure 3 showed the area under curve (AUC) of ASQ-17 in two groups was 0.899, indicating ASQ-17 has good diagnostic ability (P<0.001).Youden’s index was up to the maximum value of 0.784 when the cut-off value was 12.5,and the specificity and sensitivity index were 78.4%, and 100.0% respectively.So, we suggested that asthenopia can be diagnosed if the total score was higher than 12.5 and treatment is recommended. The top four mean score items were the 8th(the brightness of the screen caused eye discomfort when using mobile phone or computer), 1st(discomfort around the eyes), 2nd(eye dryness)and 4th(eye soreness), ranging from 1.51 to 1.53 (Figure 4). The 17-item Asthenopia Survey Questionnaire (ASQ-17,Table 2) is the first validated version of the original ASQ-19 which can be used in clinical practice for the surveillance of the visual health of the Chinese adult population.ASQ-17 covers 7 items of eye symptoms, 6 items of visual symptoms and 4 items of systemic and psychological symptoms with a total score of 51 and an optimal cut-offthreshold value of 12.5.The present study demonstrated that ASQ-17 has adequate item and person fit the model predictions, adequate reliability,unidimensionality, and no or minimal severe DIF by gender and age.ASQ-17 can be completed in less than three minutes in a self-report investigation without excessive burden to participants. Figure 2 Comparison of mean total scores for asthenopia and non-asthenopia participants used ASQ-17 ASQ-17: The 17-item Asthenopia Survey Questionnaire.The columns in black are the mean scores of asthenopia participants (n=198) and the columns in grey are the mean scores of non-asthenopia participants (n=97).aP<0.001. Figure 3 The ROC of ASQ-17 in asthenopia and non-asthenopia participants ROC: Receiver operating characteristic curve; ASQ-17: The 17-item Asthenopia Survey Questionnaire.The area under the curve was 0.899 (P<0.001), indicating ASQ-17 has good diagnosability.Youden’s index was up to the maximum value of 0.784 when the cut-off value was 12.5, and the specificity and sensitivity index were 78.4%, and 100.0% respectively (the red dot). The present study was unique because it optimized the previously developed ASQ-19 by using the Rasch measurement theory and obtained a better version of ASQ-17.ASQ-19[16]is a self-administered questionnaire that evaluates the frequency and intensity of 19 ocular organic,visual functional and systemic symptoms related to asthenopia.Cronbach α for the three subscales of this version was between 0.79 and 0.85, while for the complete questionnaire was 0.90,with a spilt-half reliability of 0.80.Factor analysis showed the three components had eigenvalues>3 and these explained 54.3% of the variance[16]. Table 3 English Version of the 17-item Asthenopia Survey Questionare (ASQ-17) Since there is a need for ASQ-19 to be validated by Rasch analysis and generate a calculated score for prediction, the research group is responsible for the validation of the original ASQ-19.This study contained four phases.The scoring mode of ASQ-19 was analyzed by Rasch analysis in phase 1.The results of different scores were overlapped, indicating seven options for each item were unreasonable.We adjusted the scoring mode to a four-point Likert response rating scale from“never” (0), “mild” (1), “moderate” (2) to “severe” (3), the results showed independence in the following two rounds of Rasch analysis.It was also shown that people prefer to use four or five categories[27].In clinical practice, we found some patients had difficulty in distinguishing the 18thitem (feel anxious) and the 19thitem (feel depressed).The average item location on the Wright map also showed these two items had similar difficulties.Therefore, the 18thand 19thitems were combined into a new 18thitem (feel anxious or depressed) and ASQ-18 was obtained.The properties of the new 18thitem in the following Rasch analysis showed well and suggested this combination was acceptable.The 11thitem (feel blur or ghosting when looking at distance objects) was not a valid measure of the construct and was eliminated in phase 2.It was shown that the asthenopic symptoms were often relieved when looking at distant objects due to the relaxation of accommodation and convergence[28].In the last phase,participants with asthenopia and non-asthenopia were asked to finish ΑSQ-17 and it was confirmed that ΑSQ-17 could be the final version. In this study, participants were asked to self-complete the questionnaires, which can artificially interfere with the result[29].However, ASQ-17 still had good accuracy and rationality and was verified from the following six aspects.1) Dimensionality analysis showed that the three dimensions(ocular organic, visual functional and systemic symptoms)were in good construct.PCAR was a more definitive way to assess the dimensionality of an instrument, it was 59.4%,54.7%, 53.9% in Dimensions A, B, and C respectively, and were better than the standard level (50%)[30].The current used general asthenopia questionnaires[8,10]only have one dimension and do not have a calculated score for prediction.The threedimensional design construct was also consistent with the main cause of asthenopia[1]and helpful in assisting the diagnosis.2) Option sorting analysis showed that the curve peak of 0,1, 2, 3 scores were separated from each other and in the same order, indicating the four-point Likert response rating scale was reasonable—a phenomenon also reported in the validation of other vision scales[31-32].The most useful classification of asthenopia in clinical practice is also four-point (non, mild,moderate and severe asthenopia)[1], which was consistent with the score of each symptom and helpful for the classification according to the score.3) Person separation is a measurement of the questionnaire’s precision, which is defined as the ability of the instrument to distinguish the personal ability in different groups.The PSI and PSR values of ASQ-17 were 2.80 and 0.89, a PSI value higher than 2.0 and a PSR value higher than 0.8 were set as the cutofffor acceptability[33].4) The functional differences of each item by gender were -0.38-0.51 logit, and by age were -0.36 to 0.62 logit, indicating ASQ-17 has no significant difference between gender and age, and was suitable for different gender and age adult populations.Small or absent differential item functioning was defined as a difference of less than 0.50 logit, minimal differential item functioning as 0.50 to 1.00 logit, and notable differential item functioning as more than 1.00 logit[30].5) The mean person location of ASQ-17 was-0.80 logit, a difference in means larger than 1.0 logit indicates notable mistargeting[34], which also showed better targeting between the difficulty of item and individual ability than the Computer Vision Syndrome Questionnaire Italy (CVS-Q IT,-2.36 logit)[13].6) The AUC of ASQ-17 in asthenopia and nonasthenopia groups was 0.899, and Youden’s index was 0.784 when the cut-off value was 12.5, indicating ASQ-17 could assist in asthenopia diagnosis and monitor the symptoms.The results were also better than CVS-Q IT (0.874 and 0.631 respectively)[13].It may be due to the focus of CVS-Q IT was precisely for detecting people with moderate or severe symptoms, both in psychometric and substantive terms were at the lower levels. This study found that the most common complaints of asthenopia subjects were discomfort caused by the brightness of the mobile phone or computer screens, discomfort around the eyes, dryness and soreness of eyes, which was partly supported by our previous findings[2](ocular complaints and eye dryness were the most common symptoms in asthenopia).Studies showed computer screen exposure was significantly related to asthenopia[35], and short-wavelength filtering lenses could effectively relieve asthenopia[36].Exposure to direct glare induced greater development of visual symptoms and discomfort[37].The overuse of video terminals is also the main reason for the increase in asthenopia in recent years[38]. In conclusion, the present study provided essential information about the psychometric properties of a 17-item version of the asthenopia survey questionnaire.The Rasch analysis showed that ASQ-17 had stronger option sorting and suitability than ASQ-19.ASQ-17 could be an effective questionnaire for evaluating asthenopia in clinics.ASQ-17 can be easily completed and provides a calculated score to predict asthenopia, which is suitable for diagnosis and curative effect evaluation. ACKNOWLEDGEMENTS We thank all participants for their time and support of our study.We also acknowledge Dr.Jingwei Zheng for his advice on statistical analysis. Authors’ contributions:Lin N identified participants,collected questionnaires, performed data analysis, and drafted the manuscript.Li XM identified participants, collected questionnaires, analyzed data, obtained ethical approval,and revised the manuscript.Yang MY and Tian L identified participants and collected questionnaires in phases 3 and 4.Li ZH identified participants and collected questionnaires in phase 2.Mao JL identified participants and collected questionnaires in phases 3 and 4.Zhang JF identified participants and collected questionnaires in phase 1.Chen J revised the manuscript.Lu F and Deng RZ were equal contribution correspondents, they supervised the study, participated in the discussions of each section of experiments, supported this research, and reviewed the manuscript.All authors read and approved the final manuscript. Foundations:Supported by Wenzhou Science and Technology Bureau Project (No.Y2020036); the National Science Foundation of China (No.82000861); National Key Research and Development Program of China (No.2020YFC2008200). Conflicts of Interest:Lin N,None;Li XM,None;Yang MY,None;Tian L,None;Li ZH,None;Mao JL,None;Zhang JF,None;Chen J,None;Lyu F,None;Deng RZ,None.RESULTS

DISCUSSION


 International Journal of Ophthalmology2023年11期
- International Journal of Ophthalmology的其它文章
- Research progress on animal models of corneal epithelial-stromal injury
- Role of lymphotoxin alpha as a new molecular biomarker in revolutionizing tear diagnostic testing for dry eye disease
- Therapeutic potential of iron chelators in retinal vascular diseases
- Axial length and anterior chamber indices in elderly population: Tehran Geriatric Eye Study
- Retinal thickness and fundus blood flow density changes in chest pain subjects with dyslipidemia
- Analysis of independent risk factors for acute acquired comitant esotropia
