
Research progress in geophysical exploration of the Antarctic ice sheet
2023-11-08 02:22:54JinkaiAnSongHuangXiangyangChenTaoXuZhimingBai
Earthquake Research Advances 2023年3期
Jinkai An,Song Huang,Xiangyang Chen,Tao Xu,Zhiming Bai
a Key Laboratory of Petroleum Resource Research,Institute of Geology and Geophysics,Chinese Academy of Sciences,Beijing,100029,China
b Key Laboratory of Mineral Resources,Institute of Geology and Geophysics,Chinese Academy of Sciences,Beijing,100029,China
c State Key Laboratory of Lithospheric Evolution,Institute of Geology and Geophysics,Chinese Academy of Science,Beijing,100029,China
d Innovation Academy for Earth Science,CAS,Beijing,100029,China
e University of Chinese Academy of Sciences,Beijing,100049,China
Keywords:Antarctic ice sheet Intra-and subglacial structures Ice sheet mass balance Interdisciplinary Integrated geophysical exploration
ABSTRACT The Antarctic ice sheet is an important target of Antarctic research.Thickness and structure,including intraice and subice,are closely related to the mass balance of the ice sheet,and play an important role in the study of global sea level and climate change.Subglacial topography is an important basis for studying ice sheet dynamics and ice sheet evolution.This paper briefly reviews the geophysical detection methods and research status of the Antarctic ice sheet: (1) Conventional methods such as ice radar are the main methods for studying the ice sheet today,and passive source seismic methods such as the receiver function method,H/V method and P-wave coda autocorrelation method have good development prospects;(2) the high-resolution (1 km) ice thickness and subglacial topographic database BEDMAP2 established based on various data has greatly improved the ability to detect internal isochronous layers,anisotropic layers,and temperature changes within ice and has advanced research on ice sheet evolution;and(3)ice radar,numerical simulation and core drilling are the main methods to study subglacial lakes and sediments.More than 400 subglacial lakes have been confirmed,and more than 12 000 simulation results have been obtained.Research on the Antarctic ice sheet faces enormous challenges and is of great urgency.Aiming at hot issues,such as Antarctic geological evolution,glacial retreat,ice sheet melting and their relationships with global climate change,it is the frontier and trend of future Antarctic ice sheet research to carry out multidisciplinary and multicountry comprehensive geophysical exploration based on the traditional ice radar method combined with passive seismic methods,especially new technologies such as short-period dense array technology,unmanned aerial vehicles and artificial intelligence.This is expected to further promote Antarctic research.
1.Introduction
As one of the oldest continents on Earth,the Antarctic continent has attracted the attention of scientists from all over the world due to its unique geographical location,special natural conditions and complex geological changes (Fig.1).Ninety-eight percent of the continent is covered with snow and ice year-round.This giant ice cap is called the“Antarctic ice sheet”.The Antarctic ice sheet contains approximately 90%of the world's ice reserves and 70%of its fresh water.If the ice sheet were to melt completely,it would lead to a sea level rise of approximately 58 m(Alley et al.,2005;Rignot et al.,2019).The existence of such a large ice sheet affects material exchange,such as heat and water vapour,and plays an important role in global climate change.The sedimentary sequence of the ice sheet contains abundant palaeoenvironmental information,and the change in ice sheet thickness is often closely related to mass balance and sea level changes.The morphology and density,elastic parameters,water content and other properties of the ice sheet as well as the internal structure often reflect dynamic processes such as the growth and retreat of the glacier (Tang et al.,2015;Hanna et al.,2013).In addition,the subglacial structure is an important factor affecting the mass balance of the ice sheet,subglacial lakes play an important role in the evolution of the ice sheet,and subglacial lakes and sedimentary basins affect observations based on ice data (Anandakrishnan and Winberry,2004;Hodgson et al.,2016;Zhou et al.,2021;Frederick et al.,2016).Therefore,under the current global warming situation,the study of Antarctic glacial dynamics and the Antarctic ice sheet is of great significance for global climate change and future evolution (Zhang et al.,2019).There have been a variety of geophysical methods for observing the Antarctic ice sheet,and as early as 1933,U.S.Air Force pilots using radar altimeters over the ice sheet found inaccurate readings (Cui et al.,2009).Since then,a variety of geophysical exploration methods,including ice radar,seismic reflection and refraction,gravity,magnetism,and core drilling,have been applied successively to study the ice sheet thickness,internal isochronous layers,inside density and temperature,subice structure,etc.,and a more profound and accurate understanding has been obtained (Yan,2018).In addition,researchers have combined geophysical modelling methods to provide more accurate and detailed research results on the subglacial structural morphology and distribution in Antarctica (Siegert et al.,2016;Pattyn et al.,2016;Livingstone et al.,2013;G¨oller,2014).In the past 20 years,passive source seismological methods have been widely applied in Antarctica.The successful use of such methods not only independently verified the ice thickness model and enriched the ice thickness data but also provided a new means to study the internal structure of the ice sheet and infer the subglacial basement conditions (Yan et al.,2018,2020;Wittlinger and Farra,2012,2015).
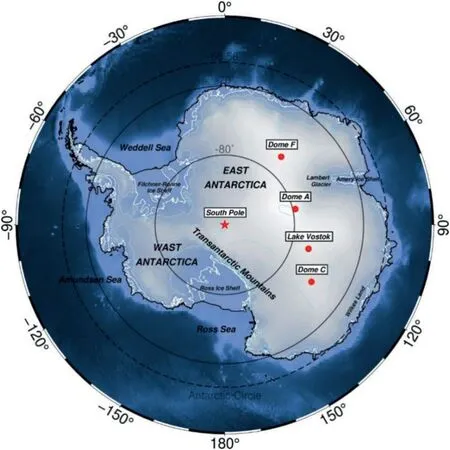
Fig.1.Schematic diagram of the geographical location of Antarctica.
Geophysical exploration of the Antarctic ice sheet is of great significance to the study of the geosciences and meteorology of Antarctica and even the world.The application of various geophysical exploration methods in Antarctica not only promotes the further study of the Antarctic ice sheet and its subglacial structure but also provides exploration ideas for human research on exoplanets (such as Europa and Titan).Currently,the geophysical exploration of the Antarctic ice sheet has become a polar research topic with multiple methods,disciplines and countries cooperating and promoting each other.
To deepen people's understanding and promote the further development of the geophysical exploration of the Antarctic ice sheet,this paper reviews the geophysical exploration methods of the Antarctic ice sheet,introduces the main progress of the geophysical exploration of the Antarctic ice sheet,and finally provides the prospects for the future development of the geophysical exploration of the Antarctic ice sheet.
2.Geophysical prospecting methods of the Antarctic ice sheet
2.1.Ice radar methods
As early as 1955,the theoretical method of radio-echo sounding(RES)technology was first proposed to the glaciology research agenda to detect Antarctic ice thickness (Bogorodsky et al.,1985).RES is also known as ice radar.The ice radar detection method is the application of ground-penetrating radar in the detection of glaciers and ice sheets.This method is based on the theory of electromagnetic waves and studies the characteristics of ice and snow media by receiving the time-depth conversion of radar echoes.The weak attenuation of electromagnetic wave propagation in the ice and good stratification inside the ice sheet are the theoretical basis for ice radar to study the Antarctic ice sheet.The ice radar method has some shortcomings,such as the detection of blank areas in the warm ice area and melting areas due to the attenuation and absorption of electromagnetic waves,and its detection depth and resolution are contradictory.In general,compared with other detection methods,ice radar has the advantages of strong penetration,high resolution,large amount of information and high efficiency;therefore,it has been widely used in the study of ice structure for decades (Cui et al.,2009;Drews et al.,2009).
In actual measurements,airborne and vehicle-mounted platforms are the two most common platforms equipped with ice radar.Vehiclemounted ice radar has a small coverage area but a high precision,which is suitable for small-area exploration.However,airborne ice radar has a wide coverage area and high detection efficiency,but it has shortcomings such as poor attitude stability and insufficient positioning ability.It is generally used for large-range detection (Bingham and Siegert,2007).In the 21stcentury,ice radar systems began to develop in the multifrequency band and multipolarization and multichannel directions,which can obtain ice sheet thicknesses of several kilometres with high efficiency and precision(Cui et al.,2009;Liu et al.,2018).Ice radar can also be used to study internal isochronous layers based on echoes at different depths inside the ice,and the results can be used to infer changes in temperature and density inside the ice to obtain more abundant information under the ice (Retzlaff and Bentley,1993;Yang et al.,2021).For example,the University of Kansas developed the wideband coherent radar depth sounder (WCORDS),wideband synthetic aperture radar (WSAR),and multiband synthetic aperture radar (MSAR).WCORDS can be used for the exploration of ice thickness,subglacial topography and inner layers.Its maximum exploration depth is over 4500 m,and the resolution of inner layers can reach 55.9 cm.It can accurately measure the ice sheet thickness and the structural characteristics of the ice bottom.The device can also be mounted on supraglacial intelligent robots for exploration research(Kuchikulla,2004).MSAR can operate in three frequency bands: 75–85 MHz,140–160 MHz and 330–370 MHz.It is equipped with one transmitter and two receivers to obtain the forwards and backscattering information of ice simultaneously(Paden et al.,2004).WSAR is mainly used to image the ice and rock interface under a 3 km ice sheet and can simultaneously measure the ice thickness and inner layer (Dunson,2006).In addition,the National Institute of Polar Research (NIPR) developed an ice-penetrating radar system with operating frequencies of 30 MHz,60 MHz and 179 MHz,which can acquire both horizontal and vertical polarization signals.Differences in ice density and deep ice crystal fabric have been detected(Matsuoka et al.,2003).
During the 21stAntarctic scientific survey in 2004,China for the first time used the vehicle-mounted,dual-frequency,ice-penetrating,radar system developed by the NIPR to observe the section area from Zhongshan Station to Dome A,the highest point of the Antarctic Ice Sheet(Wang et al.,2008).During the 26thAntarctic scientific expedition in 2009,the first Chinese-made,vehicle-mounted,ice-penetrating,radar system developed by the Institute of Electronics of the Chinese Academy of Sciences successfully acquired 3000 m of subglacial information,providing important scientific data for the construction of a new airport at Zhongshan Station in Antarctica.In 2015,the Polar Research Institute of China introduced the fixed-wing aircraft platform “Xueying 601′′to the Antarctic for the first time,filling a gap in international observations of the Princess Elizabeth Land in Antarctica under ice (Cui et al.,2020;Xiao et al.,2022) and greatly improving China's ability to obtain information under polar ice.Currently,China's ice-penetrating system is playing a very important role in the polar observation field,and the telemetry data obtained by the autonomous system have been formally included in the international Antarctic subglacial mapping project BEDMAP3.
In conclusion,ice radar has become an indispensable research method in Antarctic ice sheet exploration due to its advantages of strong penetration,high resolution,rich data information and high detection efficiency.
2.2.Seismological methods
Similar to RES,active source seismology uses reflected or refracted seismic data to study the structure and properties of the Antarctic ice sheet.This method has the advantages of high resolution and accurate imaging of subsurface velocity,but it is difficult to use widely in the Antarctic region due to the high exploration cost and logistical difficulties.Therefore,the active source seismic method and the land ice radar method are often complementary to each other to conduct detailed detection of several profiles in a specific area to obtain the P-and S-wave velocity,elastic properties and subglacial topographic information of the study area (Young Kim et al.,2010;Woodward et al.,2010).In 2014,“Discovery”,a research ship of the Shanghai Offshore Petroleum Bureau,overcame the harsh environmental conditions in Antarctica and completed the first Antarctic survey mission of the Sinopec Group,which laid a foundation for the further study of the Antarctic ice sheet with seismic exploration methods (Xia et al.,2014).
In the past two decades,with the increasing number of seismic stations deployed in Antarctica (Fig.2),a data foundation has been laid for passive source seismological methods in the study of Antarctic ice thickness,intraice properties and subice structures (Lawrence et al.,2006;Hansen et al.,2010;Chaput et al.,2014;Li et al.,2021).The seismic velocity difference between the Antarctic ice sheet,or the interface between the subglacial sediments,and the bedrock is large,which forms an obvious wave impedance interface,which is the theoretical basis of using passive source seismology to study the Antarctic ice sheet (Wang et al.,2009;Wu et al.,2014;Zhang et al.,2019,2020;Zheng et al.,2005).In addition,the method of passive source seismology has a low cost and convenient operation,which can not only independently detect the structure of the Antarctic ice sheet,but can also provide new constraints for existing methods (Yan et al.,2018,2020).At present,a variety of passive seismic methods,including P-wave receiver functions and the horizontal-to-vertical spectral ratio (H/V) method,have been used to study various polar glacial properties,such as ice sheet thickness,ice fabric and subice structure,with satisfactory results (Anandakrishnan and Winberry,2004;Hansen et al.,2010;Wittlinger and Farra,2012,2015;Yan et al.,2018;Zhan et al.,2014).
In the future,passive source seismology has broad application prospects in the study of Antarctic ice sheet thickness,imaging of the subglacial lithosphere and sedimentary basin structure,and locating ice earthquake events (Yan et al.,2017;Yu et al.,2022).
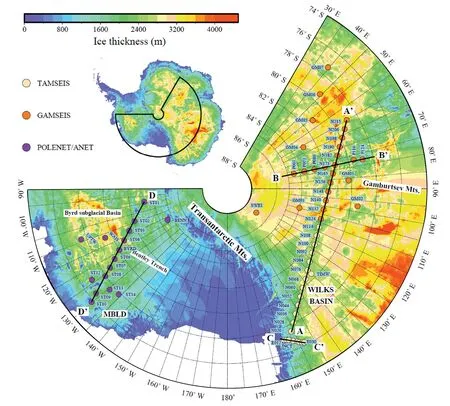
Fig.2.Some broadband seismic stations in Antarctica (from Yan et al.,2018 with permission).
2.3. Other detection methods
Gravity and magnetic exploration are common means of geophysical research in the Antarctic ice sheet,which is helpful to characterize the distribution of sedimentary layers and volcanic regions.These methods mainly use gravimeters and magnetometers mounted on fixed-wing unmanned aerial vehicles (UAVs) or satellites to detect gravity and magnetic anomalies in the Antarctic ice sheet.In the early stage,single aeromagnetic surveys were mainly carried out by various countries.With the development of technology,aeromagnetic gravity and ice radar methods were also put into use,especially the breakthrough of GPS technology,which greatly improved the accuracy of aerial detection.Since the 21stCentury,Antarctic ice sheet geophysical research has entered an era of multicountry cooperation,multitechnology crossover and parallel multimethods.Gravity and magnetic exploration are often used as supplements to other geophysical exploration methods to improve the accuracy of Antarctic ice sheet exploration research.Among them,aerial measurements require a fixed measurement flight platform,which is greatly limited by the Antarctic climate and cannot get to extreme latitude region in Antarctic contient for measurements at any given time,while satellite measurements are not affected by this.Thanks to the development of satellite differential positioning technology,the accuracy of aerial surveys has been greatly improved,with a higher resolution than satellite data.High-precision airborne gravity measurements provide an effective solution for measuring the grounding line of the Antarctic ice sheet.The thickness of the Antarctic ice sheet obtained by gravity conversion is also more accurate.The high-precision airborne gravity survey provides an effective solution for the study of ground-line measurements of the Antarctic ice sheet,and the launch of gravity satellites such as Gravity Inversion and Climate Experiment Satellite(GRACE) and Earth Gravity Field and Ocean Circulation Explorer (GOCE)makes the thickness of the Antarctic ice sheet transformed by gravity more accurate.
Satellite measurements use satellites to carry various measurement sensors to measure earth objects.The methods mainly used in Antarctic ice sheet research include satellite gravity and magnetism measurements,satellite altimetry,microwave remote sensing,etc.Among them,microwave remote sensing refers to the remote sensing technology of the sensor in the microwave working band (0.3–300 GHz),which uses a sensor to receive microwave signals transmitted or reflected by various ground objects,thereby identifying and analysing objects and extracting information on ground objects.A satellite altimeter is a space measurement technology that uses an altimeter carried by an artificial satellite to measure the height of the satellite to the Earth's surface to obtain Earth surface topography.
The working mode of microwave remote sensing can be divided into active and passive.Active microwave remote sensing means that a sensor transmits microwaves and receives the echo reflected or scattered by ground objects,mainly including side-looking radar,synthetic aperture radar (SAR),radar altimeters,microwave scatterometers,etc.Active microwave remote sensing receives microwaves emitted or scattered by ground objects for remote sensing monitoring,mainly microwave radiometers.Microwave detection can be used to study ice sheet freezing–thawing based on the increase and decrease in water content in ice and snow.
The radar altimeter satellites launched at present can be divided into radar altimeters,laser altimeters and interference radar altimeters.Among them,radar altimeter satellites have high accuracy in measuring lakes or large lakes and low effectiveness in measuring land data.For areas with large topographic fluctuations,the satellite radar altimeter ability is limited.Due to the advantages of high-resolution accuracy and a short measurement period,satellite altimetry technology has become an important means of studying large-scale changes (Ning et al.,2016;Li and Jin,2013).With the increasing maturity of satellite technology and the launch of satellites carrying different sensors,it has become possible to use satellite images to monitor large areas of Antarctic glaciers (Liu and Qi,2022).In addition,drilling is the most accurate measurement method for studying the Antarctic ice sheet,and researchers have developed a variety of sampling devices to obtain sediment samples in different subglacial environments (Hodgson et al.,2016).Examples include short corers for collecting undisturbed sediment–water interface samples,core extractors with manual,hydraulic and electromechanical impact hammers for deeper,harder samples,etc.In the future,with the increasing demand for cores,samplers that can obtain multiple cores in rapid succession will be the focus of research and development.However,although drilling is a high-precision measurement method,it is difficult to promote it on a large scale due to its time-consuming and labour-intensive nature.To date,it can only be used to supplement and confirm data in key areas in Antarctica.
3.Progress in geophysical exploration of the Antarctic ice sheet
The structure of the Antarctic ice sheet has always been the key research object of multidisciplinary scientific researchers,including geophysicists.Key properties include ice sheet thickness,ice sheet anisotropy,ice temperature,subglacial lakes and subglacial sediments,etc.Structure is critical to Antarctic ice sheet research.Currently,geophysical research on the Antarctic ice sheet has entered the era of multinational cooperation and multimethod joint detection.
3.1.Superglacial snow layer
The Antarctic ice sheet is composed of ice,grain snow and first snow.The elevation change in the ice sheet is actually the common result of the changes in different material layers.Therefore,studying the elevation change of granular snow is a necessary condition for estimating the mass balance.Therefore,it is necessary to study the elevation change in grain snow to estimate the mass balance.
The study of the snow layer is mainly carried out by microwave detection and ground station observations.Microwave detection depends on the dielectric property of snow.The microwave scatterometer transmits polarized energy pulses to the ground,and some of them are scattered back to the scatterometer.The proportion of scattering echo is related to the characteristics of the surface of the illuminated area;therefore,the microblog scatterometer can provide the backscattering cross-section of the area irradiated by the antenna.Microwaves have a certain ability to penetrate dry snow layers,and the penetration of Ku band (12–18 GHz) microwaves in dry snow layers can reach the metre level.Surface scattering in snow is weak,body scattering is strong,and backwards scattering is dominated by volume scattering(Cheng,2004).However,when the water content increases due to snow melting,the penetration ability of microwaves immediately drops to the millimetre level,and the backscattering at this time is mainly determined by surface scattering.The effect of dry snow surface roughness on backscattering is negligible,but the effect of wet snow is significant,and the normalized backscattering cross-section of snow decreases with increasing snow humidity.Therefore,the temporal and spatial changes in Antarctic ice sheet melting can be monitored by backscatter changes (Cheng,2004;Wismann,2000).
In addition,since any object with a temperature higher than absolute zero will emit electromagnetic waves,when the content of liquid water increases by a small percentage from zero,the ability of snow to emit microwave radiation will be greatly increased.With the further increase in liquid water,the radiation ability of ice particles in deep snow will be reduced due to scattered radiation,and the microwave radiation energy of snow will begin to decrease.Studies have shown that the brightness temperature in bands greater than 10 GHz increases sharply at the onset of snowmelt and decreases sharply at the time of refreezing and thawing.Therefore,it is feasible in principle to detect the freezing and thawing of the Antarctic ice sheet by using the change information of brightness temperature(Stiles and Ulaby,1980).
Using microwaves to study the mass balance of the Antarctic ice sheet has always been an important method in the study of the Antarctic ice sheet.In 1994,Zwally and Fiegles used the microwave method to detect the Antarctic ice sheet.They used 19 GHz horizontal polarization brightness temperature datasets to calculate the difference between the daily brightness temperature and the annual average brightness temperature.It was considered that a melting event occurred when the difference exceeded the threshold (30 K) (Zwally and Fiegles,1994).In 2006,Picard and Fily used data from four microwave radiometers to study the freezing and thawing of the Antarctic ice sheet over a period of 26 years.Their results showed that the duration and extent of melting of the Antarctic ice sheet were closely related to the detection time(Picard and Fily,2006).
3.2.Ice thickness and subglacial topography
In 1957,Waite used an ice radar altimeter to measure the bottom of the Antarctic Ross Ice Shelf for the first time (Waite,1959).Since the 1960s,with the development of polar exploration technologies such as ice radar,the study of Antarctic ice thickness and subglacial terrain has become the focus of Antarctic scientific research.From 1967 to 1969,the Scott Polar Research Institute (SPRI) of the University of Cambridge in the United Kingdom,together with the National Science Foundation(NSF) and the Technical University of Denmark (TUD),carried out the first large-scale survey of ice thickness and subglacial topography in Antarctica(Siegert,1999).Since then,countries around the world have accelerated the exploration of the Antarctic ice sheet,established their own polar scientific research institutions and formulated research policies.For example,Italian scientists Tabacco et al.carried out radar survey work on Dome C from 1992 to 1995;measured the subglacial topography,landform and ice sheet thickness in this area;and gave the best location for drilling (Tabacco et al.,1998).From 1995 to 1997,Russian scientists Macheret et al.also used methods such as ice radar to measure ice thickness on King George Island(Macheret et al.,1997).In addition,Germany,the United Kingdom,Belgium,Japan and other countries have also organized large-scale joint exploration projects and gradually gathered data on ice thickness and subice topography covering most of Antarctica.In 2001,the British Antarctic Office combined the results of radar and other methods over the past 50 years to build the ice thickness and subglacial terrain database,BEDMAP,which is mainly based on ice radar data,including gravity,earthquake,drilling and other data (Lythe and Vaughan,2001).The database can provide the ice thickness model and subice topography of most parts of Antarctica,and its digital elevation model (DEM) resolution reaches 5 km,which provides good data support for the Antarctic ice sheet model and large-scale ice sheet research.However,in East Antarctica,especially the inland areas,there are still a large number of sparse or blank areas in the database,and bedrock interfaces have not been detected in many areas,which makes it difficult to meet the requirements of in-depth ice sheet research.
With the deployment of seismic stations in Antarctica in the past two decades,passive source methods have been increasingly applied to the study of shallow ice thickness.Hansen et al.(2010) successfully simulated the thickness of the ice sheet beneath several stations in East Antarctica using the p-receiver function approach.Yan et al.(2017)confirmed that the ice thickness results obtained by the teleseismic P receiver function method are basically consistent with the ice thickness results of the BEDMAP2 database.However,this method requires a large number of teleseismic events and long-term data collection,which greatly limits the application of the receiver function method in the harsh environment of Antarctica.In contrast,the H/V spectrum method can carry out subice structure imaging only by using seismic background noise and has the advantages and characteristics of not requiring long-term observations and recording of seismic events.For example,the method only needs to record tens of minutes of data on a portable three-component seismometer,which greatly improves the practicability and efficiency of the method.L′ev^eque et al.(2010) applied the H/V method to four stations in the Dome C region of Antarctica to infer the uppermost snow thickness and the seismic properties of several metres of snow in this region.Picotti et al.(2017)used this method to measure the thickness of glacial ice from tens of metres to approximately 800 m in Italy,Switzerland and West Antarctica and verified its feasibility and reliability.In addition,Yan et al.(2020) successfully calculated a relatively reliable ice sheet thickness using the teleseismic P-wave coda autocorrelation method.They believed that the autocorrelation method can be a good supplement to the receiver function method to calculate ice thickness.
At present,with the continuous deepening of Antarctic scientific research,the amount of Antarctic ice sheet data is increasing,and the data accuracy is increasing and has formed a precise coverage of most of the Antarctic ice sheet.In 2013,on the basis of BEDMAP,the British Antarctic Office added a large amount of the latest ice radar and gravity and magnetic data and launched BEDMAP2.This database,like BEDMAP,includes data such as ice surface elevation,ice thickness,and bedrock elevation (Fretwell et al.al.,2013).The database not only supplements the data detected by traditional methods but also introduces the data obtained based on satellite remote sensing technology and improves the interpolation algorithm;for example,it introduces the neural network algorithm for calculation in some areas lacking accurate measurement data.In general,compared with BEDMAP,the overall data volume and coverage area of BEDMAP have been improved.More importantly,the resolution of its ice thickness data has been increased from 5 km to 1 km.The research results of Antarctic ice thickness show that(Fig.3,the thickness of the ice sheet)98%of the Antarctic continent is covered by ice and snow and the average thickness of the ice sheet is approximately 2126 m.West Antarctica contains many ice shelves in which ice directly covers the sea,with an average ice thickness of approximately 1048 m.The ice sheet near the Byrd Subglacial Basin and Bentley Subglacial Trench is more than 3000 m thick;East Antarctica is dominated by ice sheets,which cover bedrock,with an average thickness of approximately 2146 m.The ice sheet located in the Astrolabe Subglacial Basin is as thick as 4800 m,which is also the thickest point of the ice sheet.If the Antarctic ice sheet melts completely,sea level will rise by approximately 58 m.In addition,according to BEDMAP2(Fig.4,bedrock elevation),the average elevation of Antarctic subglacial bedrock is 82.8 m.Generally,most of the East Antarctic bedrock is above sea level,while most of the West Antarctic bedrock is below sea level.According to BEDMAP,the lowest point is located in the Bentley Subglacial Trench,which is-2 496 m,while the lowest point of bedrock thus far is located at Byrd Glacier near the Jones Sea,which reaches -2 870 m.Further research suggests that deeper points may exist in many as yet unidentified regions(Fretwell et al.,2013).
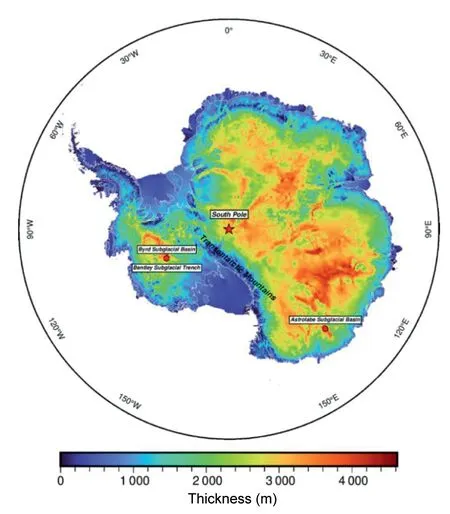
Fig.3.Map of ice sheet thickness (data from BEDMAP2).
The thickness of the Antarctic ice sheet and bedrock have been detected and studied for more than 70 years.Accurate Antarctic ice thickness and subglacial topography are of great significance to research in Antarctica and the entire Earth.However,thus far,there are still many areas with sparse or missing data,especially Princess Elizabeth Land near the Lambert Glacier.The lack of data greatly limits research on the impact of the mass balance in this area on the Lambert Glacier and even the entire Antarctic continent.Therefore,future research on the Antarctic ice sheet will strengthen the detection and imaging of sparse and blank areas based on existing data and improve the adaptability of working in complex environments by continuously improving existing detection methods.In addition,as the layout of seismic stations continues to mature,passive source seismology will become one of the main means of studying the Antarctic ice sheet.
3.3.Internal isochronous layers
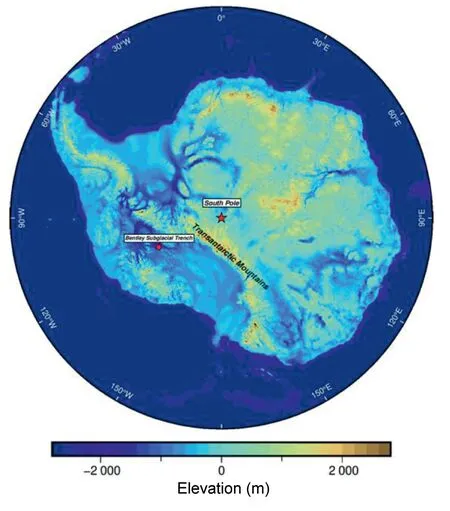
Fig.4.Map of bedrock elevation (data from BEDMAP2).
There is an obvious layering phenomenon of electromagnetic waves inside the ice sheet,and this layering is called the “isochronous layer”.The observation results of ice radar are not formed by simple superposition of radar reflection waves but by mutual interference of electromagnetic waves in different sections (Moore,1988).The results displayed on the radar image are actually the echoes of electromagnetic waves at different depths in the ice,and the reflection interface formed by these radar wave events is the isochronous layer inside the ice sheet.Theoretically,the isochrone is a layer of ice formed by the compaction of snow of approximately the same age or the interface between the ice and bedrock.Therefore,the isochronous layer is considered to reflect the internal structure of the ice sheet,especially the change in the dielectric properties of the ice sheet.One of the main applications of isochrone research is the location selection of deep ice-core drilling.In addition,it also plays an important role in research on ice sheet dynamics,ice sheet mass balance,ice sheet stability,and subglacial environments (Jacobel and Hodge,1995).
The isochrone layer reflects the dielectric change in the ice,and there are three main reasons for the difference in the dielectric properties of the ice sheet (Siegert et al.,2005): Different ice sheet densities lead to different dielectric constants.This factor dominates the top few hundred metres of the ice sheet,and the density of the ice sheet is almost constant beyond this depth.Changes in the acidity of ice cause changes in conductivity.In particular,the reflection of electromagnetic waves at a depth of approximately 700 m is basically due to this reason,and the origin of this acidity may be the product of volcanic aerosols contained in snow on the ancient surface.Increased stress in the deep part of the ice sheet changes the ice crystal structure,resulting in a change in the dielectric constant.An effective way to determine the cause of the isochrone layer of radar reflections is to use a dual-frequency or multifrequency radar system for detection and comparison and to analyse the characteristics of electromagnetic wave echo signals at different depths and localities of the ice sheet(Eisen et al.,2004;Fujita and Mae,1994).
In recent years,the focus of research has shifted from the causes of the isochrone to using the information contained in the isochrone to reveal ice flow processes,ice sheet dynamics,and subglacial hydrological systems of the ice sheet.Therefore,it is particularly important to fully understand the morphological characteristics of the isochrone layer.According to Drewry (1983),there are three main types of isochronous layers within the ice sheet (Fig.5): Good isochronous layers.This isochrone is continuous horizontally and can be traced continuously for at least 10 km and sometimes even hundreds of kilometres;this isochrone event is very smooth and is almost parallel within a short distance.Moderate isochrone.These isochrones can be traced back tens of kilometres,but they are not clear compared with the first type,and not all monolayers can be traced;such isochrones can usually fluctuate at wavelengths not smaller than the ice bed and with a greater amplitude.Poor isochronous layers.At this time,there may be internal reflections inside the ice sheet,but the ice radar data profile does not have an isochronous layer,which may be caused by ice flow;in addition,the lack of data may be related to surface energy scattering and the high-flying altitude of the detection aircraft.Different isochronous layer characteristics often represent different intraglacial and subglacial characteristics.Although Drewry divided isochronous layer types into three categories,the actual data are often more complex and changeable,representing more complex ice sheet structures and evolutionary characteristics.
At present,the application of the isochronous layer inside the ice sheet mainly includes deep ice-core dating and site selection,research on ice sheet dynamics,ice sheet mass balance,ice stability,subglacial environment,etc.(Tang et al.,2015).Siegert et al.(1998) used isochronous layers to connect Dome C with the Vostok ice core and found five continuous internal isochronous layers within the 500 km ice radar profile to date the location of Dome C Earth's deep ice core.Steinhage et al.(2001) simultaneously traced and dated the isochronous layers in the upper part of the radar profile of hundreds of kilometres in Dronning Maud Land(DML)and identified the candidate positions of the DML deep ice-core drilling plan.An assessment was made.The internal isochronous layer can also be used to study the flow history of the ice sheet and deformation processes inside the ice sheet and to evaluate the internal deformation and estimate the spatial distribution characteristics of the velocity field.Flat isochronous layers often indicate the presence of a subglacial lake,and many local uplifts and grooves in the isochronous layer above the subglacial lake indicate that the ice flow on the lake is influenced by the surface slope.Siegert et al.(2003)studied the interior isochrone of an ice stream at the front of the Transantarctic Mountains and found that there was a large area of surface ablation during the maximum of the last glaciation (85 000 years ago) (Siegert et al.,2003).The inner isochronous layer can help in the assessment of the mass balance of the ice sheet.Neumann et al.(2008) showed that the cross-section near the Ross Sea was nearly stable,but there was strong material expenditure there 200 years ago,which was attributed to the active Kamb Ice Stream at that time (Neumann et al.,2008).The estimation of ice sheet mass balance is closely related to ice sheet stability,and the internal isochronous layer becomes an important medium to study ice sheet stability.A deactivated ice flow enhancement unit was identified by internal isochronous layer folds in radar images of the Coats Land area of the Southeast Pole,and it is speculated that it may be caused by the blocking of ice flow at certain locations during the maximum of the last glacial period 20 000 years ago (Rippin et al.,2006).
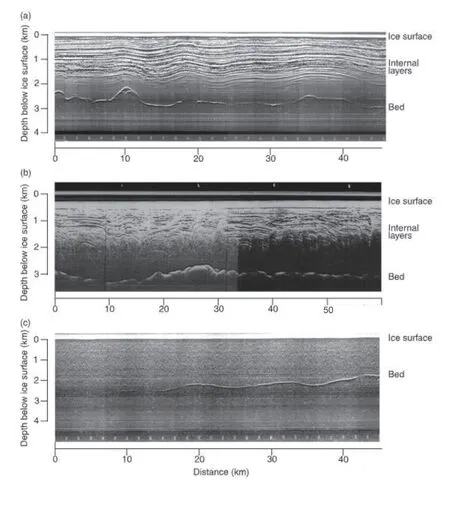
Fig.5.Types of internal layers (from Siegert et al.,2005) (a) Good internal layers;(b) Moderate internal layers;(c) Poor internal layers.
In the future,more detailed field research and clearer and more accurate data are needed to study isochronous layers inside the ice sheet.Meanwhile,new technologies and methods in other fields also need to be introduced,such as the accurate application of artificial intelligence technology in isochronous layer picking.The technological innovations of these methods are expected to greatly lead to research on isochronic layers (Rahnemoonfar et al.,2021).
3.4. Ice sheet anisotropy and ice temperature
Isochronous layers are recognized in ice radar detection within the ice sheet due to the difference in dielectric properties,and stratification also occurs in seismological detection due to the difference in vertical S-wave velocity (Fig.6,two-layer model of the ice sheet).Wittlinger and Farra(2012) found a strong negative conversion phase after the direct P wave in the process of studying the Antarctic ice sheet by using the P-wave receiver function method.They speculated that there is a low shear wave velocity layer between the upper ice sheet and the basement (Wittlinger and Farra,2012).After further study,they finally divided the ice sheet into two layers with obvious changes in shear wave velocity.The thickness of the upper layer is not constant,accounting for approximately two-thirds of the total thickness of the entire ice sheet,and its velocity is close to the value of the standard ice velocity (Vp~ 3.950 km/s,Vs~2.000 km/s).The lower layer,Vp,is close to the standard value,but Vs is reduced by 25% relative to the standard shear wave velocity value,the thickness is approximately constant,and the top of the lower layer of ice approaches the -30°C isotherm.They believed that this decrease in shear wave velocity is evidence for the preferred orientation of ice crystals and for the strong anisotropy induced by the soft and hard ice sheets,but how the soft and hard ice sheets emerged remains a matter of conjecture.This two-layer ice sheet model has been verified by Yan et al.(2018).When they used the H/V method to study the structure of the Antarctic ice sheet,they found that the forwards H/V spectrum of the two-layer ice sheet model was more consistent with the observed values during the forwards modelling of single-layer and double-layer ice sheet models (Yan et al.,2018).In 2015,Wittlinger and Farra revisited their research and noted that the observed low S-wave velocity cannot be explained solely by the strongly preferred ice crystal fabric orientation in the lower part of the ice sheet,and they believed that another influencing mechanism was unfrozen liquid (Wittlinger and Farra,2015).This was confirmed by Llorens et al.(2020),who,using anisotropy simulations of temperate ice,suggested that the observed drop inVs at the base of the ice sheet could be explained by the presence of basement water under high pressure (Llorens et al.,2020).In fact,past studies using RES surveys have found that two-thirds of the radio reflections above the ice sheet have high intensity,and the remaining one-third have low reflectance and cannot even receive the signal,but no explanation has been given for this “echo void”.It was not until 2012 that Wittlinger and Farra gave clear and stable results.
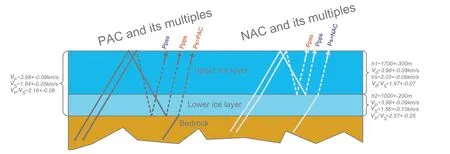
Fig.6.Two-layer model of ice sheet (modified from Wittlinger and Farra (2012) with permission).
PAC represents the positive amplitude Ps conversion phase,and NAC is the negative amplitude Ps conversion phase.
The difference in the S-wave velocity of the ice sheet is the research evidence for the seismic anisotropy of the ice sheet.The anisotropy of the ice sheet often reflects movement processes of the ice flow and is of great significance for the estimation of the mass balance evolution of the entire ice sheet and deep ice dating.In addition,the temperature of the ice sheet is also an important research target in the interior of the ice sheet: the ice flow and the sliding of the subglacial base are closely related to the temperature of the ice sheet,and the change in ice sheet temperature with depth also provides a basis for the study of palaeosurface temperature changes (Cuffey and Paterson,2010).
There are three main methods to study the internal temperature of the ice sheet.The first method is to simulate the temperature field of the ice sheet by providing accurate boundary conditions;the second method is to drill cores and directly measure the temperature inside the ice sheet;and the third method is to use the calculation of radar data to first calculate the average attenuation rate of radar waves and then infer the ice temperature based on the relationship between the radar attenuation rate and ice temperature.Although direct measurement is the most accurate way to obtain ice temperature,it is difficult to implement largescale drilling-core extraction.Therefore,a RES method proposed by Cheng (2020) based on MacGregor et al.(2015) used data from two ice radars in China for the first time to calculate the average temperature of ice in the Antarctic ice sheet.Finally,the average temperature in the measured area was approximately -40°C,and its temperature variation curve with depth was similar to that of the nearest Vostok ice core.Although Cheng's work has shortcomings,it is the first attempt to use radar data to calculate the average temperature in China and provides a new way to study the temperature of the Chinese Antarctic ice sheet.
Both the seismic anisotropy of the ice sheet and the temperature within the ice reflect changes in the properties of the interior of the ice sheet.In the future,on the basis of gradually increasing drill-core data,a variety of geophysical methods,including ice sheet simulation and ice radar detection,should be used for joint research,including multidisciplinary integration,in-depth exploration of internal properties and changes of the Antarctic ice sheet.
3.5.Subglacial lake
Since the 1950s and 1960s,when Russian geographer Andrei first proposed the existence of the“Eastern Lake”(Sarkar,2012),the study of subglacial lakes began to come into the view of scientists.However,due to the limitations of detection technology,people were not very interested in the study of subglacial lakes in the early stage and only conducted small-scale data collection.It was not until the 1990s that the RES method,capable of large-scale,long-range exploration,brought people back under the ice.Subglacial lakes are easy to identify in ice radar data because the isochronous layer at the ice–water interface is bright and flat,rather than rough like bedrock or the sediment interface (Siegert et al.,2016).At present,the detection of subglacial hydrological structures is mainly carried out by airborne geophysical detection and satellite remote sensing,among which ice radar is one of the most commonly used geophysical methods to detect the Antarctic ice sheet and subglacial hydrological structure,which can be used for both aerial and ground detection(Cui et al.,2009).In addition,satellite altimetry has been used several times to identify the presence of“active”subglacial lakes,analyse their connectivity,and determine their impact on freezing mechanics.For example,from 2003 to 2009,the Antarctic ice elevation measured along the orbit of the operating ICESat satellite was used to create the first continent-scale map of an “active” subglacial lake in Antarctica(Smith et al.,2009).
In 1994,the University of Cambridge,UK,and geophysicists and satellite observers who collected data jointly held a meeting aimed at revealing subglacial lakes from Antarctic data.Vostok lakes are at least 500 m deep(Kapitsa et al.,1996),which also makes people realize that these subglacial lakes provide possible habitats for microbial life in extreme environments and contain palaeoclimate information in Antarctica(Ellis-Evans and Wynn-Williams,1996).Therefore,to identify life in subglacial lakes while understanding the climate information recorded in their sediments,direct sampling measurements are required(Woodward et al.,2010).
From 2016 to 2017,the University of Texas Institute of Geophysics(UTIG) and the Korea Polar Research Institute (KOPRI) collaborated to use helicopter-borne radar and laser altimeters to conduct site selection for the David Glacier drilling project.To avoid drilling fluid pollution,the project used hot water drilling technology,which can recycle the meltwater produced by the ice sheet during the drilling process.It is a relatively advanced,scientific and environmentally friendly drilling technology that provided suitable means of access to the lake (Lindzey et al.,2020;Talalay,2013;Makinson et al.,2016).Although drilling is the most direct and accurate detection method for studying subglacial properties,it often requires more cost input than other methods and is difficult to implement on a large scale.
Advances in geophysical instruments have greatly promoted the understanding of subglacial properties,but due to the short observation period,it is still difficult to accurately elucidate subglacial dynamics,especially the influence of subglacial lakes on the evolution of the ice sheet.In recent years,with the development of remote sensing monitoring of subglacial lake discharge and observations of glacial acceleration,models simulating the ice sheet and its interaction with subglacial lakes have begun to attempt to explain the mechanisms of subglacial flow.Although the current model focuses on explaining subsurface geophysical processes rather than predicting future changes in ice sheet systems,it adds to our understanding of geothermal,heat flow,and basement conditions on the Antarctic ice sheet and further improves our understanding of ice–sea interactions(Pattyn et al.,2016).
To date,more than 400 lakes have been identified at the bottom of the Antarctic ice sheet (Fig.7,partial distribution of subglacial lakes in Antarctica)(Siegert et al.,2016;Siegert,2018).Vostok Lake is the largest known subglacial lake in Antarctica.Research shows that Vostok Lake has an area of more than 14 000 km2,a length of more than 250 km,a width of more than 50 km,an average water depth of 432 m,a maximum depth of 800 m,and a total volume of approximately 5 400 km2,making it the seventh largest lake in the world.In addition to direct detection,the distribution of subglacial lakes can also be predicted by simulation,and the accuracy of the prediction model can be verified by comparing the predicted location with the actual confirmed location of the lake.Both Livingstone et al.and Goller successfully predicted the distribution of subglacial lakes in Antarctica.The former predicted more than 60% of confirmed subglacial lakes by using a mathematical model based on theShieldequation.The latter accurately predicted 206 subglacial lakes,accounting for 54%of the known total(G¨oller,2014;Livingstone et al.,2013).Of course,not all subglacial lake distributions can be accurately predicted using such methods,but overall simulations suggest that there are more than 12 000 subglacial lakes at the base of the Antarctic ice sheet,accounting for approximately 3.7% of the total ice sheet area(Wolovick et al.,2013).In addition,MacKie et al.(2020)used binomial modular logistic regression to predict all subglacial lakes,showing that the total lake area was lower than previously predicted,and the results calculated based on the interpolated terrain model were higher(MacKie et al.,2020).
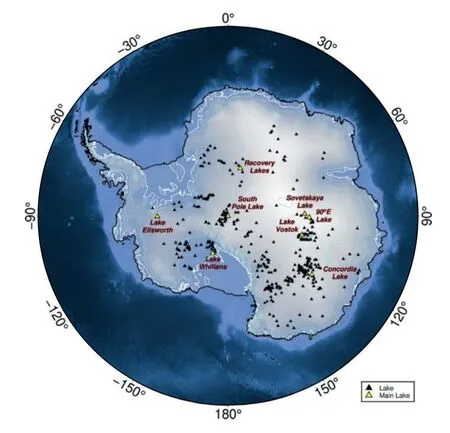
Fig.7.Partial subglacial lake distribution in Antarctica (modified from Wright and Siegert (2012) with permission).
3.6.Subglacial sedimentary basins
Subglacial structures are complex and diverse.In addition to focusing on subglacial lakes,people also give special attention to sedimentary basins that are closely related to lakes.Sediments play an important role in shaping subglacial water systems,such as the massive canal system found in the subglacial sedimentary basin of Thwaites Glacier in West Antarctica (Schroeder et al.,2013,2014).At the same time,sediments extracted from subglacial aquatic environments offer unique research opportunities to study palaeoenvironments and palaeoclimates: these sediments can often provide data older than ice cores,including the history of the overlying ice sheet,ice interactions with the hydrological system,life forms in extreme habitats,etc.(Gong et al.,2019).Therefore,it is also extremely important to obtain subglacial sediment samples(Fig.8,some drilling locations in Antarctica).
Seismic reflection profiles can confirm the existence of layered subglacial sediments in large areas of Antarctica,such as South Pole Lake and Lake Vostok with a thickness of more than 100 m and Lake Ellsworth with a thickness of at least several metres.The Wilkes Subglacial Basin(WSB) is considered to be the largest sea-based basin of the Southeast Pole.Frederick et al.(2016)provided the first quantitative estimation of the extent,thickness and characteristics of WSB sediments.They combined extensive airborne geophysical data to assess the boundary,area,and thickness properties of subglacial sedimentary basins.The research shows that the thickest sediment in the southern WSB is over 3.5 km,while the thickest sediment in the northern part is over 2.5 km,and the average thickness in the southern part is significantly greater than that in the northern part.Significant increases in the thickness of subglacial sediments in the southern part support the hypothesis of relative stability within the entire WSB since the middle Miocene,while more frequent Pliocene to Pleistocene ice sheet retreat/advance cycles affected the northern WSB across century-millennium timescales (Frederick et al.,2016).
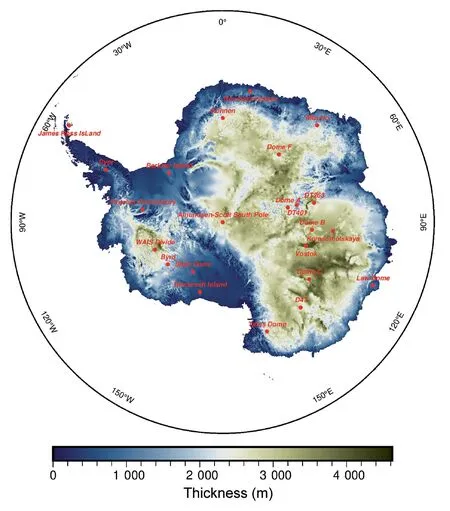
Fig.8.Some drilling positions in Antarctica(Modified from Zhang et al.(2014)with permission).
The presence of subglacial sediments can also affect data observations of the ice sheet.The seismic detection results of Anandakrishnan and Winberry (2004) showed that the presence of subglacial sediments affects the receiver function results.The receiver function is sensitive to the wave impedance interface,but because the wave impedance between the ice and sediment is small,the receiver function does not generate additional seismic phases at this interface (Anandakrishnan and Winberry,2004).After simulation,it was found that when the sediment thickness reaches 50 m,the multiple waves are delayed by approximately 70 ms.Based on this,if the ice sheet thickness obtained by independent methods is known,the difference in the receiver function data can be used to calculate the thickness of the sedimentary layer under the ice.The method can also be used to better constrain airborne geophysical survey datasets and satellite gravity data.
To obtain sediment samples in different subglacial environments,researchers have developed a variety of sampling devices(Hodgson et al.,2016).Examples include short corers for collecting undisturbed sediment–water interface samples;for deeper,harder samples,manual,hydraulic and electromechanical impact hammer corers,etc.,have been used.In the future,with the increasing demand for cores,samplers that can obtain multiple cores in rapid succession will be the focus of research and development.
The bottom picture shows the thickness of the ice sheet.
4.Future research prospects
In recent decades,with the intensification of global climate change,melting and disintegration events at the bottom of the ice shelf have gradually increased,and the supporting role of the ice shelf on the stability of the ice sheet has weakened,resulting in accelerated loss of Antarctic ice sheet material(Depoorter et al.,2013;Rignot et al.,2013).
In 2019,the Intergovernmental Panel on Climate Change (IPCC)released theSpecial Report on the Ocean and Cryosphere in a ChangingClimate,which noted that the mass loss of the Antarctic ice sheet from 1992 to 2001 was 51±73 Gt yr-1,and its loss increased to 199±26 Gt yr-1 from 2012 to 2016(Meredith et al.,2019).
On September 23,2020,a study published inNatureby Garbe et al.(2020)from the Potsdam Institute for Climate Impact Research in Germany concluded that if global warming continues unchecked,the melting of the Antarctic ice sheet will soon become irreversible(Fig.9).Their simulations showed that if the Earth's average temperature was to rise by 4°C Orthography above preindustrial levels,most of the ice sheet in the West Pole would collapse,global sea levels would rise by 6.5 m,and major cities such as New York,London,Tokyo and Shanghai would be submerged.According to the IPCC,at current levels of greenhouse gas emissions,the worst-case scenario is a global average temperature rise of 5°C Orthography by 2100.If the Earth's average temperature rises 6°C to 9°C Orthography higher than that before the Industrial Revolution,70%of Antarctica's ice sheet will irreversibly disappear.Above 10°C,the Antarctic continent will be ice free,back to the situation more than 30 million years ago,and the Earth's sea level will rise 58 m.
Therefore,the study of the Antarctic ice sheet faces great challenges and great urgency.In April 2014,the Scientific Committee on Antarctic Research(SCAR)brought together 75 scientists and policy-makers from 22 countries to adopt its Antarctic Research Priorities for the next 20 years and beyond.This is the first time that the International Association for Antarctic Studies has developed a collective opinion through discussion,debate and voting.Ultimately,the SCAR whittled down hundreds of scientific questions to the 80 most pressing questions.The issues related to the ice sheet and subglacial structure can be summarized into two important topics: one is to reveal the history of Antarctica,the structure of the crust and mantle,and its influence on the creation and separation of the Antarctic continent;the second is to understand how,where and why glaciers are disappearing,including the causes and impacts of the current accelerated melting of Antarctic sea ice (Kennicutt et al.,2014).
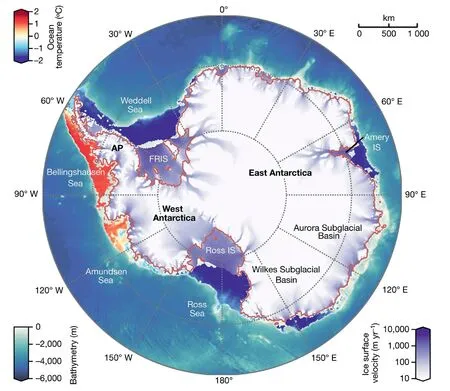
Fig.9.Antarctic ice velocities and surrounding ocean temperatures (from Garbe et al.(2020) with permission).
Therefore,the exploration of the Antarctic ice sheet is no longer a subject that a single discipline or a single country can undertake.Future research on the Antarctic ice sheet will be multidisciplinary and multinational.Currently,the SCAR has 45 member countries(34 full members and 11 associate members) and 9 ISC alliances.With the deepening of international multilateral cooperation,more countries are expected to join the ranks of Antarctic research.Although research on the Antarctic continental ice sheet has achieved fruitful results for decades,there are still deficiencies in detection methods,which restrict further research on Antarctica.For example,ice radar produces detection blank areas in warm ice areas and ablation areas,and it is difficult to solve the outstanding contradiction between resolution and detection depth;due to the particularity of the Antarctic ice sheet,it is difficult to form a wide coverage area and a dense seismic network;and in addition to aviation and satellite methods,other traditional geophysical detection methods,such as core drilling,have high logistical and detection costs.
In the future,countries around the world will continue to expand the exploration of Antarctica on the basis of the original data,fill in gaps,gather data in sparse areas,and use more scientific algorithms to reveal information about the ice sheet and under the ice.At present,BEDMAP3 is already in the process of construction.It will provide the world with the most comprehensive and accurate measured data and will release and share the original data of ice thickness and subglacial terrain for the first time.In addition,it also introduces data based on“matter conservation”,and new deep methods such as learning algorithms promote and facilitate further research on Antarctica by countries around the world.
Looking forwards to the future,passive seismic methods will play an increasingly important role in the study of the Antarctic ice sheet,and a variety of shallow seismic methods have been developed and are mature.Compared with broadband seismic detection,short-period dense array observation technology has advantages such as high resolution,low cost,short observation period and green environmental protection (Zhang et al.,2020) and is expected to play an important role in the study of Antarctic ice sheet structures.In addition,the newly developed distributed acoustic sensor(DAS)technology is characterized by its advantages of tolerance to complex environments,high acquisition density,wide frequency range,low cost,and adaptability to complex and extreme conditions (Wang et al.,2021) in Antarctic ice sheet research,seismic/microseismic monitoring and other fields.With the development of UAV technology,UAVs with a large load capacity,long endurance and good stability are also expected to be gradually more widely used in Antarctic scientific research.For example,in view of the difficulties and characteristics of the special environment and complex terrain in Antarctica,unmanned aerial vehicles with ice radar can be used to carry out operations in Antarctica.As satellite communications improve,researchers are expected to be able to remotely detect dangerous areas,especially ice shelves,crevasses,and sea ice conjunctions.
China has built four scientific research stations in Antarctica,namely,the Great Wall,Zhongshan,Taishan and Kunlun stations.The areas along and near Zhongshan Station,Taishan Station,and Kunlun Station at the southeastern pole (including open rock areas such as Grove Mountain,the eastern edge of the Emory Ice Shelf– Southwest Prize Bay,North Prince Charles Mountain,Brown Mountain,Reiur Islands and West Fall Hill)are the key areas of our Antarctic research.After more than 20 years of development,Chinese research on the Antarctic ice sheet has made rich achievements,but because of the late start,although earthquake stations were set up near the research stations(Chang et al.,2012),it is not enough to form large-scale systematic seismological research.At present,the exploration area is still at the edge of the Antarctic continent,and less is involved within 80°S.
In summary,Antarctic research faces large challenges and strong urgency.Aiming at hot issues such as Antarctic geological evolution,glacial retreat,ice sheet melting and their relationships with global climate change,it is the frontier and trend of future Antarctic ice sheet research to carry out multidisciplinary and multicountry comprehensive geophysical exploration based on the traditional ice radar method combined with the passive seismic method,UAVs,artificial intelligence and other new technologies.
5.Conclusion
(1) Although the conventional geophysical exploration methods represented by aerial and land ice radar have limitations,they are still the main exploration methods on the Antarctic ice sheet.With the extensive deployment of passive seismic stations,passive seismic methods will become an important research means.The passive seismic receiver function imaging method,H/V spectral ratio method and P-wave tail autocorrelation method based on passive seismic data have set up successful models in the field of Antarctic ice thickness and subglacial structure research.
(2) The BEDMAP2 database based on a variety of geophysical data has improved the coverage of data,updated data information,and raised data resolution to 1 km.
(3) Ice radar detection shows that the three types of internal isochronous layers are closely related to the evolution of the ice sheet and play an important role in the dating and site selection of deep ice cores,the study of ice sheet dynamics,and the subglacial environment.Both cover anisotropy and ice temperature are closely related to ice flow.The ice sheet double-layer model is considered to be evidence of ice sheet anisotropy.Using RES data to infer ice temperature is an effective attempt to study ice temperature changes.
(4) Ice radar,drill coring and numerical simulation are the main research methods for subglacial lake research.Simulations show more than 12 000 subglacial lakes in Antarctica,of which more than 400 have been detected and identified.
(5) Research in Antarctica is facing enormous challenges and is of great urgency.Future Antarctic research will feature interdisciplinary and multinational cooperation.Passive seismic detection methods,especially short-period dense array technology,distributed fibre-optic acoustic sensor technology,unmanned aerial vehicles and artificial intelligence,have good application prospects in the study of the Antarctic ice sheet and subglacial structures.
Declaration of competing interest
The authors declare that they have no known competing financial interests or personal relationships that could have appeared to influence the work reported in this paper.
Author agreement and Acknowledgments
The authors declare that the work described was original research that has not been published previously and is not under consideration for publication elsewhere,in whole or in part.All the authors listed have approved the manuscript that is enclosed
We would like to thank two anonymous reviewers for their constructive to significantly improve the manuscript.The National Natural Science Foundation of China (91858214,42130807) funded this study.
 Earthquake Research Advances2023年3期
- Earthquake Research Advances的其它文章
- Advances in experiments and numerical simulations on the effects of stress perturbations on fault slip
- A palaeoearthquake event and its age revealed by the travertine layer along the Litang fault in the southeastern margin of the Qinghai-Tibetan plateau
- Indian plate blocked by the thickened Eurasian crust in the middle of the continental collision zone of southern Tibet
- Influences of across-strike heterogeneous viscosity on the earthquake cycle in a three-dimensional strike-slip fault model
- Detailed sedimentary structure of the Mianning segment of the Anninghe fault zone revealed by H/V spectral ratio
- Freely accessible inventory and spatial distribution of large-scale landslides in Xianyang City,Shaanxi Province,China