
Indian plate blocked by the thickened Eurasian crust in the middle of the continental collision zone of southern Tibet
2023-11-08 02:22:48GaochunWangXiaoboTianYibingLiTaoXuBoWanYiChenShitanNieXusongYangSichengZuoJianliZhang
Earthquake Research Advances 2023年3期
Gaochun Wang ,Xiaobo Tian ,Yibing Li ,Tao Xu ,Bo Wan ,Yi Chen* ,Shitan Nie,Xusong Yang,Sicheng Zuo,Jianli Zhang
a State Key Laboratory of Lithospheric Evolution,Institute of Geology and Geophysics,Chinese Academy of Sciences,Beijing,100029,China
b Geothermal and Ecological Geology Research Center,School of Ecology and Environment,Zhengzhou University,Zhengzhou,450001,China
c Innovation Academy for Earth Science,CAS,Beijing,100029,China
d Frontiers Science Center for Deep Ocean Multispheres and Earth System,Institute for Advanced Ocean Study,Ocean University of China,Qingdao,266100,China
e Laboratory for Marine Mineral Resources,Pilot National Laboratory for Marine Science and Technology (Qingdao),Qingdao,266237,China
Keywords:Qinghai-Tibetan Plateau Indian lithospheric slab Wide-angle reflection/refraction Crustal P-wave velocity structure Crustal thickening
ABSTRACT The relationship of the crustal contact between the Indian and Eurasian plates is a key issue in understanding crustal thickening and the subduction of the Indian lithosphere beneath the Qinghai-Tibetan Plateau.Across the middle of the Yarlung-Zangbo Suture (YZS),we deployed an~450-km-long SN-trending wide-angle reflection/refraction profile to observe the P-wave velocity (vP) structure beneath the northern Himalaya and the southern plateau.Our results show that,1.the high vP(~7.1 km/s)indicates that the Indian lower crust extends no more than 50 km north of the YZS.2.The lower crust beneath the southern part of the plateau features an extremely low vP (<6.7 ± 0.2 km/s).3.Compared with the velocities of several typical crustal lithologies in different temperature regimes,the low vP in the lower crust can be explained by felsic-intermediate granulite,which has prevented the lower crust from further eclogitization.We propose that the dip angle of the Indian lithospheric slab beneath the YZS is partly controlled by the composition of the lower crust of the plateau.In the northern middle YZS,the crust of the southern plateau is too thick and blocks the northward advancement of the Indian lower crust,resulting in the subduction of the Indian lithospheric slab into the upper mantle.The lower crust in western and eastern Lhasa is dominated by a mafic composition,and it was delaminated after eclogitization before the Miocene.The void zone generated by delamination favors the flattening and underthrusting of the Indian lower crust.
1.Introduction
The ongoing continental-continental collision between the Indian and Eurasian plates has produced the Qinghai-Tibetan Plateau since the Cenozoic (Yin and Harrison,2000).The Qinghai-Tibetan Plateau,the largest plateau on Earth today,is supported by an extremely thick crust,especially in the southern Qinghai-Tibetan Plateau,where the crustal thickness reaches~80 km,which is twice that of the normal continental crust(Owens and Zandt,1997;Zhang et al.,2011).How this thick crust has formed and been preserved has been debated over the past several decades.
Eurasian crustal compression and shortening (All′egre et al.,1984;Dewey and Burke,1973;England and Houseman,1986;Houseman and England,1993) and mantle magmatic underplating derived by both the subducted Neo-Tethyan oceanic crust and the subducted Indian continental crust(Mo et al.,2007;Mo et al.,2008;Zhu et al.,2017)have been considered to play main roles in forming the thick crust beneath the Qinghai-Tibetan Plateau.Based on crustal structure images along several receiver function profiles,the flat underthrusting Indian lower crust has also been proposed to contribute to crustal thickening beneath the southern part of the plateau(N′abelek et al.,2009;Schulte-Pelkum et al.,2005;Shi et al.,2015;Wittlinger et al.,2009;Zhang et al.,2014).The changes in the subduction angle and northward horizontal stretching distance of the Indian continental slab in the east-west direction(Li et al.,2008;Zhao et al.,2010),however,suggest spatially varying contact relationships between the Indian crust and the Eurasian crust along the collision zone.
Studies of whole-rock or mineral geochemical signatures(Zhu et al.,2017) indicate that the crustal thickness beneath the southern Qinghai-Tibetan Plateau reached~70 km at approximately 20–10 Ma.Lower crustal mafic rocks can transfer to eclogite facies at depths exceeding 50 km [O Brien and R¨otzler,2003].High-density eclogites,which are denser than mantle peridotites,become potentially gravitationally unstable to founder into the deep mantle (Lee and Anderson,2015).In this case,it is almost impossible to increase the crustal thickness to 80 km,and the extremely thick crust beneath the Qinghai-Tibetan Plateau is therefore unstable and short-lived.Petrologic observations and experimental studies have indicated that eclogitization is not only controlled by pressure and temperature conditions but also influenced by whole-rock composition (De Paoli et al.,2012;Green and Ringwood,1972).The composition of crustal rocks (especially the lower crust) remains largely speculative in Tibet due to the rarity of xenoliths and exhumed lower crustal granulites,which are direct evidence for constraining the composition of the lower crust (Chan et al.,2009;Kang et al.,2020).
The seismic P-wave velocity (vp) is another way to constrain the petrological features of the crust (Christensen and Mooney,1995).The wide-angle reflection and refraction (WARR) method is a recognized approach to obtaining the crustal P-wave velocity (vP);however,the WARR profiles are sporadically distributed in the southern Qinghai-Tibetan Plateau (Fig.1),which were deployed several decades ago before the advent of high-precision digital seismographs(Teng et al.,1983;Xiong and Liu,1997;Zhang et al.,2011;Zhang and Klemperer,2010;Zhang and Klemperer,2005),resulting in insufficient constraints on the crustalvP,especially the lower crust of the plateau.
In the middle of the continental collision zone,southern Lhasa has the thickest crust on the plateau (Zhang et al.,2011),and the Himalayan orogen features the most intense crustal deformation,as indicated by Mount Everest and HP-UHP rocks (Guillot et al.,2008;Lombardo and Rolfo,2000;Zhang et al.,2015).Therefore,we deployed a WARR profile from the Bangong-Nujiang suture (BNS) to the Tethyan Himalaya (TH)along 88.5°E longitude to investigate the velocity structure of the whole crust.We used the high-resolution crustalvPto constrain the deep crustal composition as well as the relationship between the crust beneath the southern Qinghai-Tibetan Plateau and the northward advancing Indian lithosphere.

Fig.1.Geological map of the southern Qinghai-Tibetan Plateau and the location of the wide-angle reflection and refraction (WARR) profiles.Blue circles show the stations along the seismic profile,and red stars with numbers mark the shots.The geological map is compiled by Kapp et al.(2005),Wang et al.(2013),and Zhang et al.(2010).The faults are modified from Taylor and Yin (2009),Zhu et al.(2011),and Hou et al.(2015).The sutures between terranes are plotted as bold dashed lines.The distributions of adakite rocks are compiled from Chung et al.(2003) and Guo et al.(2013).The black stars show the locations of the high-to ultrahigh-pressure metamorphic rocks (Guillot et al.,2008;Zhang et al.,2015).Double railway lines denote receiver function doublets marked by the numbers in the circles.1: Zhang et al.(2014),2: Xu et al.(2017),3: N′abelek et al.(2009),4: Xu et al.(2015),5: Kind et al.(2002),6: Shi et al.(2015).The previous wide-angle reflection/refraction profiles (marked by the Roman numerals in the circles) are also included;I: Xiong and Liu (1997),II: Liu (2003),III: Zhang and Klemperer(2010),IV: Teng et al.(1983),V: Zhang and Klemperer (2005),VI: Zhao et al.(2001).In the inset map,the black rectangle denotes the study area.AKMS=Ayimaqin-Kunlun-Muztagh suture;JS=Jinsha suture;BNS=Bangong-Nujiang suture;YZS=Yarlung-Zangbo suture;KQT=Kunlun-Qilian terrane;SGT=Songpan-Ganze terrane;QT=Qiangtang terrane;LT=Lhasa terrane;SNMZ=Shiquan River-Nam Tso M′elange Zone;LMF=Luobadui-Milashan Fault;PXR=Pengqu-Xianzha rift;TYR=Tangra YumCo rift;MBT=Main Boundary Thrust;GCF=Gyaring Co Fault;HP-UHP=high-to ultrahigh-pressure metamorphic rocks.
2.Tectonic setting
The Qinghai-Tibetan Plateau (Fig.1) is formed by the amalgamation of several terranes (All′egre et al.,1984;Chang et al.,1986;Yin and Harrison,2000),from north to south,including the Kunlun-Qilian terrane (KQT),the Songpan-Ganzê terrane (SGT),the Qiangtang terrane (QT),the Lhasa terrane (LT) and the Himalaya,which are separated by the Ayimaqin-Kunlun-Muztagh suture (AKMS),Jinsha suture(JS) and Bangong-Nujiang suture (BNS),respectively. The Yarlung-Zangbo Suture (YZS) is recognized as the collision boundary between the Indian and Eurasian plates separating the Lhasa terrane and the Himalayas.The Qinghai-Tibetan Plateau is underlain by a thick crust with an average elevation of~4 000 m.Based on broadband seismic arrays in the plateau,receiver function studies have shown that the average crustal thickness is approximately 65 km,and the crustal thickness is largest (more than 80 km) in the southern Lhasa terrane and decreases northward to less than 65 km beneath the BNS.Beneath the Himalayas,the crust thickens from 40 km in the northernmost Indian plate to 70-80 km under the YZS (Kind et al.,2002;Mitra et al.,2005;N′abelek et al.,2009;Schulte-Pelkum et al.,2005;Shi et al.,2016;Wittlinger et al.,2009;Xu et al.,2017;Yuan et al.,1997;Zhang et al.,2014).
Receiver function images show a continuous positive phase 15 km above the Moho,which has been interpreted as the top of the Indian lower crust intruding into the plateau crust (N′abelek et al.,2009).Almost all studies of N-S-trending broadband arrays across the western or eastern part of the YZS (Fig.1) suggest that the Indian lower crust presents as a~150-km-long flat-lying layer on the bottom of the Lhasa crust (Kind et al.,2002;N′abelek et al.,2009;Shi et al.,2016;Xu et al.,2015,2017;Zhang et al.,2014).Based on seismic reflection images,however,Guo et al.(2017) proposed that the Indian lower crust,accompanied by mantle lithosphere,subducts into the upper mantle beneath the middle of the YZS with a north-dipping angle of~27°–45°.Local earthquake tomography revealed a highvP(>7.0 km/s) in a depth range from 50 to 70 km,which explains the partial eclogitization of the Indian lower crust beneath the Himalayas (Monsalve et al.,2008).Studies of a W-E-trending WARR profile in the Himalaya,however,obtained avPof the Indian lower crust of less than 7.0 km/s (Teng et al.,1983;Zhang et al.,2004).Unlike the eclogitized Indian lower crust (vP>7.3 km/s) (Wittlinger et al.,2009) interpreted by receiver function results,two N-S-trending WARR profiles crossing the YZS showed that thevpis less than 7.0 km/s in the lower crust beneath the southern Lhasa terrane (Liu,2003;Teng et al.,1983).In the northern Lhasa terrane,a slightly highvP(6.9–7.2 km/s) in the lower crust was detected under a W-E-trending WARR profile (Zhang and Klemperer,2005).Along the INDEPTH-III profile,WARR results showed that thevPof the lower crust increases from 6.5 km/s at a depth of 47 km–7.3 km/s at a depth of 67 km (Zhao et al.,2001).
The Lhasa terrane can be divided into the northern,central,and southern Lhasa terrane (Hou et al.,2015;Zhu et al.,2011) based on differences in the sedimentary cover (Fig.1).These three subterranes are separated by the Shiquan River-Nam Tso M′elange Zone (SNMZ) and Luobadui-Milashan Fault (LMF) (Zhu et al.,2011) from north to south(Fig.1).The central Lhasa terrane has Proterozoic and Archean basement rocks based on Hf isotope anomaly results,but the southern and northern Lhasa terranes have Phanerozoic juvenile crust (Hou et al.,2015;Zhu et al.,2011).Petrogenetic studies show that the closure of the Neo-Tethyan Ocean and the Indo-Eurasian continental collision created widespread volcanic rocks and crustal thickening in the Lhasa terrane(Chung et al.,2005;Coulon et al.,1986;Harris et al.,1990;Molnar et al.,1993;Yin and Harrison,2000;Zhu et al.,2009).The most prominent magmatic events are the Cretaceous-Tertiary Gangdese batholith and the Linzizong volcanic succession(~65-40 Ma)(All′egre et al.,1984;Coulon et al.,1986;Murphy et al.,1997;Yin and Harrison,2000).Recent petrological evidence suggests that upwelling mantle material and magmatic differentiation have a profound effect on crustal thickening(~15-20 km)in southern Tibet based on abundant magmatism,including large-scale cotemporaneous felsic magmatic rocks (~70-45 Ma) in the Gangdese magmatic belt and widespread Linzizong volcanic succession(~65-40 Ma)(Mo et al.,2007;Mo et al.,2008;Zhu et al.,2017).
3.Seismic data and methods
We carried out a 450-km-long south-north WARR profile from the Himalayas through the YZS to the BNS along approximately 88.5°E(Fig.1)from September to October 2016.Because of the extremely harsh environment,seismic stations were deployed along the only road near the Pengqu-Xianzha rift(PXR)from Gangba to Selin Co Lake.The profile was composed of 311 digital seismic stations equipped with 2.5-Hz-short period 3-D component geophones,with a spacing of 1.3 km and sampling of 100 Hz.Seismic signals were produced by 10 shots with an interval of~45 km,including four large shots(4 t of dynamite)at the two ends of the profile(shot 01,shot 02,shot 09 and shot 10)and six shots with 2 t of dynamite(shots 03-08).The shot parameters are shown in Table S1.Each shot was triggered in a borehole pattern at a depth of~50 m.The clock in the seismic instrument was set by a GPS time service system 1-12 hr before each shotting.As a result,~0.025 s of time bias could be introduced into our data by an automatic crystal oscillator.We obtained 5-minute-long records at all 311 seismic stations for each shot.Some station records were noisy due to strong winds and are rejected in further studies.Shot 02 with 4 t of dynamite only produced records with a small offset by failure blasting.
In the WARR method,data processing generally consists of three steps,including data preprocessing,seismic phase identification,and velocity structure inversion.During preprocessing,the raw seismic data were reduced by 6.0–8.0 km/s.Seismic phases from the crust and upper mantle were identified,and travel times were picked by using the szplot(Piotr ′Sroda modified the zplot of C.A.Zelt) (Zelt and Smith,1992)software package after filtering the data at 2-10 Hz.The 2-dimensional P-wave velocity structure of the shallow crust was calculated by the finite difference method (Hole,1992;Vidale,1988) using the first arrivals of the diving wave in the sediment and the crystalline upper crust in all seismic sections.Then,we used the software packages FAST (Zelt and Barton,1998)and RAYINVR(Zelt and Smith,1992)to construct the whole crust and uppermost mantle velocity structure.Velocity modeling was performed following the ‘‘across and down’’ approach (Zelt and Smith,1992) in which the early seismic phase was fitted to obtain a shallow structure,which was used as the input model for the deep structure to fit the late seismic phase.After data preprocessing,the first arrivals (the Pgphases refracted from the sedimentary cover and the crystalline basement) can be traced to more than 100 km in almost all shots(Fig.2,S1 and S2,and Table 1).The later arrivals are characterized by a relatively low signal-to-noise ratio(SNR)due to the thick crust in the south-central Qinghai-Tibetan Plateau (Liu,2003;Owens and Zandt,1997;Zhang et al.,2011).There are several rules for picking seismic reflection phases in the crust.First,the theoretical time-distance curve of the reflection arrivals of the horizontal interface is hyperbolic.Based on this principle,we picked arrivals with a high signal-to-noise ratio first.Second,these traces with relatively low signal-to-noise ratios were filtered by different frequency ranges to improve the SNR,and then we picked the arrivals reflected on the interface traced by high SNR arrivals.Third,the point at which frequency changed along one trace was also used to recognize the arrival near the hyperbolic time-distance curves.Finally,the reciprocity arrivals were used to improve the precision of the picks.Following the approaches mentioned above,the seismic reflection phases,including the arrival times of the P waves reflected from the crustal discontinuities (Pc1P,Pc2P,Pc3P,Pc4P and Pc5P) and arrivals reflected from the Moho discontinuity (PmP),were chosen individually(Fig.2 and S2-3,and Table 1).To obtain a more crediblevPvelocity model picks with large uncertainties were rejected in this study.As a result,3 337 picks were chosen,which is less than the 3 665 picks in the previous study of this profile by Wang et al.(2021).For the reflections,we assumed that all the reflections are supercritical reflections.The apparent velocity at the beginning distance (the critical point) of the reflections represents the velocity beneath the interface,and the apparent velocity at the far end of the reflections is the maximum velocity above the interface (Table 1).The influence of the dipping interface on the velocities could be corrected from ray tracing and arrival time inversion.Diving waves,Pn(refractions from the uppermost mantle),were used to invert the uppermost mantle velocity directly.
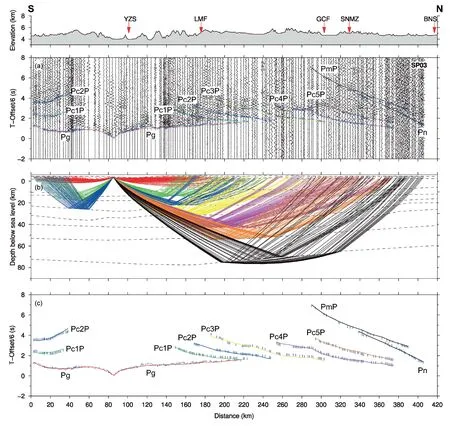
Fig.2.Seismic sections of shot 03 with phase picks,ray tracing and travel time fitting results.The travel time is reduced by a velocity of 6.0 km/s.The uppermost slice shows the elevations and locations of the main faults along the seismic profile.(a)Seismic section with picks(blue crosses)and the calculated times(colored lines).(b)Ray paths are calculated from the final velocity model in the shot 03 section.The rays of different phases are distinguished by the same colors as those in(a).(c)Picks(blue bars) and calculated times (colored lines);the length of the bars denotes the uncertainty of the picks.
V1*is the apparent velocities at the beginning distance (the critical point) of the reflections which represents the velocity beneath the interface.V2*is the apparent velocity at the far end of the reflections is the maximum velocity above the interface.
4.Results
4.1.Model reliability analysis
Approximately 99.5%of the arrival times were used to calculate the 2-D velocity structure(Table S2).The calculated arrivals of all phases fit the real seismic data well (Fig.S4c,Table S2).The ray coverage of the Moho and upper mantle show that they can constrain the central profile between 110 km and 330 km distances well(Fig.S4b).An uncertainty of 150 ms is associated with all arrival time picks.The root mean square(RMS) of the travel time residuals (tRMS) between the modeling and observations are less than 110 ms for each shot (Table S2).The smaller the chi-squared value is,the closer the calculated model is to the true model (Zelt and Smith,1992).A χ2<1.65 is achieved for every shot(Table S2),except for the noneffective propagation of shot 02.For every seismic phase,a χ2<2.59 is acquired (Table S2).We use the diagonal values of the resolution matrix to measure the model reliability fordepths and velocities (Zelt,1999;Zelt and Smith,1992).Both the velocity and depth perturbations are inverted at both depth and velocity nodes.Resolution tests (Fig.S5) show that all velocity nodes and the depth nodes are well resolved in the areas with good ray coverage.
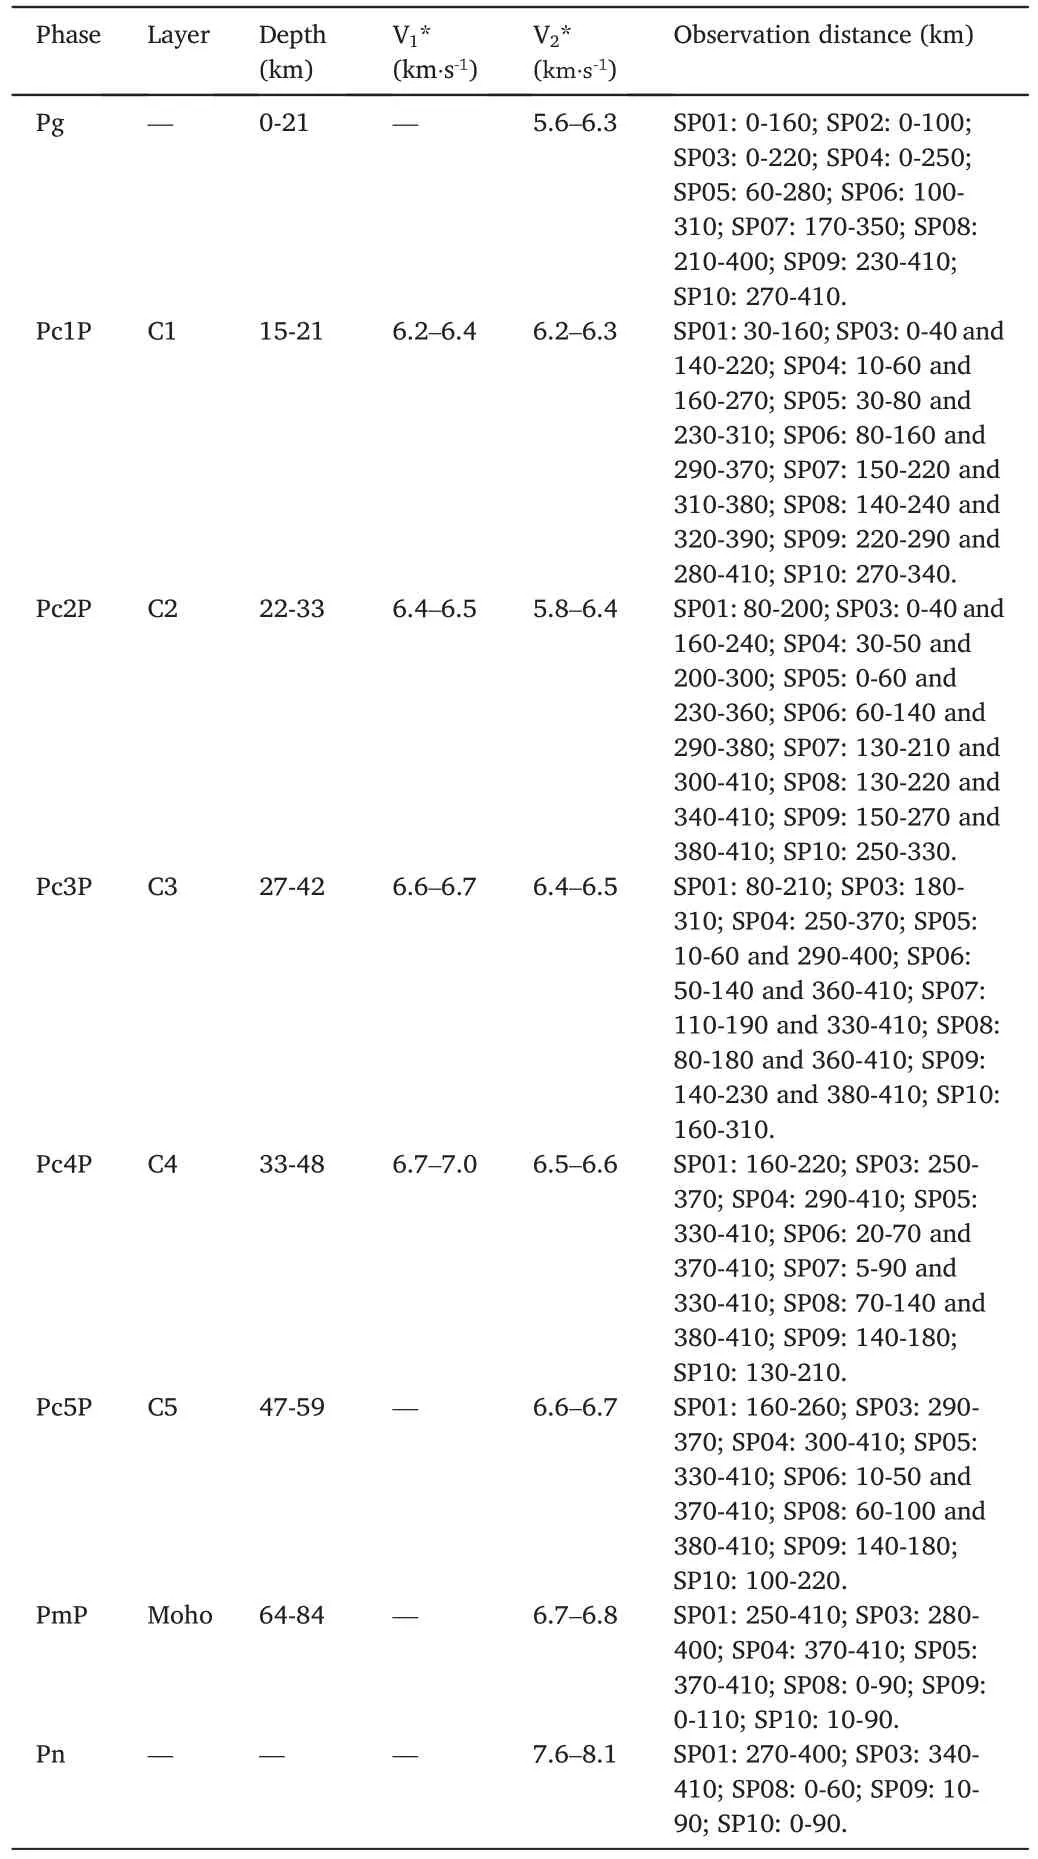
Table 1Description of seismic phases.
4.2.Velocity model
The shallow crustal velocity structure is shown in Fig.3c.A velocity contour of 5.6 km/s is used to represent the top of the crystalline basement.In the southern YZS,a low-velocity anomaly that thickens northward is associated with thick sediments in the suture.And there are~0.8–1.0 s delay for the travel time of Pgas shown in the reduced seismic sections of SP04,SP05,and SP06.The thickness of the sedimentary succession is approximately 3.5 km in the central Lhasa terrane with velocities between 3.3 and 5.6 km/s,and the same thickness of sedimentary cover can also be observed at the north end of the profile near Selin Tso with velocities between 3.6 and 5.6 km/s.In the southern Lhasa terrane from 120 to 170 km in the profile,the high-velocity zone underlying a thin sedimentary layer agrees with the Gangdese magmatic belt,which developed by extensive granitoid intrusions in a Cretaceousearly Cenozoic Andean-type arc(Sch¨arer et al.,1984;Yin and Harrison,2000).ThevPstructure changes abruptly near the Gyaring Co fault(GCF),from approximately 4.0–5.6 km/s in the south to 5.4–6.0 km/s in the north.This results in~0.6 s of Pgtravel time delay in the SP07 and SP08 reduced seismic sections near the~300 km distance.
The whole crustal velocity structure is illustrated in Fig.3d.The Pwave velocity rapidly increases to~6.3 km/s from the bottom of the sedimentary crust to the crystalline crust.The vertical velocity gradient is homogeneous from the top crystalline crust to a depth of~15 km(0 km depth represents sea level) in the Lhasa terrane,with velocities varying from 5.8 to 6.3 km/s.In the Tethyan Himalaya,however,a high-velocity anomaly(6.1–6.4 km/s)is observed just below a 2-km-thick sedimentary cover down to a depth of~20 km at a distance ranging from 20 km to 100 km,which represents the North Himalayan gneiss dome.In the Lhasa crust,a low-velocity zone (LVZ) with a thickness of approximately 6–8 km is present at a depth of 10–20 km between 230 km and 340 km.The velocity of the LVZ is approximately 6.0–6.2 km/s with a 2.1–6.2% velocity decrease relative to the velocity of the upper layer.From a depth of 10–40 km,the velocity is 6.4–6.8 km/s in the Himalayan terrane (60 km–100 km distance) and becomes lower than 6.6 km/s in the south Lhasa terrane and lower than 6.5 km/s in central Lhasa,and then increases to 6.6 km/s north of the GCF.In the lower crust,the Indian plate has a normal velocity value of 7.0–7.2 km/s,which corresponds with previous studies(Monsalve et al.,2008;Sheehan et al.,2014;Vijaya Rao et al.,2015).The velocity is approximately 6.8 km/s in the lower crust of the southern Lhasa terrane.However,an extremely low velocity (≤6.7 km/s) is observed beneath the central-northern Lhasa terrane.The Pn velocity (thevPin the uppermost upper mantle) is approximately 8.1 km/s in the distance range of 110–250 km and then decreases to~7.6 km/s in the distance range of 250–320 km.
The whole crustal average velocity is 6.38 km/s(Fig.3f).The average crustal velocity in the Tethyan Himalaya(6.47 km/s)is higher than that in the Lhasa terrane.The central Lhasa terrane has an extremely low average crustal velocity (6.32 km/s).Beneath the YZS,the Moho discontinuity deepens from~75 km beneath the Tethyan Himalaya to 79 km beneath the Lhasa terrane.Then,the depth of the Moho discontinuity decreases northward from~75 to 79 km in the southern Lhasa terrane,to~75 km in the central Lhasa terrane and~65-70 km in the northern Lhasa terrane.
5.Discussion
5.1.Crustal structure in the Himalayas and southern Tibet
Several transmeridional faults are observed in the shallow velocity structure in the Lhasa terrane(Fig.3b and c).For example,the positions of the LMF and SNMZ inferred from geological observations(Hou et al.,2015;Zhu et al.,2011) are also marked by high-velocity anomalies(Fig.3c).According to the shallow velocity structure,we divide the Lhasa terrane into the southern Lhasa terrane,the central Lhasa terrane,and the northern Lhasa terrane from south to north,respectively.According to the velocity model,the top of the crystalline basement is~3 km below the surface.In the results,the relatively homogeneous velocity of~6.4 km/s in the upper crust (10-30 km) beneath the Lhasa terrane provides seismic evidence of a lack of tectonic deformation.The essentially flat-lying Gangdese batholith and the Linzizong volcanic rocks (late Paleocene-early Eocene~65-40 Ma volcanic sequence),which are well exposed in the southern Lhasa terrane,also imply that there has been no significant north-south shortening in the upper crust since the Cenozoic in the Lhasa terrane (Coulon et al.,1986;Murphy et al.,1997;Yin and Harrison,2000).
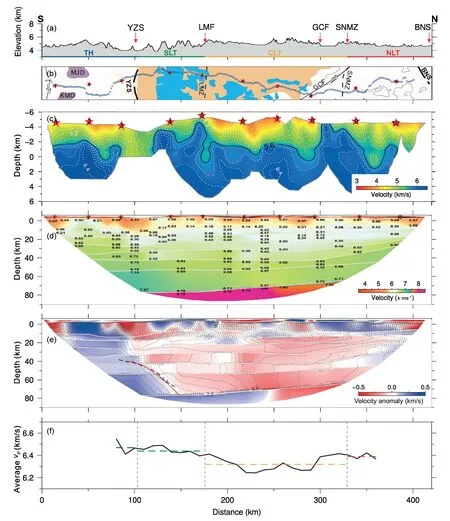
Fig.3.The final velocity model.(a) Topography and location of the main faults along the seismic profile.(b) Geological map along the seismic profile in this study.Blue circles show the stations along the seismic profile in this study,and red stars with numbers mark the seismic sources.(c) Shallow crustal vP structure calculated by the finite difference method (Hole,1992;Vidale,1988) using the first arrivals (Pg phase).The isoline of 5.6 km/s marked by the solid line represents the top of the crystalline crust.(d) Whole crustal vP structure is calculated by the software RAYINVR (Zelt and Smith,1992).Discontinuities are marked by white lines.(e) The velocity anomalies ΔvP are plotted with the contour lines of the vp.Δvp is calculated by the vP minus the average vP of the same depth.Beneath the YZS,the red line denotes the Main Himalayan Thrust (MHT) revealed by our velocity model,while the blue dashed line shows the MHT from Guo et al.(2017).(f) Crustal average P-wave velocity calculated from our velocity model.MJD=Mabja Dome;KMD=Kampa Dome;TH=Tethyan Himalaya;SLT=Southern Lhasa Terrane;CLT=Central Lhasa Terrane;NLT=Northern Lhasa Terrane.
Beneath the Himalaya and YZS,the results show a north-dipping velocity changing boundary at a depth range of 30–80 km and a distance range of 70–160 km (Fig.3d and e),which separates a high-vP(~7.20±0.2 km/s)lower crust to the south and a low-vP(6.7–6.9 km/s)lower crust to the north with a north-dipping angle of~35°.Previous seismic tomography(Monsalve et al.,2008;Vijaya Rao et al.,2015)has shown that the Indian lower crust features a highvP(>7.0 km/s).We interpret the north-dipping boundary beneath the northern Himalayas and YZS as the top of the subducted Indian lower crust,with a similar position as the main Himalayan thrust (MHT) proposed by previous studies (Fig.4b) (Guo et al.,2017;Li et al.,2018;Murphy,2007).The results of this study suggest that the northward advancing Indian lower crust terminates in the southernmost Lhasa terrane,which is supported by the deep seismic reflection results and the magnetotelluric results(Guo et al.,2017;Liang et al.,2018).The results show that the P-wave velocity is less than 6.7 km/s in the lower crust of the Lhasa terrane.The seismic observations deviate obviously from the mafic lower crust,which is characterized by avPthat is larger than 6.8 km/s (Christensen and Mooney,1995;Rudnick and Fountain,1995;Rudnick,1995;Rudnick and Gao,2003).
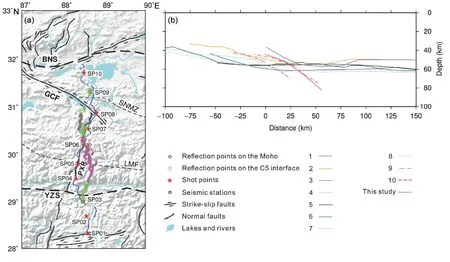
Fig.4.(a)The distribution of reflection points at the C5 interface(green circles)and Moho discontinuity(purple circles).Blue circles and red stars show the stations and the shots.(b) Geometric morphology of the MHT or the top of the Indian lower crust.The zero km distance denotes the location of the Yarlung-Zangbo suture(YZS).The red lines show the results of the observations in N-S geophysical profiles in the middle part of the southern Qinghai-Tibetan Plateau.The other colored lines show the receiver function results from the N-S profiles in the western and eastern Qinghai-Tibetan Plateau.1:Zhang et al.(2014),2:Xu et al.(2017),3:N′abelek et al.(2009),4: Xu et al.(2015),5: Kind et al.(2002),6: Shi et al.(2015),7: Schulte-Pelkum et al.(2005),8: Murphy (2007),9: Guo et al.(2017),10: Li et al.(2018).
5.2. The low vP layer at the bottom of the upper crust
A low-velocity layer (LVL),with a decrease in velocity of~0.1–0.3 km/s,is observed at the bottom of the upper crust (in a depth range of 17–25 km) at a distance of~230–340 km in the central Lhasa terrane.The LVL in the deep middle or lower crust has been taken as an important indicator of a low-viscosity crustal channel for the channel flow model,in which crustal material migrates from the center to the edge of the plateau induced by gravitational potential energy (Beaumont et al.,2001;Clark and Royden,2000;Royden et al.,2008).It has been debated for decades whether channel flow exists and controls the topographic evolution in the Qinghai-Tibetan Plateau,although low shear wave velocity zone in the middle crust at depths of~20–40 km (e.g.,Huang et al.,2020;Liu et al.,2014;Yang et al.,2012),high-conductivity layers in the middle crust (e.g.,Li et al.,2003;Liang et al.,2018;Unsworth et al.,2005;Wei et al.,2010),and the low-QLgbelt indicate high seismic wave attenuation(Zhao et al.,2013) are frequently observed in the plateau and its margin.
For the crustal high-conductivity layer in southern Tibet,magnetotelluric analysis suggests that the melting fraction of crustal rocks can reach 5%–14%,but it is not enough to weaken the rock-to-flow conditions for granite (Wei et al.,2010).Li et al.(2003) explained the high-conductivity anomaly by saline fluids because middle-lower crustal partial melting and a thin layer of water in the shallow crust can produce the same MT data.Both partial melting and fluid water can decrease seismic velocities (Watanabe,1993),but thevP/vSratio is a good parameter to distinguish partial melting and fluid water in rocks.For partial melting in rocks,thevP/vSratio increases with increasing melting fraction;however,it decreases with increasing fluid fraction for rocks with saline fluid water(Watanabe,1993).Normal-to-low crustal averagevP/vSratios (Owens and Zandt,1997;Wittlinger et al.,2009) suggest a lack of partial melting in the southern and central Lhasa terrane.Here,we suggest that the LVZ is caused by a thin layer(~6-8 km)with saline fluid water at the bottom of the central Lhasa upper crust,although it has not been found in the WARR model along the INDEPTH-III profile (Haines et al.,2003;Zhao et al.,2001).
5.3.The lower crustal composition beneath the southern plateau
We extracted typical crustal velocity profiles from different crustal lithologies and compared them to typical velocity versus depth curves in the Tethyan Himalaya and southern,central,and northern Lhasa terranes(Fig.5).Four kinds of lower crustal compositions are chosen as candidates,including granite gneiss (GGN),felsic granulite (FGN),intermediate granulite (IGR) and mafic granulite (MGR) (Christensen,1979;Christensen and Mooney,1995).According to the calculation,thevPresulting from mafic granulite at lower or average temperatures best fits the observations in the Tethyan Himalaya(Fig.5a and b).The felsic and intermediate granulites under both lower and normal geothermal conditions (Fig.5a and b) can result in a lowvP,which matches the observation velocity in the lower crust of the Lhasa terrane well.Under high geothermal conditions (Fig.5c),the temperature increases from 800°C at a depth of 60 km–1000°C at a depth of 80 km,and thevPdecreases in the mafic granulite when compared with the values at low(Fig.5a)and normal (Fig.5b) temperatures,but thevPvalues of 6.9 km/s are still higher than the lowvP(6.7 km/s)beneath the southern Qinghai-Tibetan Plateau.Partial melting in the lower crust is another factor that decreases thevP,but it is opposed by geophysical observations.First,a new three-dimensional crustal conductivity structure (Dong et al.,2020)shows no highly conductive lower crustal anomalies deeper than 65 km in the central and southern Qinghai-Tibetan Plateau.Second,if the lowvPin the depth range from 60 km to 80 km is induced by partial melting,the crustal averagevP/vSratios should increase pervasively in the southern Qinghai-Tibetan Plateau;however,conversion wave analysis (N′abelek et al.,2009;Owens and Zandt,1997)shows a low crustal averagevP/vSratio in the Lhasa terrane.In this study,seismometers of the WARR profile were placed along the PXR.Several previous studies suggest that these N-S-trending rifts in southern Tibet extend from the surface to the Moho depth(Guo et al.,2018;Tian et al.,2015;Wang et al.,2017).The reflection points in the lower crust (green rhombus at the C5 layer and purple circles at the Moho in Fig.4a) show that only a small fraction of these rays partly travel along or through the PXR unless the rift becomes wider in the deep crust.The magnetotelluric profile along the PXR(Liang et al.,2018)shows a normal-conductivity lower crust beneath the central and northern Lhasa terrane,which rules out the lowvPcaused by partial melting.Based on the above analysis,we employ the felsic-intermediate granulite to explain the extremely lowvPin the lower crust beneath the central and northern Lhasa terrane.
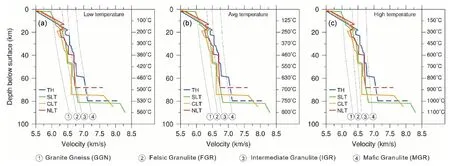
Fig.5.Comparison of velocity structures between the results of the WARR profile in this study(colored lines)and several major rock types(gray lines).(a),(b),and(c)show the comparison at low,average,and high-temperature conditions,respectively.Based on the measurements V(z0)in the laboratory under surface conditions(Christensen and Mooney,1995),as well as pressure gradients (dV/dP) and temperature gradients (dV/dT) (Christensen,1979),the velocity value at a depth of z is calculated by V(z)= V(z0)+ ⋅⋅(z - z0)+⋅ ⋅(z - z0),where P is the pressure and T is the temperature.Amphibolite (AMP) is also considered to have velocities close to those of mafic granulite rocks.TH: Tethyan Himalaya;SLT: Southern Lhasa terrane;CLT: Central Lhasa terrane;NLT: Northern Lhasa terrane.
5.4.Comparison with previous receiver function studies
Previous receiver function results have imaged a~15-km-thick highvSlayer(bounded by a doublet)in the lower crust beneath the southern Qinghai-Tibetan Plateau,which was interpreted as the underthrust of the Indian lower crust (Kind et al.,2002;N′abelek et al.,2009;Schulte--Pelkum et al.,2005;Shi et al.,2015;Xu et al.,2015;Zhang et al.,2014)(Fig.1).The amplitudes of P-to S-waves between the Moho and the interface in the lower crust are comparable in these receiver function images,so an interface with a large S-wave velocity jump should be present in the lower crust.If there is a high-vSlayer and a sharp interface in the lower crust beneath the profile,the WARR observation in this study should result in a high-vPlayer and an abrupt interface in the lower crust in thevPstructure.
We suggest that the crust beneath the southern plateau is underplated by the high-vPIndian lower crust in some longitude ranges(perhaps most ranges)or thickened by low-vPintermediate granulite in other longitude ranges,such as 88 ± 0.5°E.Our proposal receives support from new receiver function images along W-S profiles (Shi et al.,2020),which show that the RF doublet is replaced by a single converter (or a single interface)in some places,such as in the longitude range of 88±0.5°E.Shi et al.(2020) suggest that two competing processes,underthrusting and localized foundering of the Indian lower crust,are operating simultaneously on the southern plateau,with the former maintaining or increasing crustal thickness and the latter reducing crustal thickness.In the WARR observation in this study,a low-vPlower crust on the 80-km-depth Moho supports that the crust beneath the southern plateau is thickened by felsic-intermediate granulite rather than thinned by localized foundering of Indian lower crust.The high-vPlower crust beneath the Tethyan Himalaya and YZS in the results also provide evidence that the Indian lower crust is terminated beneath the YZS or subducted into the upper mantle beneath the YZS in the longitude range of 88 ± 0.5°E,which receives support from the deep seismic reflection results and the magnetotelluric results (Guo et al.,2017;Liang et al.,2018).
5.5.New geodynamic model
Based on ƐHfmapping,Hou et al.(2015)suggested that the juvenile lower crust is distributed mostly beneath the western and eastern parts of the southern Lhasa terrane but not the central part of the southern Lhasa terrane.This implies that the original lower crust has been partly destroyed or delaminated beneath the western and eastern parts of the southern Lhasa terrane,while the original lower crust beneath the central part of the southern Lhasa terrane has been retained because the eclogite transition of the lower crust has been prevented by the dominant felsic-intermediate composition.
Geochemical studies (Chung et al.,2005) show that adakites emplaced in the southern Lhasa terrane at 26-10 Ma originated from the lower part of the thickened crust by melting eclogites or garnet amphibolites.This lower crustal melting required a significantly elevated geotherm,which Chung et al.(2003) attributed of removing the thickened lithospheric mantle.The appearance of adakites,only west of 86°E and east of 89°E along the southern Lhasa terrane,supports that the thickened lithospheric mantle may include lower parts of crust removed in both the western and eastern parts but not in the central part of the southern Lhasa terrane.As a result,lithospheric thinning provides space for the underthrusting Indian lower crust beneath the western and eastern parts of the southern Lhasa terrane.The thick crust without thinning beneath the central part of the southern plateau is thick enough to stop the northward advancement of the Indian lower crust and to prevent the formation of adakites.
Based on the above discussion,we suggest that the composition of the Eurasian crust plays an important role in controlling the dip angle of the Indian subducting lithosphere(Fig.6).If the lower crust is dominated by felsic-intermediate composition,the thickened Eurasian crust stops the northward advancement of the Indian lithosphere and results in steep subduction.In contrast,the lower crust is dominated by mafic composition,and the thickened Eurasian crust loses its lower part after eclogitization and delamination,thus providing voids for the northward advancement of the Indian lithosphere and resulting in a flat underthrust.The transition between the flat underthrust and the steep subduction of the Indian lower crust also contribute to Indian slab tearing as well as the development of N-S-trending rifts in southern Tibet and the Himalayan orogen (Chen et al.,2015;Li and Song,2018;Zhao et al.,2010).
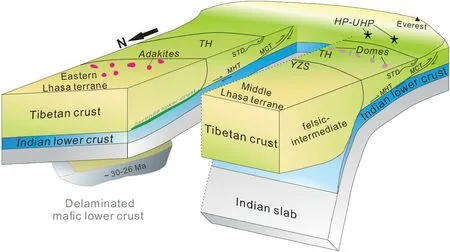
Fig.6.Schematic model illustrating the different subduction styles of the Indian lithosphere controlled by the nature of the lower crust and thickness of the overriding plate in the southern Qinghai-Tibetan Plateau.Since~30-26 Ma,the thickened crust in the eastern part of the Lhasa terrane has delaminated its mafic lower crust after eclogitization.It has not only caused the juvenile lower crust and the presence of adakites but has also provided space for the flat subduction of the Indian lower crust with mantle lithosphere.In the middle of the collision zone,eclogitization and further delamination due to the lack of mafic composition in the lower crust have been prevented,and the thickened crust of the southern Qinghai-Tibetan Plateau is thick enough to stop the northward advancement of the Indian lower crust,resulting in steep subduction of the Indian lithosphere.Steep subduction favors the exhumation of HP-UHP rocks,the formation of domes,and the uplift of the Mountain Everest in the middle of the collision zone.
Along the Himalayas,HP-UHP rocks have been found only west of 80°E and in the range of~87–90°E (Guillot et al.,2008;Zhang et al.,2015).Compared to the underthrust (flat subduction),the steep subduction would have space for the exhumation of HP-UHP rocks because crustal rocks can subduct to greater depth before being strongly weakened,and the two converging plates are less coupled (Li et al.,2011).We suggest that the lack of HP-UHP rocks may have resulted from underthrusting (flat subduction),although the burial and exhumation of HPUHP rocks are also controlled by the convergence rate and rheolog-ical strength of the subducting crust.The presence of HP-UHP rocks may be an indicator of normal-angle or steep subduction of the Indian slab west of 80°E and within~87–90°E.
6.Conclusions
Across the middle of the collision zone between the Indian and Eurasian plates,a new crustalvPmodel is constructed beneath the Himalayas and southern Qinghai-Tibetan Plateau based on a~450-kmlong N-S-trending deep seismic sounding profile.The results show that the crustal thicknesses reach 80 km beneath the Yarlung-Zangbo Suture and southern Lhasa,decrease to 70 km under central Lhasa,and then decrease to 65 km under northern Lhasa.The Indian lower crust indicated by avPof~7.1 km/s extends into the Lhasa crust no more than 50 km and perhaps subducts into the upper mantle beneath southern Lhasa.Although the burial depth is more than 50 km,the lower crust of the southern Qinghai-Tibetan Plateau features an extremely low velocity(<6.7 km/s).After comparing with the velocities of several typical crustal lithologies in different temperature regimes,this study reveals that the lower crust of the southern plateau is dominated by felsicintermediate granulite,which prevents the lower crust from undergoing eclogitization.In the middle of the collision zone,the Eurasian crust is therefore stable and thick enough to stop the northward advancement of the Indian lithosphere and result in steep subduction.In the eastern and western parts of the collision zone,the mafic lower crust delaminated after eclogitization and gave space to the flat underthrust of the Indian lower crust.
Declaration of competing interest
The authors declare that they have no known competing financial interests or personal relationships that could have appeared to influence the work reported in this paper.
Author agreement and Acknowledgments
The authors declare that the work described was original research that has not been published previously and is not under consideration for publication elsewhere,in whole or in part.All the authors listed have approved the manuscript that is enclosed.We gratefully acknowledge our colleagues for seismic data acquisition.We thank Prof.Piotr ′Sroda for providing the szplot software package,which was modified from the zplot of Colin A.Zelt.The software RAYINVR was provided by Zelt and Smith [1992].The Short-period Seismograph Observation Laboratory,IGGCAS,provided the seismic instruments.This research was supported by the National Key R&D Program of China (Grant No.2016YFC0600301) and the National Natural Science Foundation of China(Grant 42030308,41974053,and 41888101).Most of the figures were plotted using Generic Mapping Tools (GMT) software [Wessel and Smith,1998].The wide-angle reflection/refraction data are shared by the Seismic Array Laboratory,IGGCAS (https://doi.org/10.12129/IGG SL.Data.Obervation),and can be downloaded via ftp://159.226.119.161/data/DNA/88E_WA.
Appendix A.Supplementary data
Supplementary data to this article can be found online at https://doi.org/10.1016/j.eqrea.2023.100233.
 Earthquake Research Advances2023年3期
- Earthquake Research Advances的其它文章
- Research progress in geophysical exploration of the Antarctic ice sheet
- Advances in experiments and numerical simulations on the effects of stress perturbations on fault slip
- A palaeoearthquake event and its age revealed by the travertine layer along the Litang fault in the southeastern margin of the Qinghai-Tibetan plateau
- Influences of across-strike heterogeneous viscosity on the earthquake cycle in a three-dimensional strike-slip fault model
- Detailed sedimentary structure of the Mianning segment of the Anninghe fault zone revealed by H/V spectral ratio
- Freely accessible inventory and spatial distribution of large-scale landslides in Xianyang City,Shaanxi Province,China