Cross-Band Spectrum Prediction Algorithm Based on Data Conversion Using Generative Adversarial Networks
Chuang Peng,Rangang Zhu,Mengbo Zhang,Lunwen Wang
College of Electronic Engineering,National University of Defense Technology,Hefei 230037,China
*The corresponding author,email: wanglunwen@163.com
Abstract: Spectrum prediction is one of the new techniques in cognitive radio that predicts changes in the spectrum state and plays a crucial role in improving spectrum sensing performance.Prediction models previously trained in the source band tend to perform poorly in the new target band because of changes in the channel.In addition,cognitive radio devices require dynamic spectrum access,which means that the time to retrain the model in the new band is minimal.To increase the amount of data in the target band,we use the GAN to convert the data of source band into target band.First,we analyze the data differences between bands and calculate FID scores to identify the available bands with the slightest difference from the target predicted band.The original GAN structure is unsuitable for converting spectrum data,and we propose the spectrum data conversion GAN(SDC-GAN).The generator module consists of a convolutional network and an LSTM module that can integrate multiple features of the data and can convert data from the source band to the target band.Finally,we use the generated target band data to train the prediction model.The experimental results validate the effectiveness of the proposed algorithm.
Keywords: cognitive radio;cross-band spectrum prediction;deep learning;generative adversarial network
I.INTRODUCTION
Spectrum prediction,also known as spectrum inference,is an effective spectrum sensing complementary technology,which can obtain the spectrum state in advance.Compared with spectrum sensing,which uses signal detection methods to determine spectrum state passively,spectrum prediction effectively uses the intrinsic correlation between the data to actively infer the occupied and free state of the radio spectrum from the measured available data.The acquisition of spectrum occupancy information in the future can speed up the selection of the best channel,expand the perception range in the time-frequency domain,and improve the performance of cognitive radio [1].Spectrum prediction technologies have been successfully applied in daily life,such as spectrum sharing of 5G mobile communication and automatic link establishment of the next generation of high frequency,and have shown great potential in future wireless network applications[2].In summary,spectrum prediction applies data mining technology in spectrum data analysis[3],which is an effective supplement to spectrum sensing and plays an increasingly important part in cognitive radio.
Spectrum prediction can be applied to areas such as cognitive radio and data analysis and is receiving increasing attention from researchers.Due to the limitations of early devices,spectrum prediction research was mainly focused on the time domain,and the predicted values were classified as occupied/free (1/0).With the development of the research,the focus of the research has shifted to joint multi-domain spectrum inference technology.Specifically,two-dimensional frequent pattern mining was first used to solve the joint time-frequency prediction problem[4].Moreover,the Hidden-Markov-Model(HMM)[5]and artificial neural network (ANN) [6] showed good performance in the early stage.According to the latest advances in deep learning models,they are strong competitors for statistical models of spectrum prediction.In [7],the authors used Aversarial Autoencoder(AAE)to predict spectral data and implemented an anomaly detection system based on this prediction method.In [8–10],LSTM is used for spectral data prediction for the first time and shows better performance than recurrent neural network (RNN).Due to the dependence of spectral data in the time and frequency domain,CNN[11],ConvLSTM [12] are used to predict spectrum data.Literature [13] analyzes the spectral data of multiple time scales and proposes the DTS-ResNet to utilize a large amount of historical data fully.ConvLSTM also uses this framework and achieves excellent prediction results[14].
The above deep-learning-based spectrum prediction methods are all implemented based on a large amount of historical data.However,in reality,due to changes in reception location,frequency,and electromagnetic posture,the predicted target frequency band available often has less historical data to support the training of a deep model.In addition,the variability in data distribution between frequency bands leads to a significant degradation in the performance of the depth model in the target band for the source frequency band.The transfer learning method is used to solve the crossband prediction problem[15].To find the main characteristic components of the data,the transfer component analysis method is used,and the experimental results verify the effectiveness of transfer learning.Generative adversarial networks can also solve this problem.The existing methods first train a generator with source band data,then finetune the generator with a small amount of target domain data to enable it to self-expand the target domain data,and finally train the model with comprehensive data to achieve crossband spectrum prediction[16].Although this method can achieve cross-band spectrum prediction,there are still some problems,such as the low efficiency of GAN and the need to finetune the generator to achieve spectrum generation.Therefore,the existing spectrum prediction algorithm based on small samples has few research achievements,and further research is needed to improve the accuracy of spectrum prediction.We use GAN to convert the spectrum data,and on this basis,we achieve the prediction of the spectrum data in the case of a small sample.GAN has become a hot topic in deep learning research since it was proposed [17].Some achievements have been made in computer vision,natural language processing,time series synthesis,and semantic segmentation[18].Then Deep Convolution Generative Adversarial Network (DCGAN)was proposed [19],which greatly improved the performance compared with the original network.GAN is widely used in data enhancement and can solve the problem of insufficient training sample size [20].Pix2pix network realizes the transformation of image style[21].CycleGAN then further improved the effect of image style conversion[22].However,CycleGAN requires that the input and output be similar in image structure.When the demand output is geometrically changed,the network conversion effect decreases significantly.
In this paper,we propose a new generative adversarial network.The target band data extend by converting the source band data.The algorithm reduces the dependence of the model on existing data in the target band.The converted data by the generative adversarial network is closer to the target band sample than to the historical data of other bands.Specifically,the contributions of this paper are summarized as follows:
• We analyze real-world spectrum data and quantify the differences between spectrum bands using FID scores.On this basis,we analyze the variability between the target bands and the different source bands.
• We propose the SDC-GAN,the generator model consists of a convolutional module and an LSTM module that can fuse various depth features.As a result,the network effectively converts non-target frequency historical data into target band.The FID and SSIM are used as evaluation metrics to verify the high similarity between the converted band and the target band.We found that frequency bands with more minor differences from the target band are easier to convert to the target band with higher similarity.
• We propose a framework for cross-band spectral prediction using GAN converted spectrum data.The method uses the converted target band data to train a model and then finetunes the model with a small amount of real data.Experimental results show that the method has higher frequency prediction accuracy than finetuned transfer learning methods.
The rest of the paper is organized as follows.In Section II,we describe the cross-band prediction problem and analyze the differences between bands.In Section III,we present the overall framework of the algorithm and the network structure of SDC-GAN.In Section IV,we compare and discuss the algorithm performance through experiments.The Section V concludes the paper.
II.PROBLEM DESCRIPTION AND ANALYSIS OF DIFFERENCES BETWEEN FREQUENCY BANDS
2.1 Problem Description of Cross-Band Prediction
The main task of spectrum prediction is to predict the spectrum data for a future period from the received historical spectrum data.To describe the spectrum prediction problem in detail,we first model the received signal as:
wherer(n) is the received signal,s(n) is the normal user data,w(n)is the noise signal andNis the number of different signals received.
Time variation is an essential feature of spectrum,so we use STFT to make a time-frequency representation of the received signal:
whereg(n)represents a window function of a particular type and length,∗denotes a complex conjugate,Fis the sampling rate,andmdenotes a cyclic frequency that depends onF.Unlike traditional algorithms that require complex statistical models and high computational complexity,the deep learning based spectrum prediction model can intelligently learn the distributionp(X)of data from the source datasetXto achieve the prediction of spectrum data.
The spectrum prediction technique model in this paper can be further improved by assuming that the spectrum data of the received signal is the measured value ofFfrequency points withinTtime slots,and to simplify the notation a time-frequency domain sequence can be represented in the form of a matrix,=(x1,x2,x3···xN)T=(x1,x2,x3···xT)∈RN×T.Where xirepresents the data collected at each frequency point and is the row in the matrix;xirepresents the data at each moment and is the column in the matrix;and(•)Trepresents the transpose operation of the matrix.Thus,the time-series data at frequency pointkcan be represented as xk=(T∈RT;similarly,the data at each frequency point at momenttcan be represented as xt=T∈RN.
The spectrum prediction is based on the spectrum data for a short period to predict the data for multiple time slots in the future.If the current moment isT1and the number of frequency points isk,datafrom the previousstime slots is used to predict datafor the nextτtime slots.Mis the representation function of the network model.
For the cross-band spectrum prediction problem studied in this paper,the small amount of available data in the target band does not allow for deep learning training.Therefore,further research and description are needed for this problem.We assume that the source band data is XSource,which conforms to distributionp(XSource),and the target band data is XTarget,which serves to distributionp(XTarget).In contrast to the target band,the source band has sufficient historical spectrum data,Thistory(XSource)≫Thistory(XTarget).We use a sliding window approach to generate the samples needed for deep learning training,usingSample(∗)to denote the number of samples and thenSample(XSource)≫Sample(XTarget).
Because of the small number of training samples available in the target band,direct training of the deep network cannot achieve efficient prediction of the spectrum data.To extend the amount of data in the target band,we propose the SDC-GAN.The network is capable of converting source band data XSourceto XGenerate.If we denote the conversion network byMSDC-GAN,the conversion process can be described as:
The generated data is highly similar to the target band data,and the amount of data generated is sufficient to support the training of a deep learning model.Ideally,the generated data distribution is precisely similar to that of the target band data.However,the generated target band data is still different from the real target band data and lacks some realistic variation in data fluctuations.Therefore,finetune the model trained on the generated data using a small amount of real target band data is also necessary.We assume that the prediction model trained using XGenerateisMpredictand the finetuned model is.Then,the prediction process for the target frequency band is:
2.2 Analysis of Differences Between Frequency Bands
First,we briefly describe the data and experimental conditions used in this paper.The spectrum data used in the experiments are mainly from the spectrum data of publicly available networks.The publicly available spectrum data was obtained from the RWTH Aachen University.The researchers performed rigorous and comprehensive spectrum measurements at two monitoring sites in Aachen,Germany,and one monitoring site in Netherlands.The monitored bands range from 20 MHz to 6 GHz and include four sub-bands with a bandwidth of 1.5 GHz.In the measurements,the sweep interval is 1.8 s.The monitoring system can obtain power spectral density (PSD) values for 1000 frequency points every half hour,and the maximum duration of continuous monitoring is approximately 14 days [23].The data contains several commonly used frequency bands,such as GSM900 Uplink(UL),GSM900 Downlink (DL),TV Broadcast,etc.Six datasets were generated based on the commonly used service bands,as shown in Figure 1.
In general,spectrum measurements are continuous power spectral density values.Still,it is difficult to obtain precise values for electromagnetic spectrum studies,where the band state is determined based on the magnitude of the power spectral density.The power spectral density value is quantified as a symbolic value to facilitate further processing and analysis.For example,in early spectrum studies,the power spectral density was quantified as 1/0 (occupied/free).Using the maximum value of the original data as the upstream and the minimum as the lower bound,the power spectral density values were quantified on average as Q(Q≥3) values.This quantization method facilitates algorithm performance evaluation and has been used in several papers [8,15].For the problem studied in this paper,the spectral data over time can be considered an image.The height of the image is the sampling time point,and the width is the frequency point.To facilitate the visualization of the data and the solution of the evaluation index data,the quantification of the data is setQ=255.
The distribution of frequency strengths and weaknesses in each band is different and varies significantly.To further analyze the differences between the frequency bands,the differences were quantified using the FID (Fr´echet Inception Distance score) [24],a measure to calculate the distance between images,which is often used to measure the similarity between two sets of images in computer vision.A lower FID means that the two distributions are closer to each other,which means that the resulting images are of higher quality and better diversity.To calculate the FID score,we first need to use the InceptionV3 network to project the data into the depth space to obtain the high-dimensional features with dimension 2048.Secondly,we use the PCA algorithm to downscale and simplify the high-dimensional features into threedimensional space,the individual sample dimension is changed from 1×2048 to 1×3.Finally,the FID score between the two frequency bands is calculated from Eq.(6).Where r and g are the two frequency bands being compared,µis the mean,is the covariance,andTris the trace operation of the matrix.The InceptionV3 network is a pre-trained network[25]with parameters trained through the large dataset ImageNet and is widely used in image classification.Table 1 shows the inter-band FID scores for the dataset in this paper.

Table 1.FID between pairings of each band.
The FID scores varies greatly among different frequency bands.Take GSM900UL as an example,the band with the smallest difference is GSM1800UL,with FID scores of only 6.84.The biggest difference is GSM1800DL,with FID scores of 62.84.In order to further intuitively see the data differences of various frequency bands,we take data at intervals for the frequency bands corresponding to GSM900UL and GSM900DL bands with the minimum difference and the maximum difference,and obtain the Dynamic Time Warping (DTW) between the two bands,as shown in Figure 2.DTW is a sequence signal processing technique that is used to compare the similarity of two sequences.
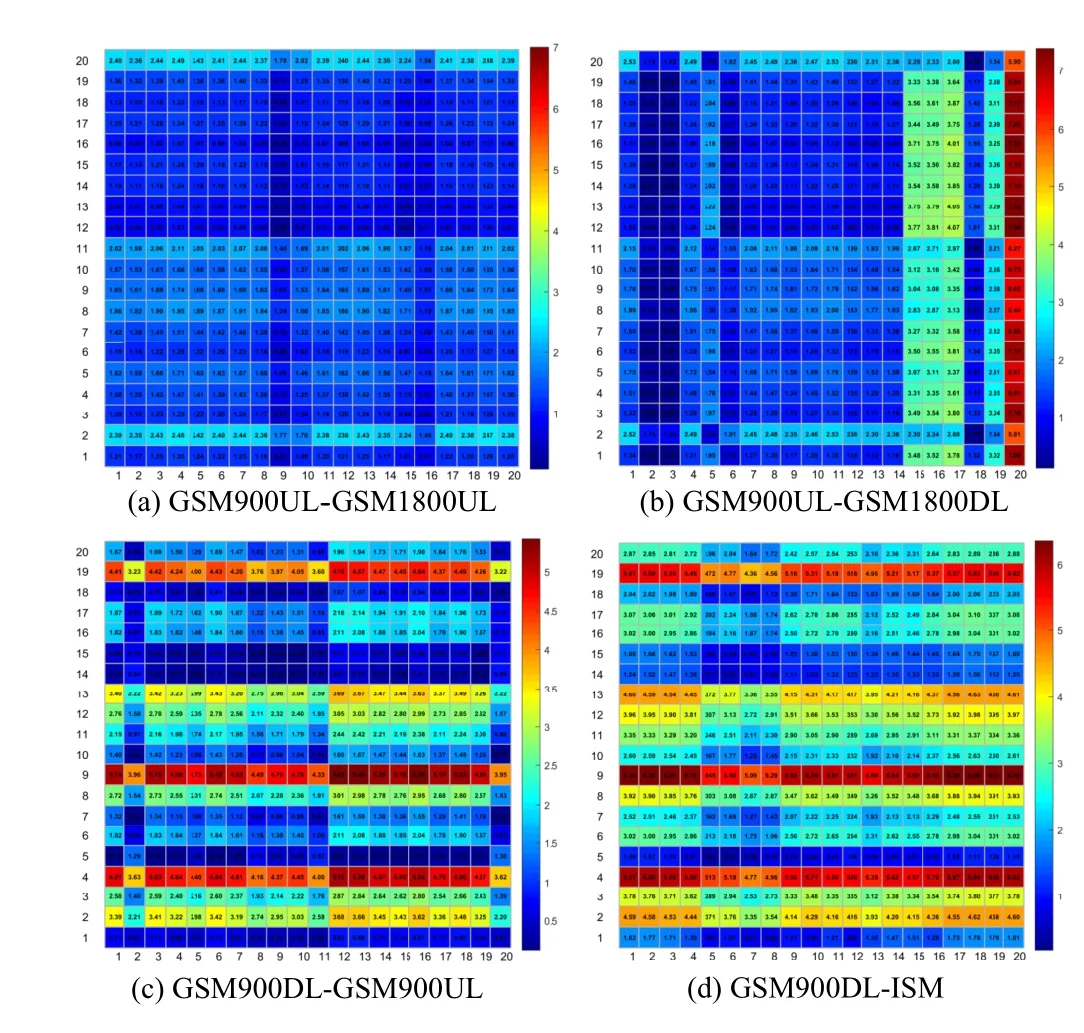
Figure 2.DTW between bands.
In Figure 2,the more red the color at a frequency point,the higher the value of DTW and the more different and less similar the two bands are at that point.Conversely,the smaller the value of DTW at a frequency point,the more the color shifts towards blue,the less the difference between the two bands at that frequency point and the greater the similarity.Analysis of Figure 2 shows that the observations are consistent with the results of the FID similarity measurement.Using the GSM900UL as an example,the data plots for each band in Figure 1 show that the data in the GSM1800DL band changes rapidly and fluctuates wildly.The data similarity between GSM900UL and GSM1800DL is low,and the differences are significant.The GSM1800UL band is less volatile.Corresponding to Figure 2,the data for GSM900UL and GSM1800UL are more similar.
III.SPECTRUM PREDICTION ALGORITHM FOR DATA CONVERSION USING SDC-GAN
To expand the amount of data in the target band so that it can drive the training of the depth model,this paper proposes to construct a network model to transfer the existing,rich data in the non-target band to the target band.The transferred data will have a high similarity to the target band data and will be able to meet the data volume requirements for driving the model train-ing.Conventional network models such as GAN and DCGAN use noise as input,which requires more training batches and less stable algorithms,and is not compatible with the concept of spectral data convers proposed in this paper.We propose a new and more effective spectral data conversion network,Spectrum Data Conversion-GAN(SDC-GAN),by referring to classical image styles conversion models such as pix2pix and CycleGAN and considering the difference in data distribution between different bands as the difference in‘style’between the two bands.
3.1 Algorithmic Framework
The overall framework of cross-band spectrum prediction based on data conversion is shown in Figure 3.We can briefly divide the algorithm into three steps,which are Step 1 SDC-GAN training,Step 2 Data conversion and Step 3 Train and finetune prediction model.
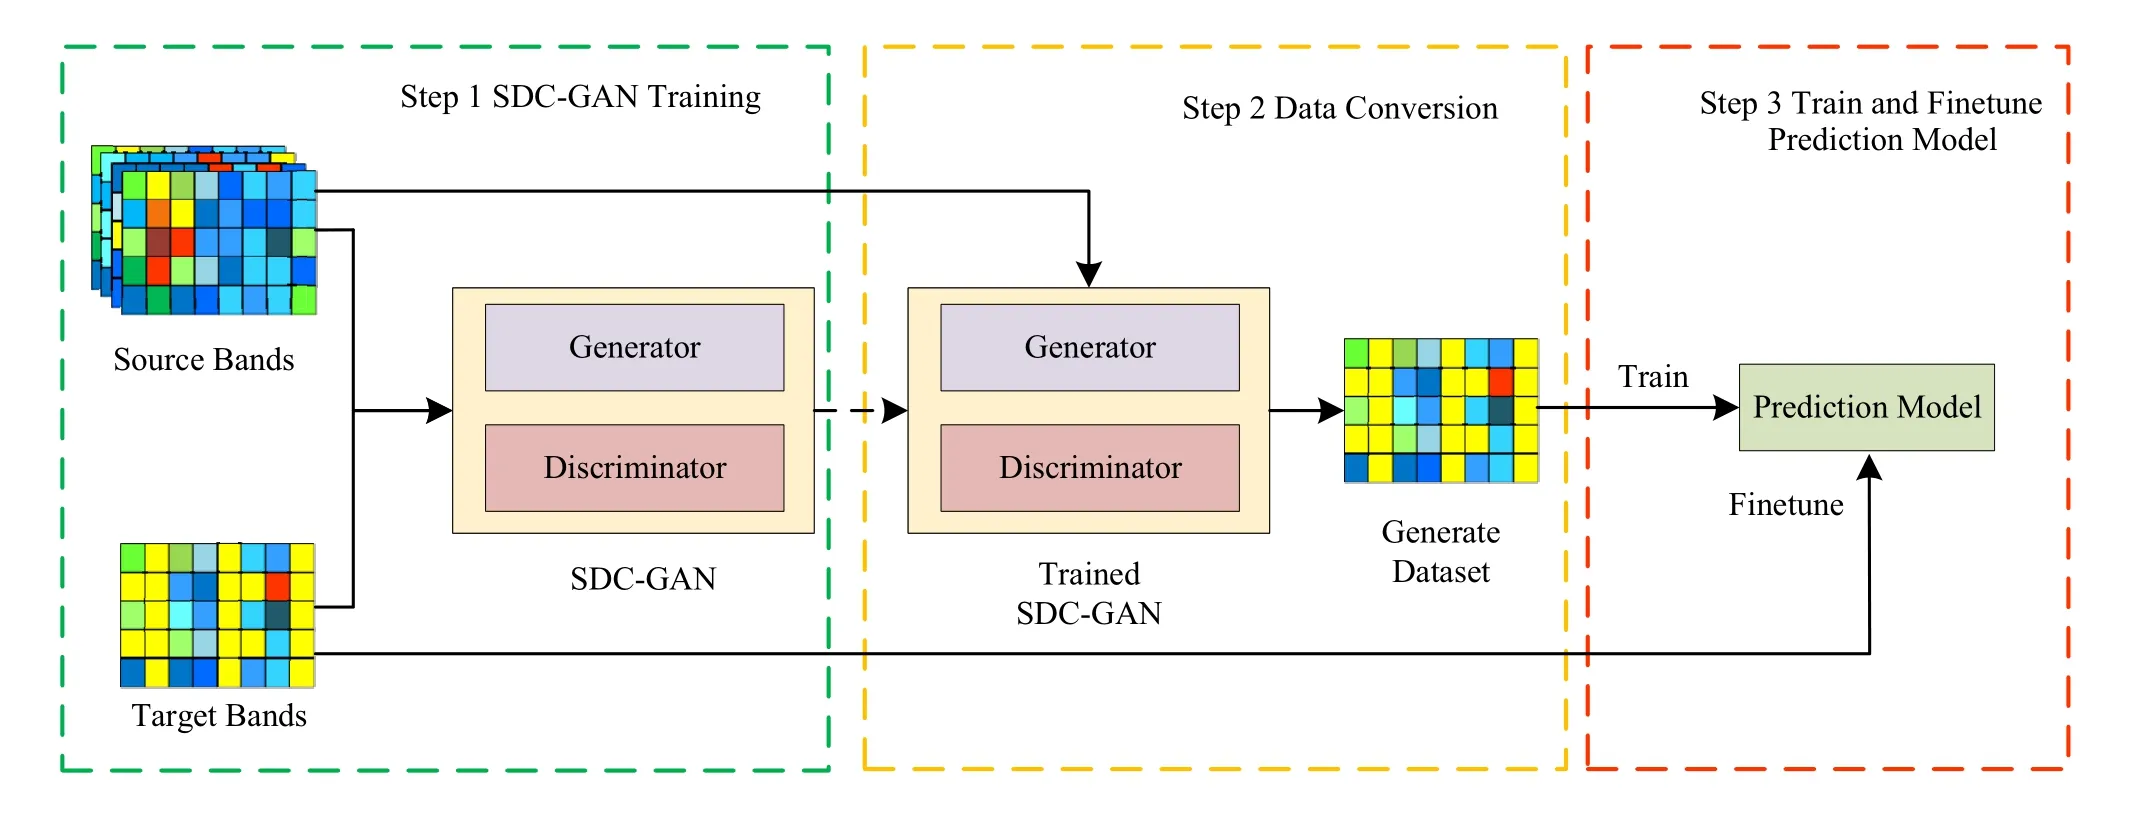
Figure 3.Whole framework of spectrum prediction.
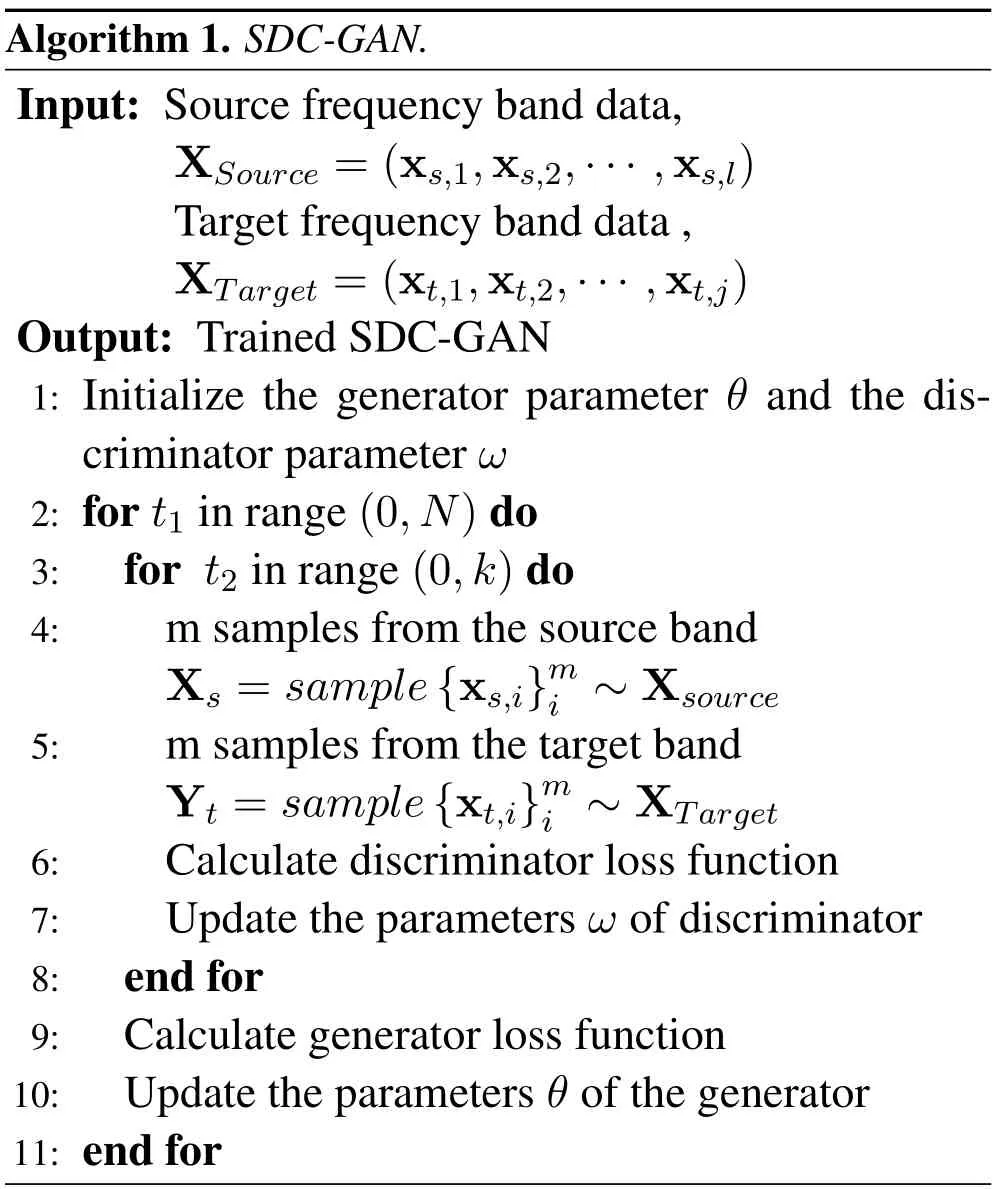
The green dashed box in Figure 3 shows the training of the SDC-GAN,where we use a large amount of source band data together with a small amount of target band data to train SDC-GAN.The SDC-GAN consists of a generator and a discriminator,with the generator’s input being the source band data and the output being the target band data.Algorithm 1 shows the training process of SDC-GAN.After training,the SDC-GAN can convert the source band data to the target band data.
It is important to note that GAN originates from the idea of zero-sum game in Game Theory,where the generator and discriminator are continuously played through the training process so that the generator learns the distribution of target data.For the SDCGAN,in each training round (Epoch),we first train the discriminators individually so that the discriminators have the essential discriminative ability.Then the discriminator parameters are frozen,and we train the SDC-GAN model as a whole.The discriminator supervises the generator to improve the output data quality and achieve cross-band conversion of the spectral data.Based on the logic of the discriminator,it is clear that SDC-GAN is a conditional generative adversarial network.Assuming that the source band data isxand the target band data isy,the objective of SDC-GAN is shown as[26]:
wherezis the noise distribution and the generator wishes to minimize this objective function while the discriminator wishes to maximize it,the objective of having a GAN can also be written asG∗=arg minGmaxDLGAN(G,D).In the algorithm study in this paper,although there is no noise in the input to the generator,noise is added to the network structure in the form of Dropout [20],adding randomness and diversity to the system’s output.
The yellow dashed boxes in Figure 3 represent the conversion process of the data.In this step,we input a large amount of source band data into the trained SDC-GAN to transform the source band data into the target band and generate the dataset needed to train the prediction model.The generated target frequency bands are similar to the actual target spectrum data.To distinguish them from the real spectrum data,we define the dataset constructed from the generated data called Generate Dataset.With the above two steps,we achieve the expansion of the target band data so that the target band data can support the training of deep learning.
In Step 3,we use the generated target band data and the real target band data to train the spectrum prediction model,as shown in the red dashed box in Figure 3.The prediction model is first trained using the generated dataset and then finetuned using the actual target band data,which contains more realistic variations in data fluctuations.The finetuning operation can further improve the model’s prediction performance for the target band.
3.2 Basic Module
The overall structure of SDC-GAN is similar to that of a traditional GAN,consisting of separate generators and discriminators.To enhance the deep feature extraction capability of the network,we use both CNN and LSTM modules in the construction of the network structure.CNN is a feedforward neural network class that includes convolutional computation and has a deep structure with powerful representation learning capabilities.Through convolution operations,CNNs can vary the dimensionality of the data,extracting high-dimensional features of the input signal and capturing the underlying patterns of data variation better than the original signal.The convolution kernel determines the dimensionality of the features extracted by the network.The stacking of convolutional kernels enables a richer depth of data to be obtained.
To enhance the feature extraction capability of the convolutional network,we build the Residual Unit.
In Figure 4,X(l)is the input andX(l+1)is its output.With this particular structure,the network introduces an identity shortcut connection that enables the propagation of gradients across layers,further improving the network’s performance.

Figure 4.The structure of Residual Unit.
LSTM network is a particular recurrent neural network that can effectively solve gradient explosion in network training.Especially for long sequence processing problems,LSTM has obvious performance advantages over basic RNN.LSTM contains three control units: input gate,forget gate and output gate.The gating state controls the transmission state in order to remember important information and forget unimportant information[27].
The forgetting factorftin the forgetting gate determines how much information of the unit stateCt-1at the last moment is reserved to the unit stateCtat the current moment.The input gate determines how much network inputxtis saved to unit stateCtat the current moment.The output gate determines how much informationCtoutputs to the current output valuehtof LSTM,and its formula is shown as:
In the above formula,Wf,Wi,Wc,Woare the weights,bf,bi,bc,boare the bias term,σ,tanh are the activation function of the network,is the temporary unit state,Xtis the current input,Ct-1is the unit state of the previous unit,and G is the output of the previous unit.LSTM can efficiently learn the inherent laws of data and realize the extraction of spectral time series features.
3.3 Structure of SDC-GAN
This paper proposes the SDC-GAN model,which can convert spectrum data and consists of a generator and a discriminator.The generator mainly implements the conversion function of spectrum data,and its structure is shown in Figure 5.The discriminator supervises the generator’s performance,and its structure and discriminating logic are shown in Figure 6.
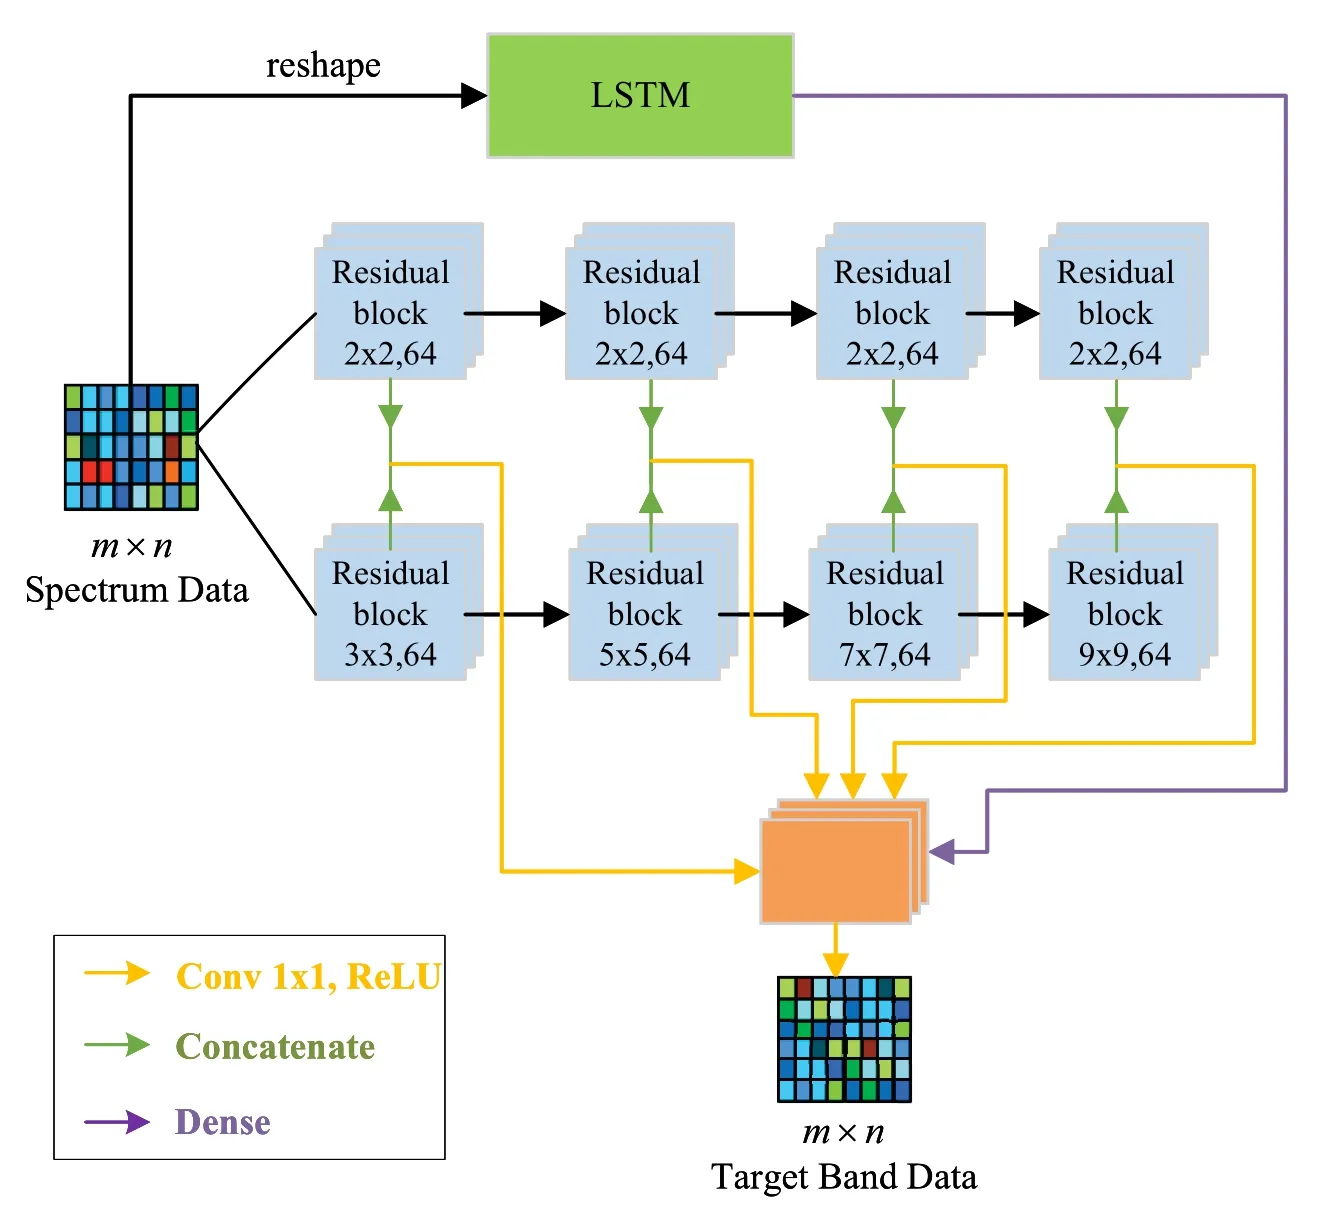
Figure 5.The structure of Generator.
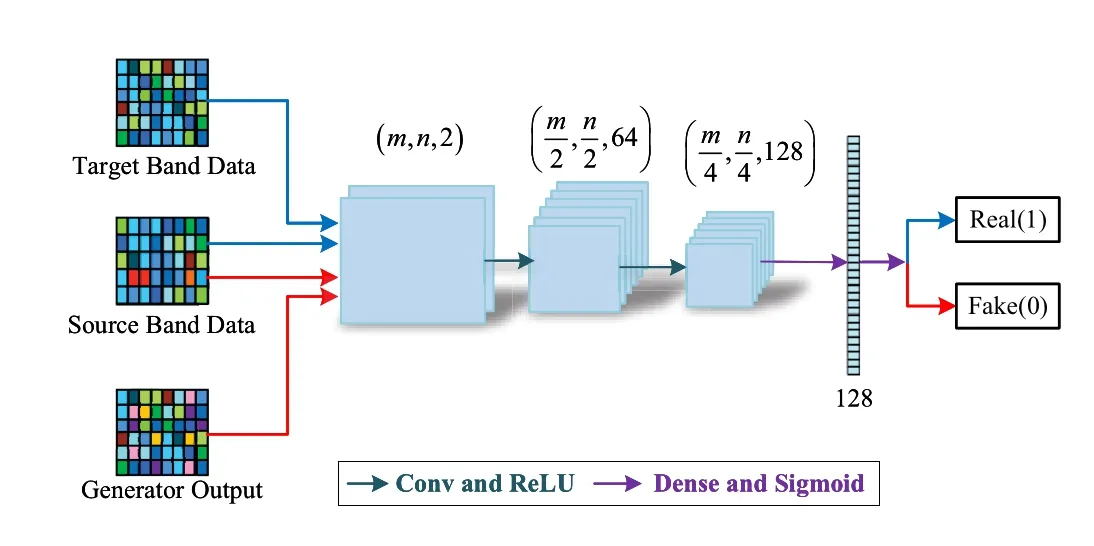
Figure 6.The structure of Discriminator.
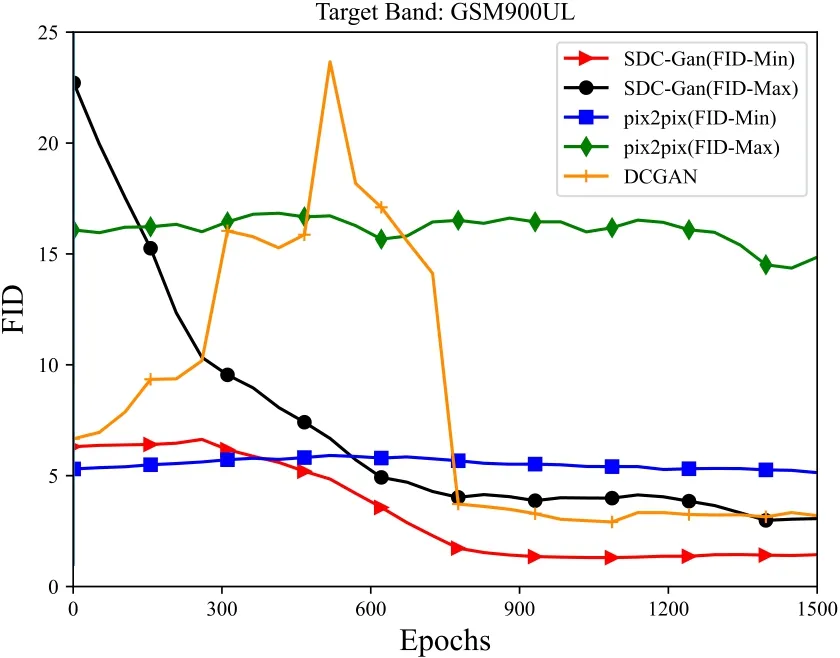
Figure 7.FID changes with epochs(GSM900UL).
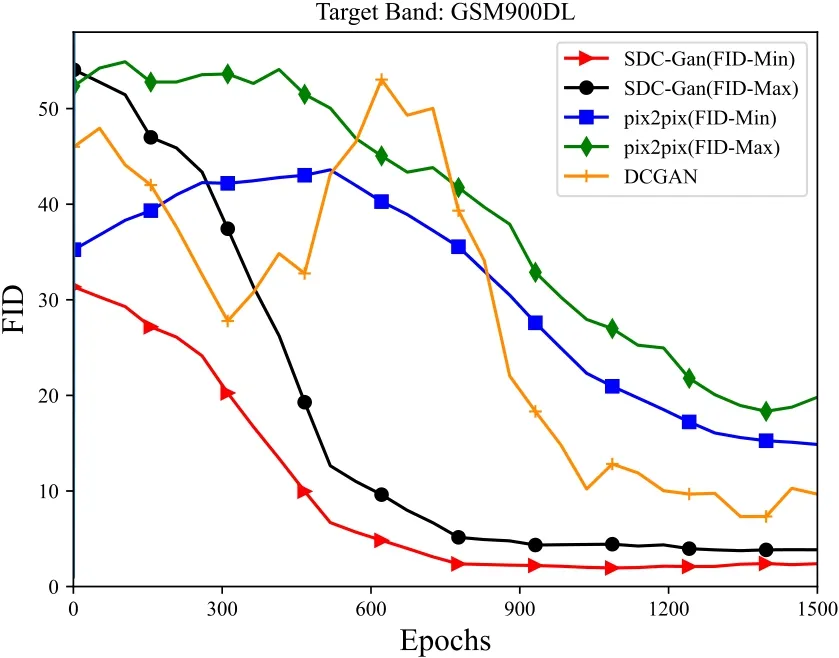
Figure 8.FID changes with epochs(GSM900DL).
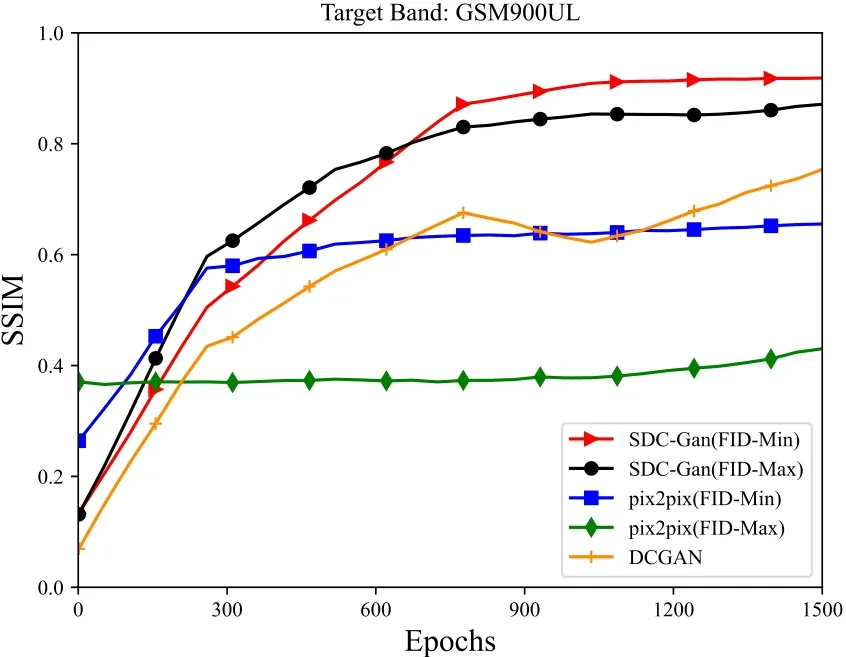
Figure 9.SSIM changes with epochs(GSM900UL).
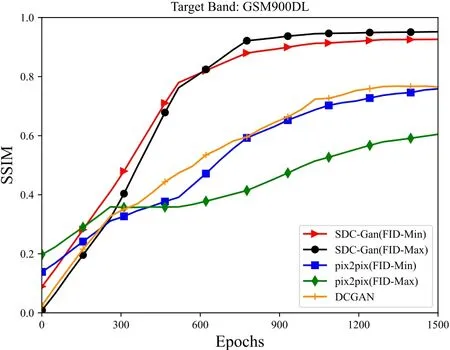
Figure 10.SSIM changes with epochs(GSM900DL).
The generator model of SDC-GAN consists of a two-way multilayer convolutional feature extraction network formed by the Residual Unit,an LSTM module and a feature selection module.The blue squares in Figure 5 represent the Residual Unit,and the numbers in the squares represent the parameters of the convolution operation,e.g.‘2x2,64’means the convolution kernel size is(2x2)and the number of convolution channels is 64.The upper branch of the convolutional feature extraction network has a convolutional kernel size of 2x2.The small size of the convolutional kernel allows for the extraction of information between adjacent data.The size of the convolution kernels in the lower branch of the convolutional feature extraction network grows from 3x3 to 9x9 as the network progresses,increasing the range of features extracted from the data.In addition,the network fuses and selects features from the outputs of the upper and lower branches at all levels by merging and reducing the dimensionality.
Unlike convolutional operations,the LSTM module can extract the temporal features of the sequence and discover temporal correlations in the data.The features extracted by the layers of the convolutional network are merged with the temporal features extracted by the LSTM module.We use a convolution kernel of 1x1 to achieve dimensionality reduction and complete the transformation of the spectral data.The generator combines deep convolutional features and temporal features of spectrum data with a more robust feature extraction than using only CNN and LSTM models.Theoretically,the generator’s input is the rich source band data,and the output is the target band data,realizing the cross-band transfer of spectrum data.
The discriminator has a simple structure,consisting of a multi-layer convolution module and a fully connected module.When the source band data and the target band data are input to the discriminator,the result is true,and the output is 1.When the source band data and the generated image are input to the discriminator,the result is false,and the output is 0.Although the idea for this paper was initially derived from the pix2pix network,the same Markov discriminator as pix2pix was not used[28].The pix2pix networks deal with image style transformation problems where the image structure does not change much.Markov discriminators work better as discriminators when dealing with this type of problem.We deal with the spectral data conversion problem,from an image perspective,the source and target band data are widely distributed and structurally less similar.For this problem,Markov discriminators do not perform well.
IV.EXPERIMENT EVALUATION
This paper addresses the problem that prediction models cannot be used directly across frequency bands.Little historical data is available for the target band,with a cross-band spectrum prediction algorithm based on GAN for data transformation.Since the samples of spectrum data need to be considered as pictures in the experiments,the sample size is first defined.Let the time step of a single sample bem=40 and the number of contained frequency points ben=80.Assuming that the amount of available data in the target band is small,the number of samples in the target band for the experiment is 120,and there are 3000 samples in all the five bands except the target band.
4.1 Spectrum Data Conversion Performance Comparison of Each Model
The GSM900UL and GSM900DL are used as the target frequency bands,respectively,to verify the algorithm’s performance.The target frequency band data is expanded using data conversion,assuming that the amount of data available in the target frequency band is tiny.In the experiments,the comparison algorithms were pix2pix as well as DCGAN.Due to the particular structure of CycleGAN,it does not apply to the task of image structure change [22],so we did not consider it a comparison algorithm.The number of target band samples was 120,and each epoch was trained by transforming 120 samples from any of the 3000 source band samples,for a total of 1500 epochs trained.Figures 7 and 8 show the variation of the FID scores of the generated and target data for each algorithm with the training process.Figures 9 and 10 show the SSIM values of the generated and target data.FID-Min indicates that the source frequency band for network training is the frequency band with the slightest difference from the target band.For the GSM900UL band,the FID-Min source band is the GSM1800UL.For the GSM900DL band,the FID-Min source band is the GSM900UL.FID-Max stands for the source band that is the most different from the target band for network training.For the GSM900UL band,the FID-Max source band is the GSM1800DL.For the GSM900DL band,the FID-Max source band is the ISM.The FID score and the structural similarity(SSIM)between the generated data and the actual data of the target band are used as the evaluation metrics,and the SSIM is defined as:
whereµrepresents the mean,σrepresents the variance,andc1andc2are constants used to maintain stability.
The experimental results show that the SDC-GAN proposed in this paper has obvious performance advantages over DCGAN and pix2pix in both test bands.In the experiments where the target band is GSM900UL,pix2pix is not adequate,especially when the difference between the source band and the target band is significant(FID-Max).The two indicators do not change much with the increase in training times,which indicates that the network conversion ability is poor.When the target band is GSM900DL,all three algorithms show good conversion ability with increasing training times,the FID score decreases,and the SSIM parameter values increase.The SDC-GAN effect is significantly better than the pix2pix and the DCGAN.For simplicity of presentation,we only compare the results of each model from the FID-Min band.When the target band is GSM900UL,SDC-GAN reduces the FID scores by about 3.74 compared to the pix2pix and about 1.73 compared to the DCGAN.This difference is more apparent when the target band is GSM900DL,and the FID scores of pix2pix is about 14.8 after 1500 epoch training.The FID of the DCGAN is about 9.8,while the FID of SDC-GAN is only 2.5.In addition,we found that the SSIM values of the DCGAN are more stable and similar to the pix2pix.Still,the FID scores fluctuate more because the FID is more sensitive to model fluctuations,indicating that the DCGAN is less stable for the problem studied in this paper.
Figure 11 shows the comparison of the final output of each algorithm generator with the actual spectrum data.We found that the DCGAN generated data is similar to the actual data structure,but the data is more unstable.Pix2pix network generated data is different from the actual data in structure.The accuracy of the data generated by pix2pix and DCGAN is poor.The SDC-GAN generates data with a similar structure to the actual data,with less data volatility and higher accuracy.In addition,we also found that there is less temporal variation data in the generated data,which is because it is difficult for the generative model to learn these irregular temporal variation features.For this reason,in the next experiment,we use the generated data to train the network and then finetune the model with real data to make the model learn the real data distribution.
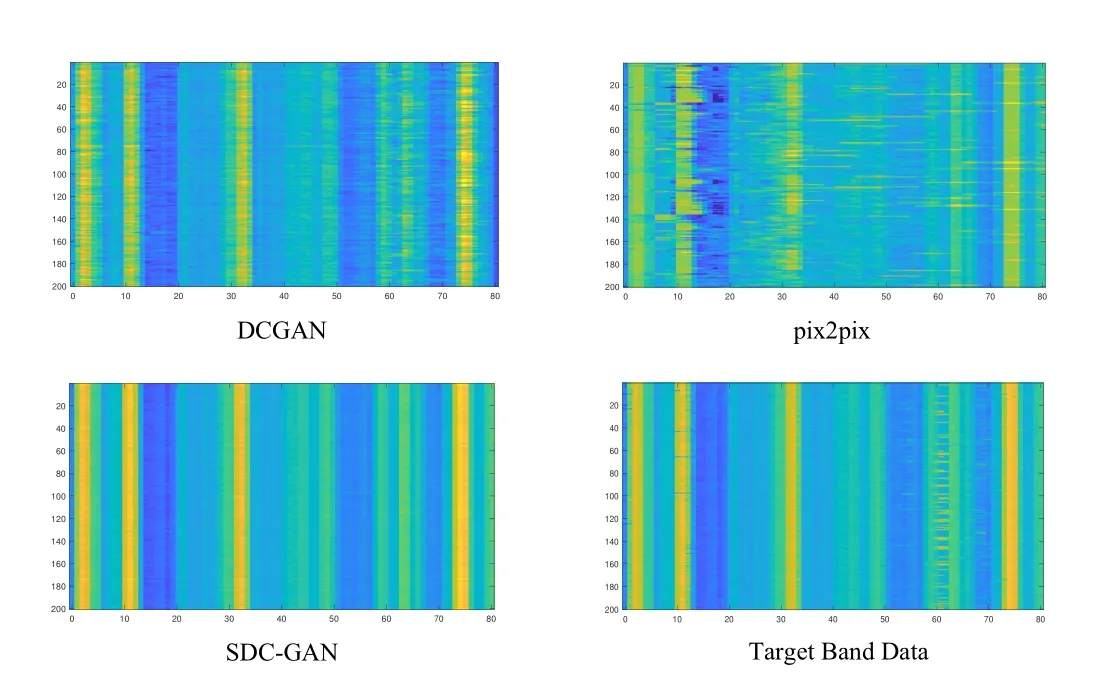
Figure 11.Generator output for different models.
In addition,we found a significant performance advantage for data migrated from similar frequency bands(FID-Min)compared to the most different band(FID-Max).When the network is untrained,there is a significant difference between the initial FID scores for the source band FID-Min and FID-Max.The model with FID-Min as the source band has a more robust data conversion capability as the network continues to optimize the parameters to achieve spectrum data convertion.In comparing the two metrics,we also find that the SSIM parameters appear to be better for SDC-GAN (FID-Max) than SDC-GAN(FID-Min) when the GSM900DL is the target band.This may be related to the data fluctuation in the target frequency band.Although the difference in data space between GSM900DL and GSM900UL is slight,the data in both bands are highly volatile and fastchanging,which may be responsible for the converted data by GSM900UL being worse than the converted spectrum in the ISM band in terms of structural similarity.The difference in SSIM metrics between SDCGAN (FID-Min) and SDC-GAN (FID-Max) is minimal,less than 2%.However,SDC-GAN (FID-Min)outperforms SDC-GAN (FID-Max) in terms of FID metrics,indicating that the data converted from similar source bands are more similar to the target band in terms of distribution.
Table 2 shows the time of 100 epochs run for the three models and the number of parameters.In comparison,SDC-GAN has the least number of generator parameters but the most number of discriminator parameters.The SDC-GAN model has fewer convolutional channels,significantly reducing the number ofgenerator parameters.However,since the discriminator of SDC-GAN contains two fully connected layers,it makes the number of discriminator parameters much higher,enhancing the discriminator’s performance.In general,the number of parameters of SDC-GAN is similar to DCGAN,and both are smaller than the pix2pix network.In terms of running time,SDC-GAN is more time consuming compared to pix2pix as well as DCGAN models.During training,the discriminator needs to be trained before the overall model is trained,and the SDC-GAN model has significantly more discriminator parameters than the other two networks.In addition,the fully connected layers in the generator and discriminator of SDC-GAN increase the memory occupation during model training and reduce the training speed of the model.
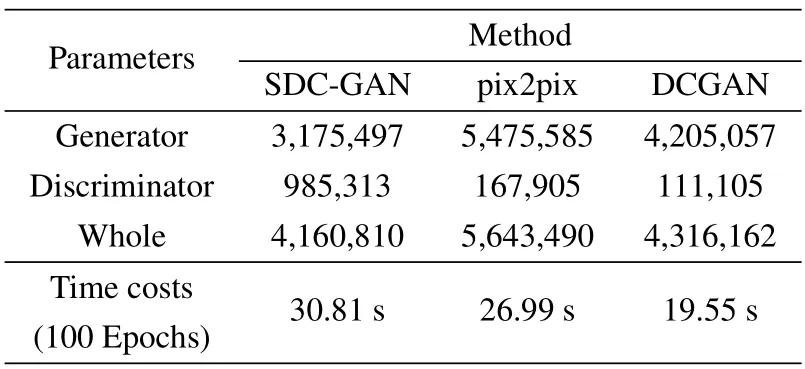
Table 2.Parameters and Time cost of each model.
4.2 Model Structure Performance
To reflect the rationality of the network structure,we explore the effect of the change in the SDCGAN model structure on the performance of spectral data conversion.The experiments include five models: the standard SDC-GAN,the model with the generator without LSTM(Model-G1),the model with the generator convolutional feature extraction module as a single-way convolutional network (Model-G2),the model with the same discriminator as DCGAN(Model-D1),and the model with the same discriminator as pix2pix(Model-D2).This experiment is still conducted in GSM900UL and GSM900DL frequency bands,and the frequency band with the most significant difference between the two target bands is chosen as the source band,respectively.Figure 12 to Figure 15 show the FID scores of each model and the variation of SSIM with the number of training epochs.
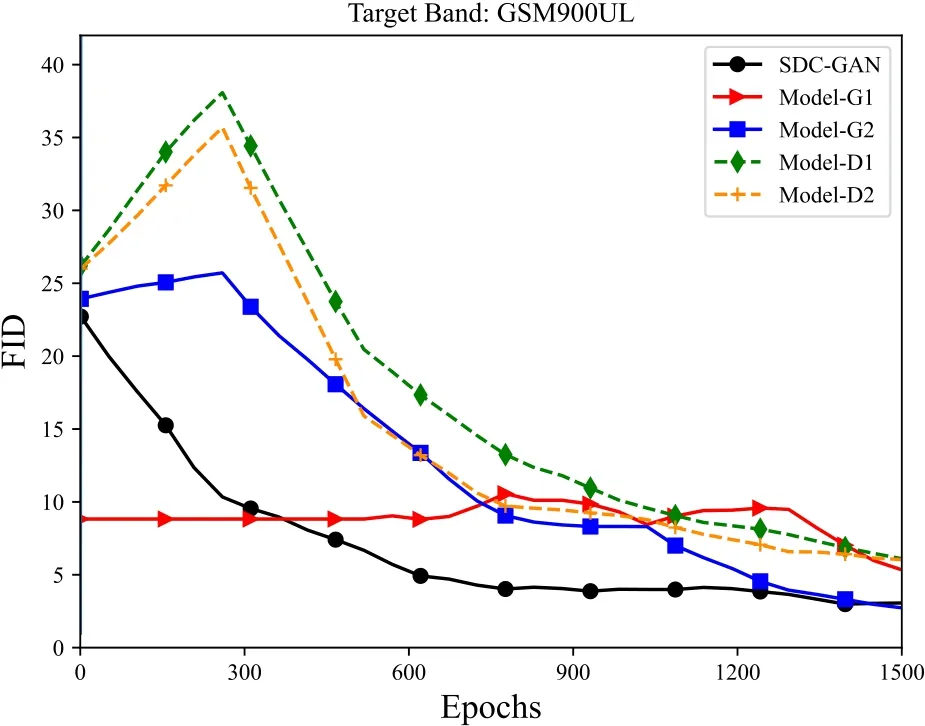
Figure 12.FID changes with epochs(GSM900UL).
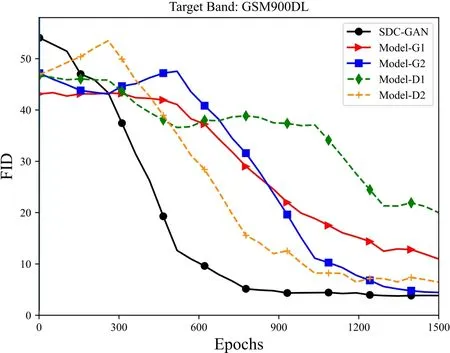
Figure 13.FID changes with epochs(GSM900DL).
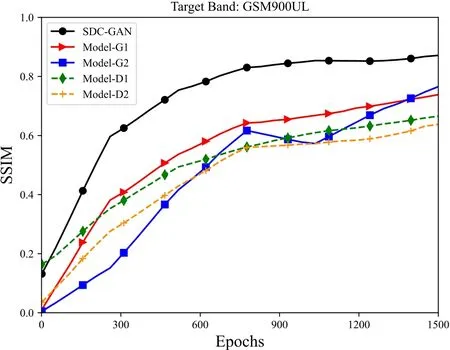
Figure 14.SSIM changes with epochs(GSM900UL).
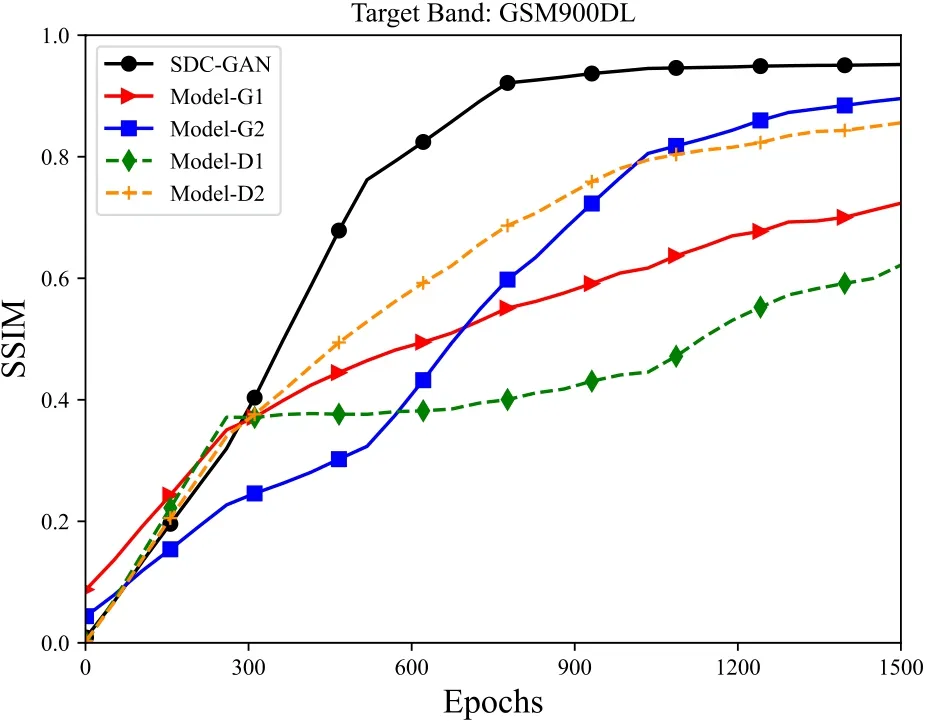
Figure 15.SSIM changes with epochs(GSM900DL).
In the figures,the standard SDC-GAN is shown as a solid black line.The colored solid lines represent two models with different generators.The colored dashed lines represent two models with other discriminators,respectively.The SDC-GAN achieves the best data conversion results in both target bands,and the better model is Model-G2,which requires more rounds of training than the standard SDC-GAN model to achieve the same sample quality.As in the case of GSM900DL as the target band,the original model only requires about 800 epochs of training for the FID and SSIM parameters to reach stability.In contrast,the model using Model-G2 requires about 1500 training epochs to achieve stability.The single-way convolutional network model is weaker than the two-layer convolutional network model in extracting high-dimensional features.The generator structure of the SDC-GAN reflects a more powerful transformation capability.In the GSM900UL band,the FID scores is reduced by 2.27,and the SSIM is improved by about 0.13 compared to Model-G1.
Both changes in the discriminator structure cause a decrease in the model performance.The discriminator with the same structure as DCGAN has less input information,which leads to the poor stability of this discriminator.When the target band is GSM900DL,the performance advantage of the SDC-GAN model is more prominent,with an SSIM improvement of about 0.32 compared to Model-D1 and significant performance advantage compared to Model-D2.
4.3 Prediction Method Based on Spectrum Conversion Data
This paper aims to propose a spectrum prediction algorithm based on spectrum data conversion in the case of small samples.For this purpose,the above two experiments verify that the proposed SDC-GAN model has a powerful spectrum data conversion capability and can realize the expansion of the target band data.To verify whether the data generated by the band migration can support the training of the prediction model and eventually complete the spectrum prediction effectively,we complete the training of the subsequent prediction model based on the data generated by the model in Section 4.1.Although the generated data are similar to the real data,some actual change characteristics are still missing compared with the received data.Therefore,we first uses the generated data to train the prediction model and then uses only a small amount of real data to finetune the prediction model and improve the prediction effect.
The generator of SDC-GAN has powerful feature extraction capability,so we directly use the generator model as the prediction network model.The comparison algorithms include a prediction model trained with a sufficient amount of data(Sufficient-Training),a similar band prediction model with a small amount of target band data finetuned (Finetune-Min),a small amount of target band data finetuned with a significant difference source band(Finetune-Max),an LSTM model trained with a sufficient amount of data,and a ConvLSTM model trained with sufficient data.In addition,we show three prediction results based on data transformation,which are obtained by training the network with transformed data of SDC-GAN(Our Method1),DCGAN(Our Method2)and pix2pix(Our Method3).The models based on sufficient data are trained with 3000 samples,and the models using the finetuning method are trained with 3000 samples in the source band and finetuned with 100 samples in the target band.The method based on the framework of this paper uses generated data to train the model and finetune the model using the same real data as the comparison algorithm.
We use RMSE,MAE and MAPE as evaluation indicators,where P is the actual spectrum data and ˆP is the predicted spectrum data.The smaller the value of the three evaluation indicators,the stronger the model’s prediction performance.According to the parameter setting of Section 4.1,the GSM900UL and GSM900DL band are used as the target frequency bands for the prediction experiments.Among them,the experimental results of the GSM900UL band are shown in Figure 16.The experimental results of the GSM900DL band are shown in Figure 17.
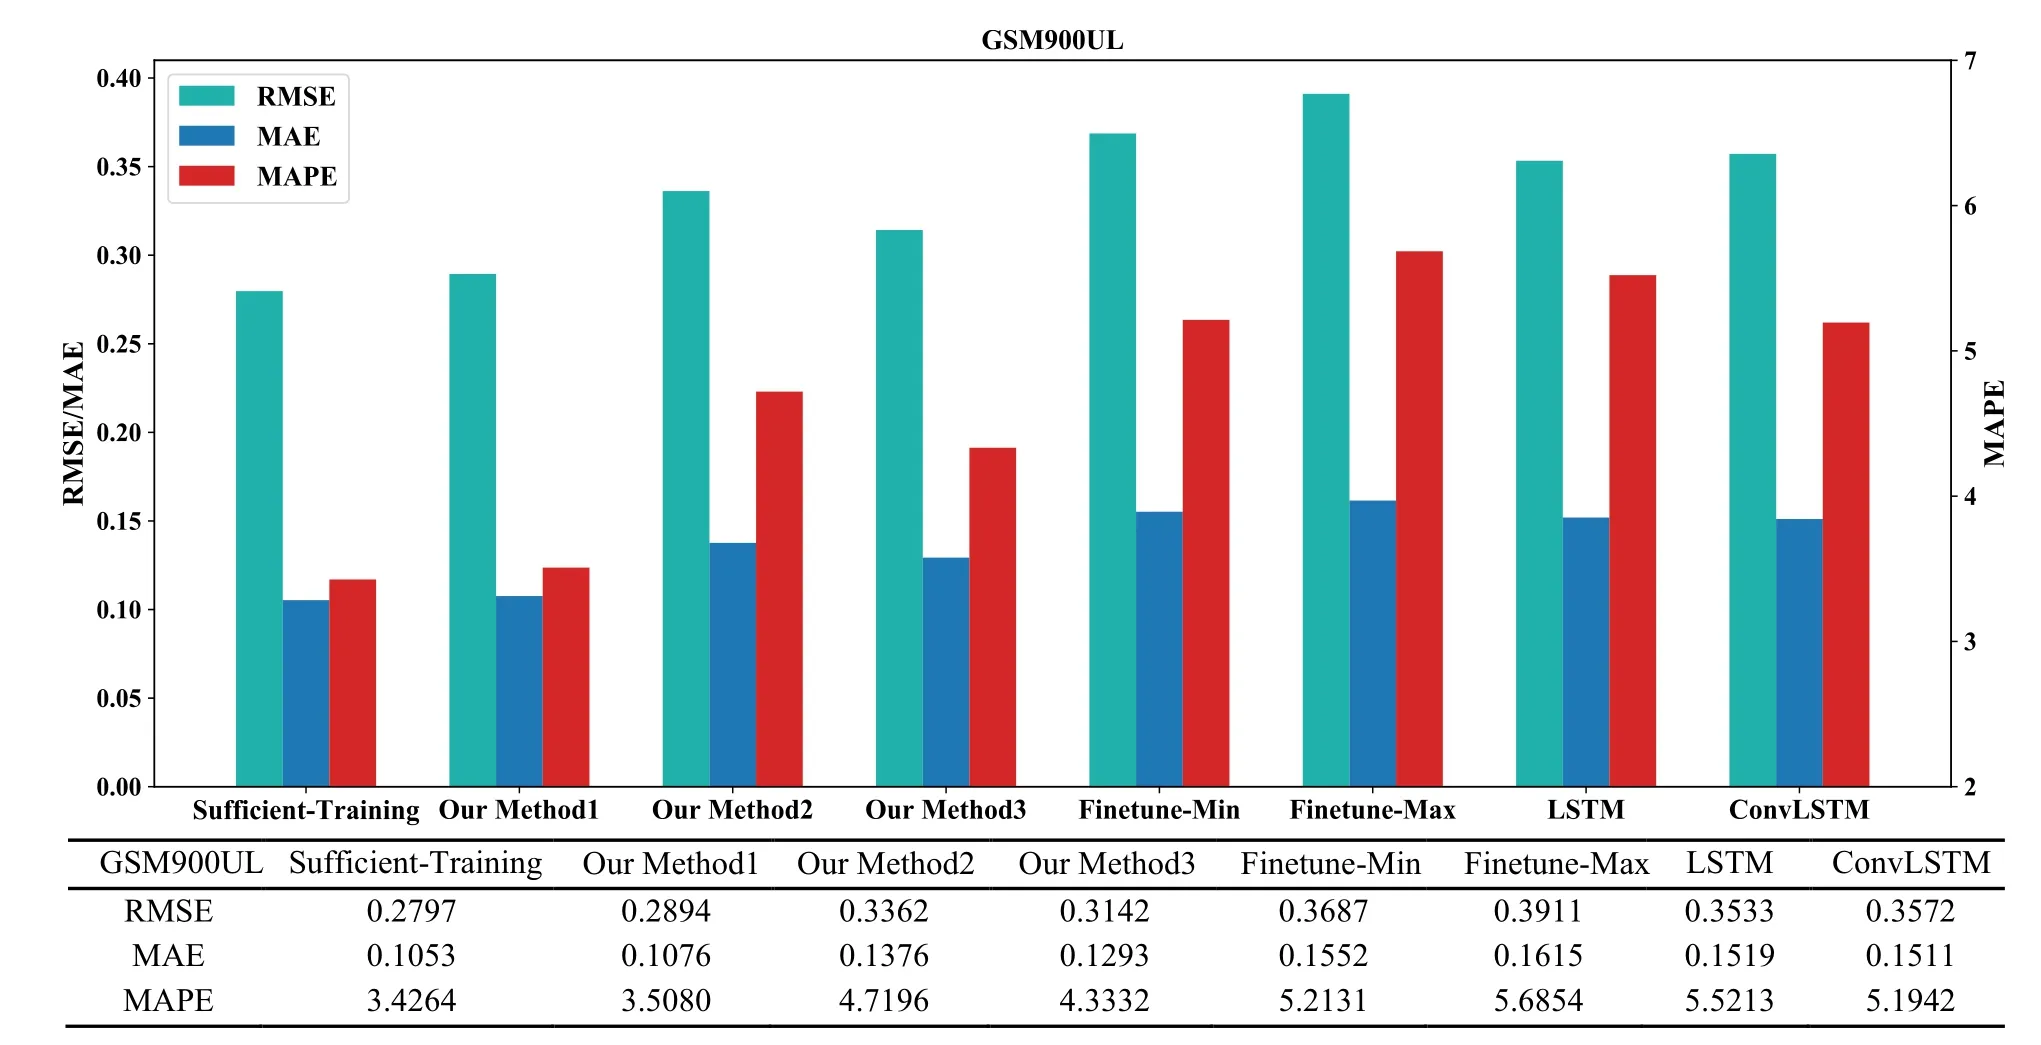
Figure 16.Prediction performance of different algorithms in GSM900UL band.
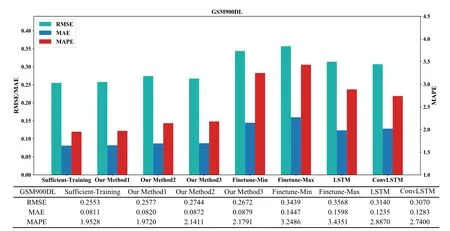
Figure 17.Prediction performance of different algorithms in GSM900DL band.
The spectrum prediction experimental results analysis shows that the model trained with sufficient data has the smallest values of all three metrics and has the best prediction performance.The value of the metrics of the data conversion based spectrum prediction method is slightly larger than that of sufficiency training,and the performance is close.The three results using the framework of this paper outperform the two finetuned prediction models (Finetune-Min and Finetune-Max) and the LSTM and ConvLSTM models trained with sufficient data in both frequency bands.Among them,in the GSM900UL band,the algorithm in this paper reduces RMSE by about 8%,MAE by about 13% and MAPE by about 10% compared to the transfer learning method using finetune by similar frequency bands.The advantage is even more apparent in the GSM900DL band,with a significant performance improvement than the direct finetune approach.We find that all three data conversion-based prediction results outperform the finetune method,mainly because the data conversion extends the target band and makes more data available to the model.The prediction was better when SDC-GAN was used as the data conversion model(Our Method1).In addition,it was found that the performance of the two finetunebased prediction methods differed significantly.The model’s finetuned performance by similar frequency bands is considerably better than that of finetuned by the frequency bands with significant differences.In the prediction of the GSM900UL band,the RMSE of Finetune-Min is decreased by about 11%compared to Finetune-Max,which is a significant performance advantage.
Based on the analysis of different frequency band data,the prediction method in this paper is explored and verified through the above three experiments.First,the practicability and performance advantages of the proposed algorithm are verified in two assumed target bands.Then,the network structure is explored by changing the generator model and discriminator model,and the rationality of the SDC-GAN model is proved.Finally,the performance of the proposed algorithm is verified by prediction experiments.Compared with other finetuned transfer learning methods,the proposed algorithm has obvious advantages in prediction performance.Two conclusions can be drawn from the experiment: The method based on data conversion can achieve cross-band spectrum data prediction when there is less available data;And the source frequency band with less difference is more easily converted to the target frequency band and has better data similarity.
V.CONCLUSION
This study aims to investigate cross-band spectrum prediction algorithms,and we propose a framework for cross-band prediction algorithms using GAN for data conversion.The framework can be divided into three parts: training of the SDC-GAN,data conversion,and cross-band prediction.By calculating the FID scores to analyze the inter-band variability,we identify the available bands with the slightest variance from the target band.We constructed the SDCGAN,the generator module consisting of a convolutional network capable of hierarchical feature extraction and an LSTM module.The network has an efficient spectrum conversion capability to transform the history data of source band into target band.We use a sufficient amount of generated data to train the prediction model and finetune the model parameters using a small amount of real data.This method can achieve effective spectrum prediction with fewer data available in the target band.The experimental results show that the proposed algorithm has higher prediction accuracy than the direct finetuning transfer learning method.We intend to investigate more direct cross-band prediction methods and explore a more efficient model in the future and make the cross-band prediction algorithm timely.
ACKNOWLEDGEMENT
This work was partly supported by the fund coded,National Natural Science Fund program (No.11975307)and China National Defence Science and Technology Innovation Special Zone Project(19-H863-01-ZT-003-003-12).
- China Communications的其它文章
- SR-DCSK Cooperative Communication System with Code Index Modulation: A New Design for 6G New Radios
- Sparsity Modulation for 6G Communications
- Sparse Rev-Shift Coded Modulation with Novel Overhead Bound
- Reconfigurable Intelligent Surface-Based Hybrid Phase and Code Modulation for Symbiotic Radio
- Model-Driven Deep Learning for Massive Space-Domain Index Modulation MIMO Detection
- Modulation Recognition with Frequency Offset and Phase Offset over Multipath Channels

