
Research on the sampling performance of a new bionic gravity sampler
2023-08-22 01:22YongqiangGEJiaminHEJinGUOPeihaoZhANGHaoWANGZiqiangRENXiaolingLEYingWANGYuhongWANGJiawangCHEN
Yongqiang GE,Jiamin HE,Jin GUO,2,Peihao ZhANG,Hao WANG,2,Ziqiang REN,2,Xiaoling LE,Ying WANG,2,Yuhong WANG,Jiawang CHEN,2,3✉
1Ocean College,Zhejiang University,Zhoushan 316021,China
2Hainan Institute,Zhejiang University,Sanya 572025,China
3The Engineering Research Center of Oceanic Sensing Technology and Equipment,Ministry of Education,Zhoushan 316021,China
Abstract: Gravity sampling is of vital importance for sampling seabed sediments and understanding submarine sedimentary environments and resources.In this study,a new bionic sampler tube (BST) with non-smooth surface for low-disturbance and rapid sampling is presented.The BST with depressions and swellings on its surface was designed on the model of the non-smooth surface of the dung beetle.Sufficient theoretical calculations,numerical simulations,and experimental tests were carried out to study its sampling performance.The penetration depth,sample length,and frictional drag of the sampler tube were calculated.The finite element model and the coupled Eulerian-Lagrangian (CEL) method were used to analyze and compare its sampling performance.Laboratory and field gravity sampling tests were conducted and the results demonstrated the advantages of the BST in improving sampling performance and in reducing adhesion and drag.
Key words: Deep-sea gravity sampling; Bionic sampler tube (BST); Non-smooth surface; Sampling performance; Drag reduction
1 Introduction
Gravity sampler is a common technique used to obtain seabed sediment samples so as to determine the chemical composition and mechanical properties of seabed soil.It is of great significance for understanding the historical environmental changes of Earth,predicting long-term climate changes,and searching for new resources (Ye et al.,2005).Gravity samplers are widely used in the acquisition of deep-sea sediment samples due to their simple sampling principle and mechanical structure,low design cost,and easy installation (Magagnoli,2017).
Gravity samplers have been successfully applied in deep-sea sampling and their sampling ability has been validated (Curry et al.,2008; Chen et al.,2013;Ruan et al.,2017; Wang et al.,2018; Ren et al.,2020).However,the currently used sampler tubes may cause large mechanical disturbance of the soil sample during the sampling process.This can easily bend and deform the sample,destroy the integrity and accuracy of its physical and mechanical parameters,and cause irreversible changes to it (Francis and Lee,2000).
Bionics is one of the most effective methods of reducing drag against soil.Studies have shown that specific shapes are regularly or irregularly distributed on the non-smooth surfaces of an animal’s body,which can reduce adhesion and drag (Ren et al.,2002; Roudbeneh and Vakilian,2020).The interface between the non-smooth surface and soil will produce a microvibration effect,water film effect,and gas film effect,which reduce the contact area and time and generate an air membrane,thereby reducing soil adhesion and frictional drag (Ren et al.,2002,2004).Roudbeneh and Vakilian (2020) designed corrugated blades inspired by the geometrical shape of the body surface of Armadillidium vulgare.Experimental results showed that the bionic corrugated blade showed the lowest drag force in wet soil.Ren et al.(2002,2004) designed some bionic bulldozer blades,which were tested and proved to reduce draft force,indicating that a properly designed non-smooth surface can minimize the cutting drag of the curved surface of a bulldozer blade.Deng (2004),Soni et al.(2007),and Chirende et al.(2010) applied a bionic non-smooth surface to the disc plough and the mould-board plough and showed that the bionic nonsmooth surface can reduce adhesion and drag.At present,bionic non-smooth surfaces are usually flat and there has been little research into tubular structures with such surfaces.
In this paper,firstly the mechanical processes of the gravity sampler tube are analyzed,and the penetration drag and the disturbance of the soil sample are discussed.Secondly,a comparative analysis of the different bionic sampler tubes (BSTs) is conducted based on the coupled Eulerian-Lagrangian (CEL) method.Thirdly,the bionic non-smooth sampler tubes are designed and manufactured,and laboratory and field sampling tests are carried out.Finally,conclusions are drawn.
2 Analysis of the mechanics of gravity sampler tubes
2.1 Disturbance analysis of the soil sample
The study of the squeeze of the sampler tube during the sampling process is usually idealized and simulated as a series of spherical holes expanding to an equivalent diameter formed by the spherical cavity continuum (Cheng et al.,2018; Ge et al.,2022).During sampler tube penetration,the surrounding soil will undergo large shear deformation,and a damage zone will be formed.The soil around the tube will be squeezed and reach a plastic flow state.As shown in Figs.1a and 1b,when the sampler tube penetrates the soil,spherical holes are generated (Chang et al.,2015).Based on the spherical cavity expansion model and the Mohr-Coulomb yield criterion,the radial displacement in the elastic-plastic interfaceupcan be obtained:
whereEis the elastic module,μis Poisson’s ratio,Rpis the radius of the plastic zone,Puis the ultimate reaming pressure around the cavity,cuis the undrained shear strength,andRuis the ultimate radius after cavity expansion.
The relative radius of the plastic zone can be expressed as:
whereGis the shear module.
Pucan be expressed as:
The frictional drag between the sampler tube and soil can be expressed as:
whereαfis the coefficient of friction andAsis the contact area between the sampler tube and soil.
Detailed calculation results are given in Section S2 of the electronic supplementary materials (ESM).
2.2 Penetration drag analysis of the sampler tube
As shown in Fig.1c,the sampler tube is subjected to three types of drag during the sampling process.Frictional drag is the interaction force between the sampler tube and sediment soil during penetration,including frictional drag of the inner wall,the outer wall,and the knife edge.The frictional drag is an important parameter for evaluating the disturbance of the sample soil.The lower the frictional drag,the better the drag reduction and the lower the disturbance effect of the sampler tube.
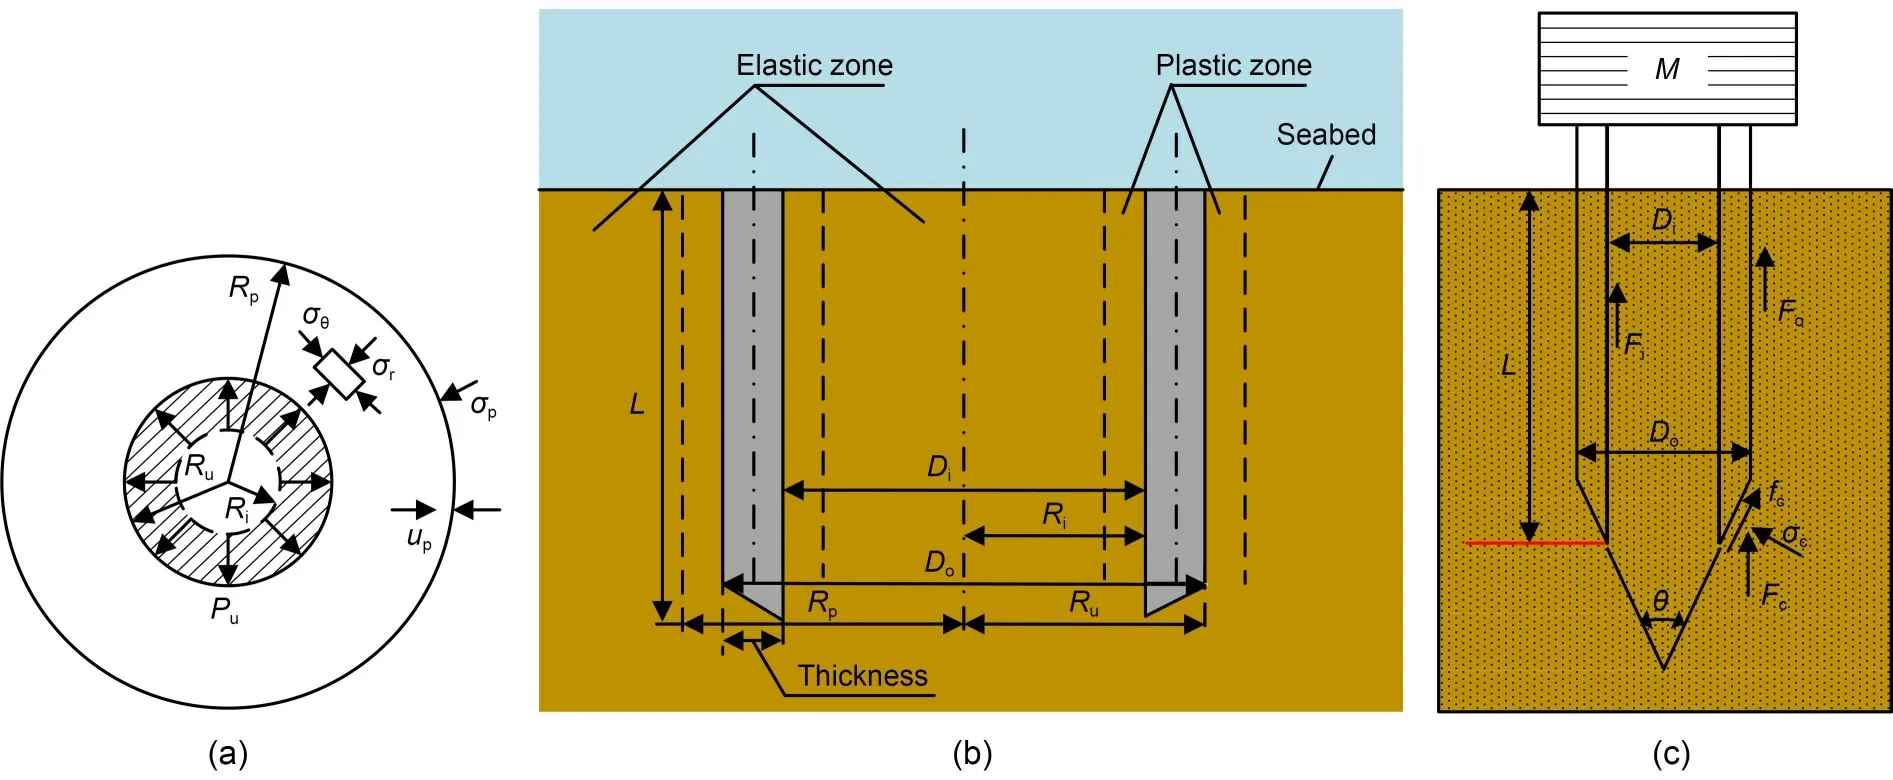
Fig.1 Diagram of spherical cavity expansion model (a and b) and frictional drag analysis of the sampler tube (c).Ri is the initial radius of the hole; up is the radial displacement after cavity expansion; σr is the radial stress; σθ is the circular stress; L is the penetration depth; σp is the radial stress at the boundary of the plastic zone; M is the weight of the sampler tube; σc is the compressive stress of the knife edge; fc is the frictional drag of the knife edge
According to Smith’s wave equation analysis,the frictional drag on the inner surface of a sampler tubeFican be expressed as (Smith,2021):
whereJsis the coefficient of viscosity drag on the surface of the sampler tube,vpis the penetration velocity,Diis the inner diameter of the sampler tube,αf,iis the coefficient of friction on the inner surface,andlis the sample length.
The frictional drag on the outer surface of the sampler tubeFocan be expressed as:
whereDois the outer diameter of the sampler tube,αf,ois the coefficient of friction on the outer surface,andksis the enhancement factor of the shear strength.
The drag at the knife edge of the sampler tubeFccan be expressed as (Chen et al.,2013):
whereJcis the coefficient of viscosity drag of the knife edge,θis the inclination angle of the knife edge,andαf,cis the coefficient of friction on the knife edge.
Detailed calculations are given in Section S3 of the ESM.
3 Finite element analysis of large deformation in the sampling process
3.1 CEL method
Finite element modelling of large deformation and penetration uses the CEL method,which is very effective in handling fully coupled multi-physics simulations such as a fluid-structure interaction.Qin et al.(2016) and Staubach et al.(2021) investigated various geotechnical problems using the CEL approach and confirmed its applicability to problems involving large deformations.
The soil is tracked as it flows through a Eulerian mesh,fixed in space,by computing the material volume friction in each element.The sampler tube is discretized with Lagrangian elements,which can move through the Eulerian mesh without drag until they encounter Eulerian elements containing soil,as shown in Fig.2a.
3.2 Model details
3.2.1 Characteristic of soil and sampler tube
Considering the symmetry of the sampling process and the improvement of calculation efficiency,only the semi-model is simulated and analyzed in this study.The sampler tube is an isotropic homogeneous rigid body composed of Lagrangian elements.Its specifications and material parameters are shown in Table 1 and Fig.2f.

Table 1 Parameters of the sampler tube and soil used in CEL analysis
The Mohr-Coulomb criterion (MCC) soil constitutive model was adopted for this study.The soil parameters in the ‘CC’ region of the central and eastern Pacific Basin were chosen for the analysis (GMGS,1993),and are listed in Table 1.
The radius and height of the model soil are 0.8 and 3.5 m,respectively.The soil is separated into two parts: the lower part,filled with soil,and the void upper part,which is used to heave by containing the extruded soil during sampling process,as shown in Fig.2b.The heights of the lower part and upper part are 3.15 and 0.35 m,respectively.
3.2.2 BST
Studies have shown that the non-smooth surface of the dung beetle can reduce adhesion and drag,and its shape and arrangement determine the effect of drag reduction (Ren et al.,2002,2004).Therefore,the surface morphology of the sampler tube can be designed by simulating that of the dung beetle to achieve a longer penetration depth and sample length.
In Section 4.1,we compare the sampling effects of the NST (with smooth surface) and the BST (with bionic non-smooth surface).The size specifications of the two are the same,and the inclination angle of the knife edge of the BST is 30°.The diameter of the depressions and swellings on the surface of the BST is 5 mm and 24 of them are evenly distributed on its circumference with an axial interval of 40 mm.The types of BST,including the bionic sampler tube with swellings on the outer surface (STSO),the bionic sampler tube with depressions on the outer surface (STDO),and the bionic sampler tube with depressions on the inner surface (STDI),are shown in Figs.2d and 2e.
In the parameter analysis carried out in Sections 4.2 and 4.3,the influence of the size and distribution characteristics (i.e.,circumference distribution,axial interval,and diameter) of swellings and depressions on sampling performance was studied.The variation ranges of the three parameters are shown in Table 2.

Table 2 Variation ranges of the circumference distribution,axial interval,and diameter of swelling and depression on the BST
3.3 Mesh and boundary conditions
The soil is discretized into a three-dimensional eight-node Eulerian continuum with reduced integration (EC3D8R).The sizes of the soil elements below and in the tube are 2.5 and 3.0 mm,which areh/3 andD/26 of the tube,respectively.The tube is discretized into a hexahedron three-dimensional eight-node continuum with reduced integration (C3D8R).The thickness of the bionic tube increases due to the swelling on the surface and thus the range of soil mesh densification is also expanded,as shown in Fig.2c.Other parameters of the BST are set the same as for the NST.
In the analysis,the gravity load was first applied to the soil to establish the initial in-situ stress states prior to gravity coring.The bottom boundary nodes were fixed in the vertical direction,but were free to move horizontally,while the lateral boundary nodes were fixed in the horizontal direction but were free to move vertically,and the tube was fixed in the expected vertical direction.Initially,the tube,with a point mass of 15.14 kg,hung above the subsoil and then moved toward the soil under gravity acceleration with an initial velocity of 6 m/s.The coefficient of friction between tube and soil was set to 0.4.
4 Simulation results and discussion
4.1 Effective factors on gravity sampling
4.1.1 Inclination angle of the knife edge
The influence of the inclination angles of the knife edge of the gravity coring tube was studied (hereinafter referred to as the inclination angle).The inclination angle was changed from 15° to 45° with changing intervals of 5°.For comparison,the other geometric parameters were kept the same.Two types of simulation were carried out: (1) only changing the inclination angle;(2) taking the tube with an inclination angle of 15°and a weight of 15.14 kg as a reference and performing weight compensation for the tube with other inclination angles.The simulation results are shown in Fig.3.
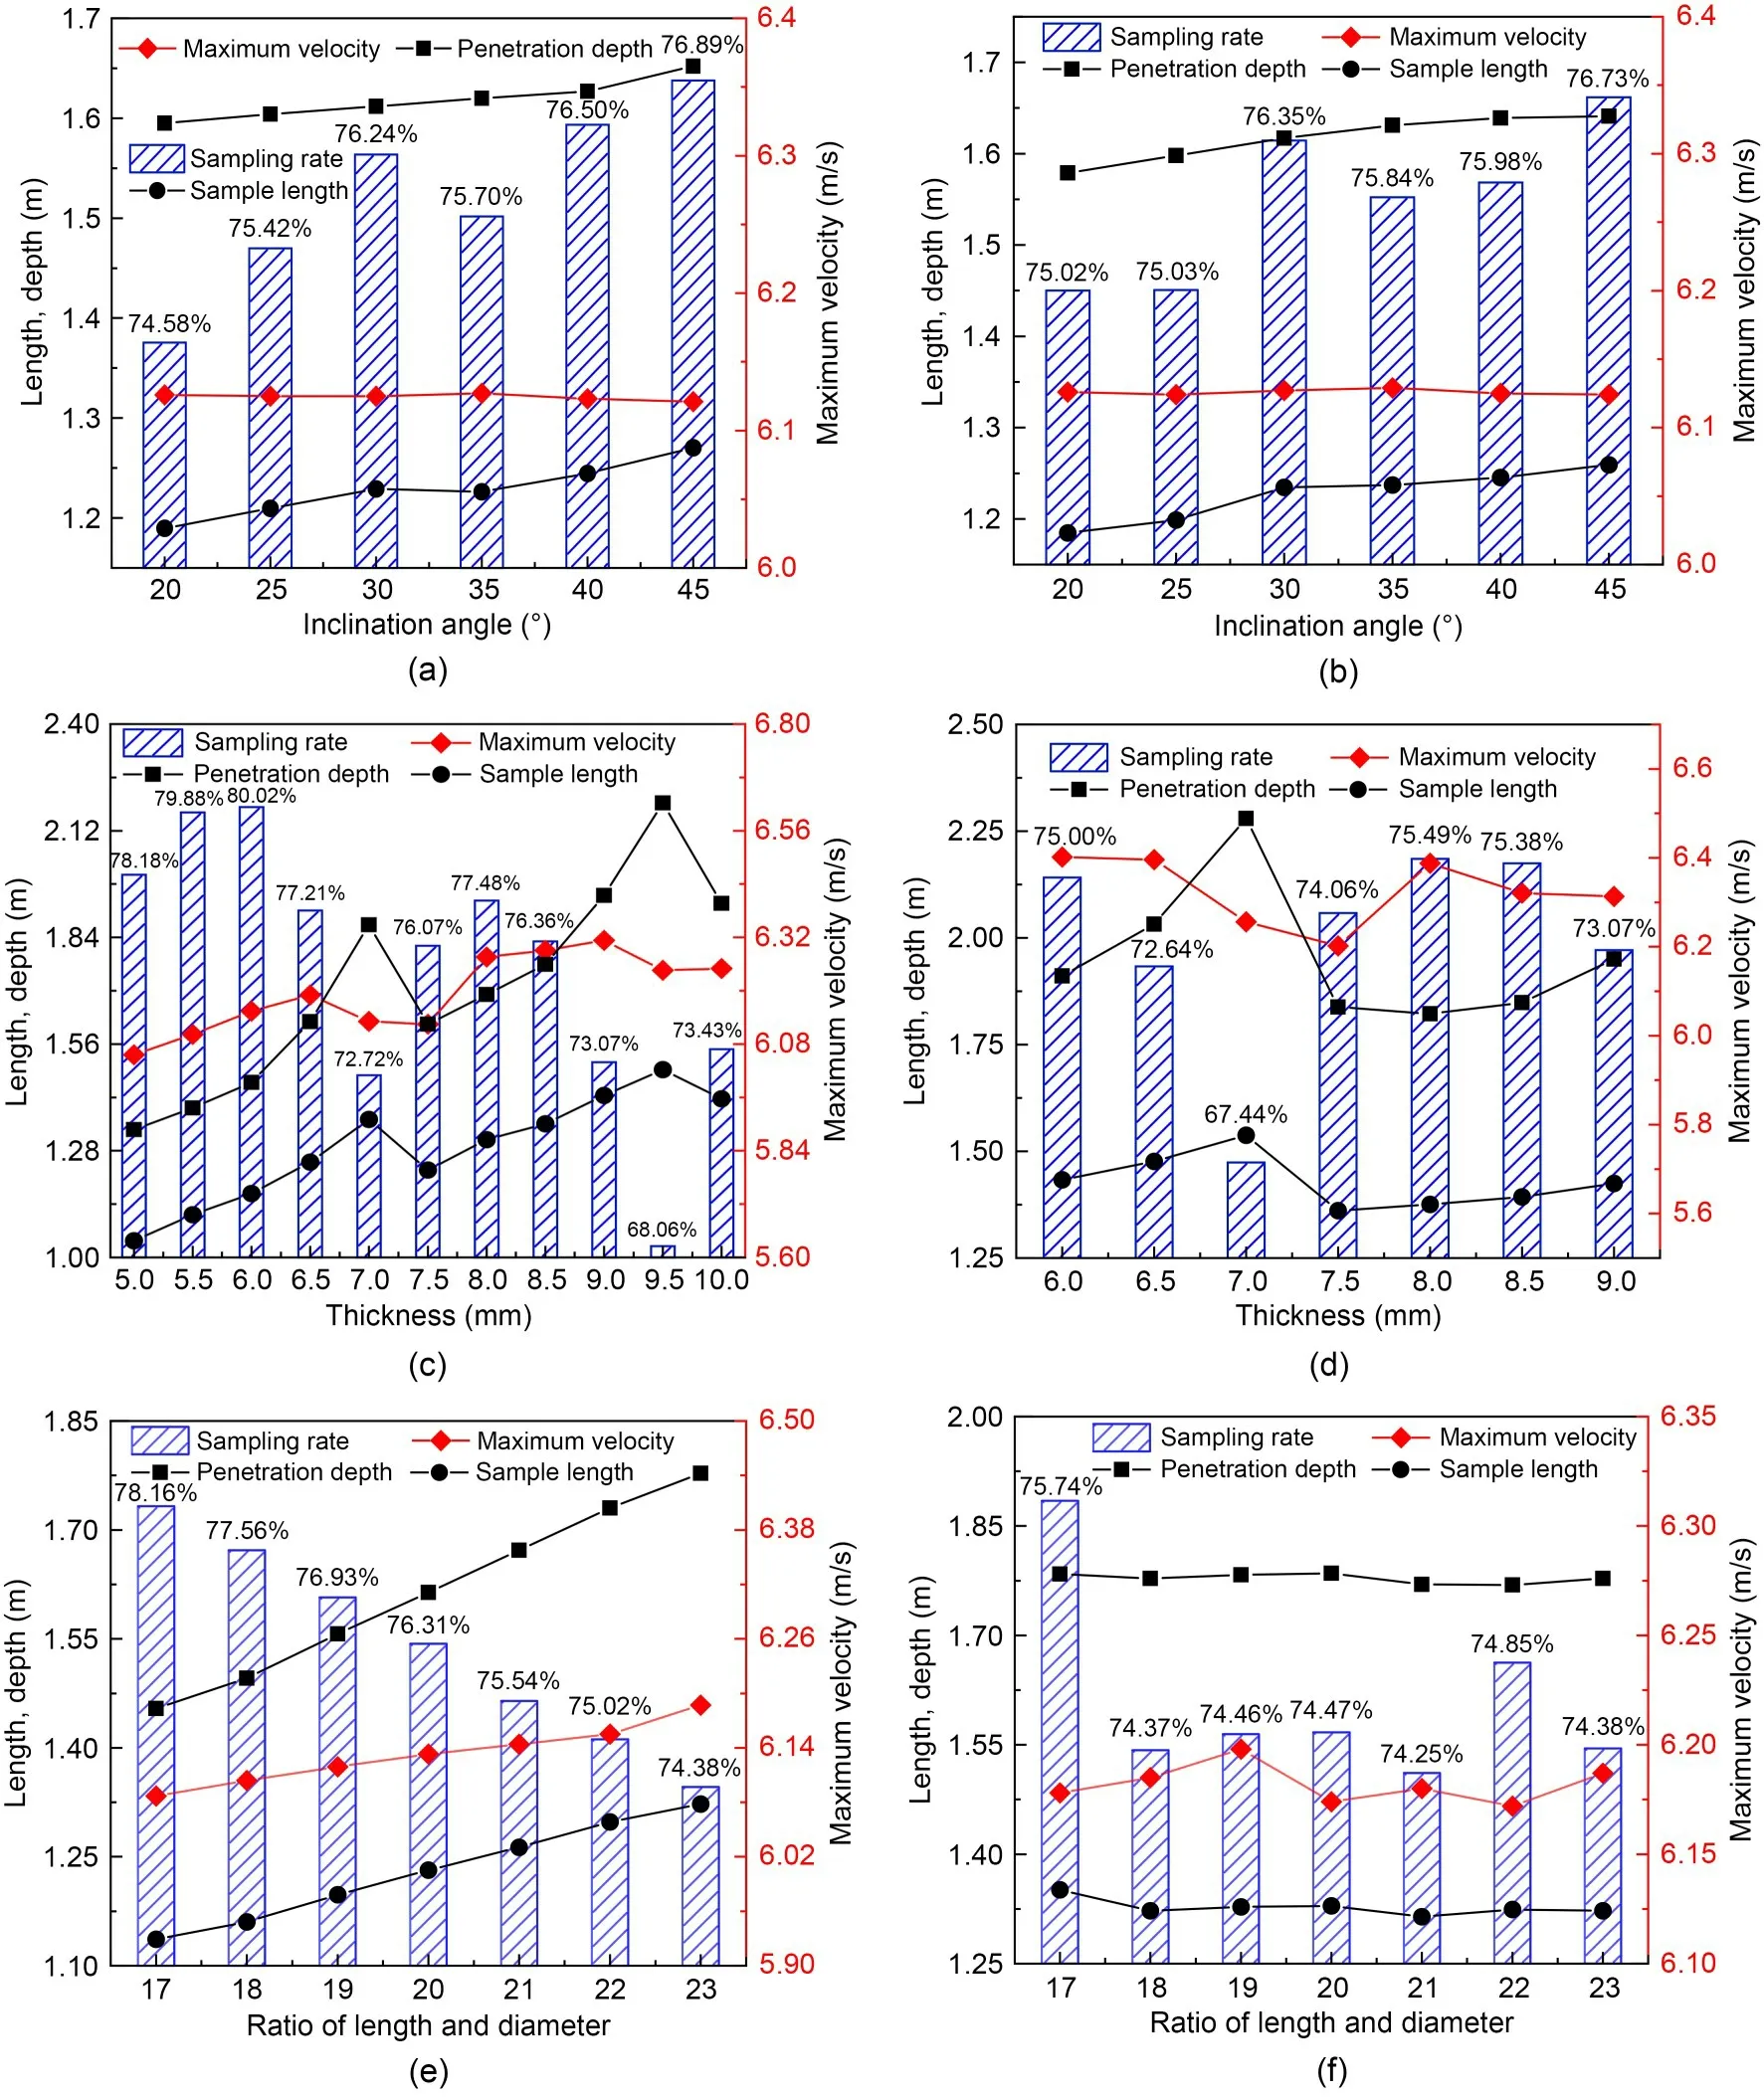
Fig.3 Sampling performances of the sampler tube with different factors: (a) inclination angle; (b) inclination angle with weight compensation; (c) wall thickness; (d) wall thickness with weight compensation; (e) ratio of length and diameter;(f) ratio of length and diameter with weight compensation
As shown in Fig.3b,the penetration depth,sample length,and sampling rate all increased with the increase of the inclination angle and,at 45°,reached a maximum of 1.641 m,1.259 m,and 76.73%,respectively.However,the maximum penetration velocity drops when the inclination angle reaches 45°.The maximum penetration velocity of the tube is an important indicator for evaluating the disturbance of the sample soil.Therefore,the inclination angle was set to 30° in the subsequent calculations.
Taking the tube with an inclination angle of 15°and a weight of 15.14 kg as a reference,the sampling performances of the tube with different inclination angles with weight compensation were compared,as shown in Fig.3b.When the inclination angle is 30° to 35°,the sampling performances are generally improved,but when the inclination angle is 20° to 25° or 40° to 45°,the performances are weakened.Since the weight compensation is small,the sampling influence is small and limited.
4.1.2 Wall thickness
The vertical strain of the soil element,as well as the sampling performances of the tube,is affected by the thickness of the tube wall.The inner diameter of the tube is 80 mm,and the thickness changes from 5.0 to 10.0 mm with a changing interval of 0.5 mm.A total of 11 sets of simulation tests were carried out.Similarly,weight compensation is also considered and the simulation results are shown in Fig.4.
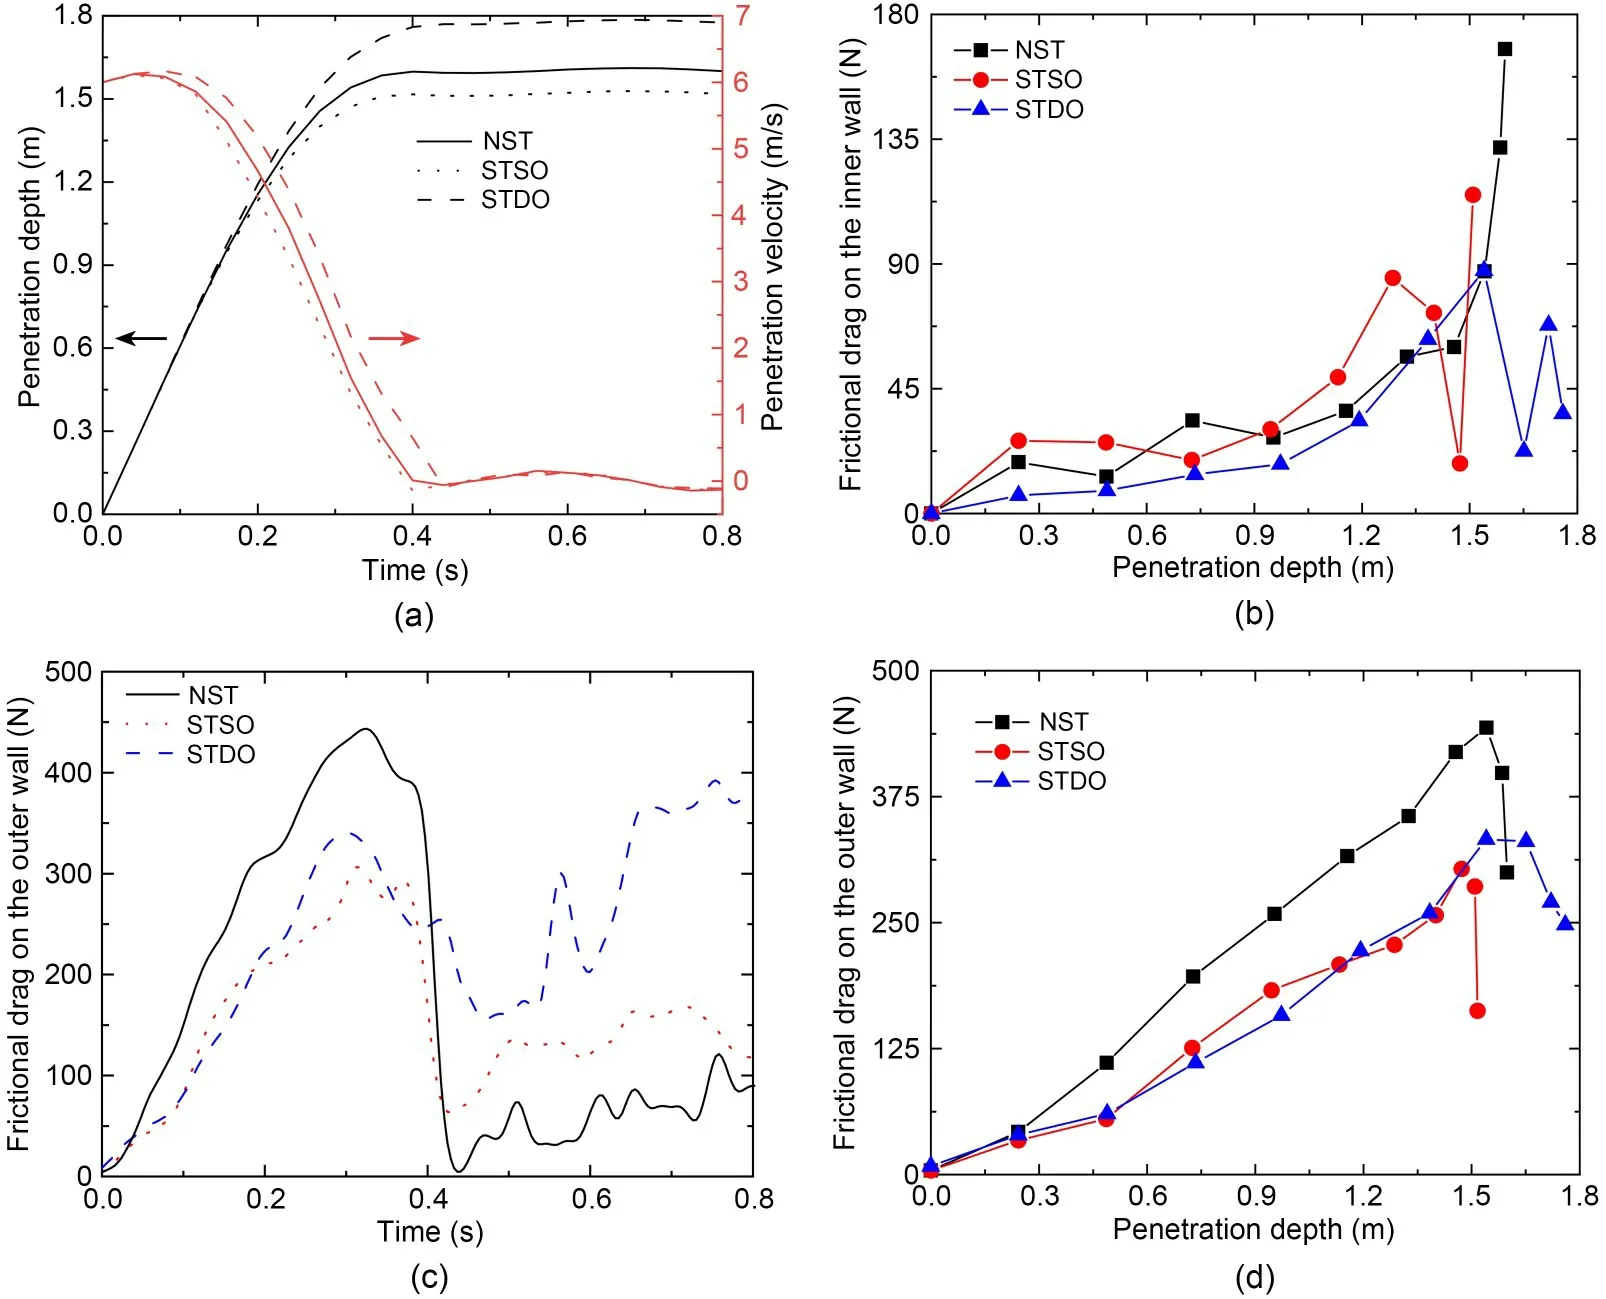
Fig.4 Penetration depth and velocity,and frictional drag of the sampler tube: (a) penetration depth and velocity; (b)frictional drag on the inner wall; (c and d) frictional drag on the outer wall
In Fig.3c,the weight compensation is not considered.The sampling performance of the tube with a wall thickness of 7.0 mm is better than that of the tubes with thicknesses of 7.5 and 8.5 mm.Thus,it can be seen that thickness has an important impact on sampling and a thinner tube can compensate for its smaller initial weight.Moreover,the same conclusion can be obtained by comparing the results of the tubes with thicknesses of 9.5 and 10.0 mm.
Fig.3d presents the results with weight compensation.The weights of the tubes are 18.43 kg,and the wall thickness varies from 6.0 to 9.0 mm with a changing interval of 0.5 mm.Overall,the penetration depth and sample length of the thinner tube are better than those of thicker tubes.It is worth noting that both the penetration depth and sample length reached their maximum values of 2.28 and 1.54 m when the tube thickness is 7.0 mm,but the sampling rate is the lowest,which also occurs when the tube thickness is 9.5 mm,as shown in Fig.3c.
4.1.3 Ratio of length and diameter
To study the effect of the ratio of length and diameter of the tube on the gravity coring,and to exclude the influence of initial mass and energy,the weight,inner diameter,and thickness of the tube were set to 17.62 kg,80 mm,and 7.5 mm,respectively.The length of the tube varies from 1615 to 2185 mm with a changing interval of 95 mm,which is the out diameter shown in Fig.2f; thus,the ratio of the length and the outer diameter varies from 17 to 23.As shown in Fig.3e,without weight compensation,the penetration depth and sample length increased as the ratio of the length and diameter of the tube increased.Fig.3f presents the results with weight compensation.Overall,when the weight of the sampler tube is the same,the influence of the ratio on the penetration depth is very small.When the ratio is 17,the penetration depth,sample length,and sampling rate reach the maximum values,which are 1.78 m,1.35 m,and 75.74%,respectively.
4.2 Sampling performance of the BST with bionic non-smooth outer surface
4.2.1 Penetration depth,velocity,and sample length Fig.4a shows the penetration depth and velocity of the NST and BST during sampling.The velocity shows three stages: (1) the acceleration stage,in which the self-weight of the tube is greater than the penetration drag and thus the velocity continuously increases and reaches the maximum after 0.04 s; (2) the deceleration stage,in which the drag is greater than the selfweight of the tube,resulting in a gradual reduction of the velocity to zero; (3) the stable stage,where penetration and sampling are completed,and the velocity remains stable at zero.The orders of decreasing rate of the penetration velocity: STSO>NST>STDO,and the maximum penetration velocity: STDO (6.166 m/s)>NST (6.125 m/s)>STSO (6.106 m/s),indicate that the STDO can obtain the same sample length in a shorter time,which can reduce sample disturbance.
In the comparisons of the final penetration depth and the sample length,both orders are: STDO>NST>STSO.More specifically,compared with the NST,the penetration depth and sample length of STDO increased by 10.7% and 8.8% respectively,indicating that the STDO has better sampling ability and effect.The penetration depth and sample length of the STDO were 1.785 and 1.337 m,and those of the STSO were 1.528 and 1.147 m.
4.2.2 Frictional drag
Fig.4b shows the frictional drag on the inner wall of the tube.As the penetration depth increases,the frictional drag generally tends to increase.At the deepest penetration depth,the drag of the NST is the greatest,while the STDO is the smallest.In addition,the penetration depth of STDO is the largest,but the drag of its inner wall is still smaller than NST.Figs.4c and 4d shows the frictional drag on the outer wall of the tube in the sampling process.Similarly,the frictional drag of the NST is the largest,while those of STSO and STDO are close during sampling.
Fig.4c shows the changes of the frictional drag on the outer wall.Fig.4a shows that the penetration depth of the sampler tubes no longer increases when the sampling time is about 0.4 s.However,the drag on the outer wall still exists.Especially for STDO,the drag is even larger than that during penetration.It may be due to the soil entering the depressions during the micro-vibration stage,resulting in an increase of the soil-tube contact area and the frictional drag.In that stage,the moving velocity is small,and the spherical contact area of the STSO is larger than that of the NST,and thus its drag is also larger.
The sample in the sampler tube mainly comes from the stage between when the tube is first penetrating and when the velocity is first reduced to zero,and thus,the stage at 0.0-0.4 s is important.The magnitude of the drag on the inner and outer walls of the tube can indicate the degree of disturbance of the soil.The drag of the STDO and STSO is significantly lower than that of the NST at 0.0-0.4 s,indicating that the BST is beneficial for reducing the frictional drag and disturbance of the soil.
In general,the STDO can not only reduce the frictional drag and disturbance of the soil sample,but also improve the sampling performance,including penetration depth and sample length.
Details of the theoretical and numerical calculation results are given in Section S3 of the ESM.
4.2.3 Parameter analysis of the characteristics of depressions on the outer surface
4.2.3.1 Circumferential distribution
Fig.5a shows the results when the number of the depressions distributed in the circumferential direction changes from 6 to 30 with a changing interval of 6.As the depressions become denser,the penetration depth and sample length gradually increase,and the velocity reaches a maximum of 6.17 m/s when there are 12 depressions on the circumference.
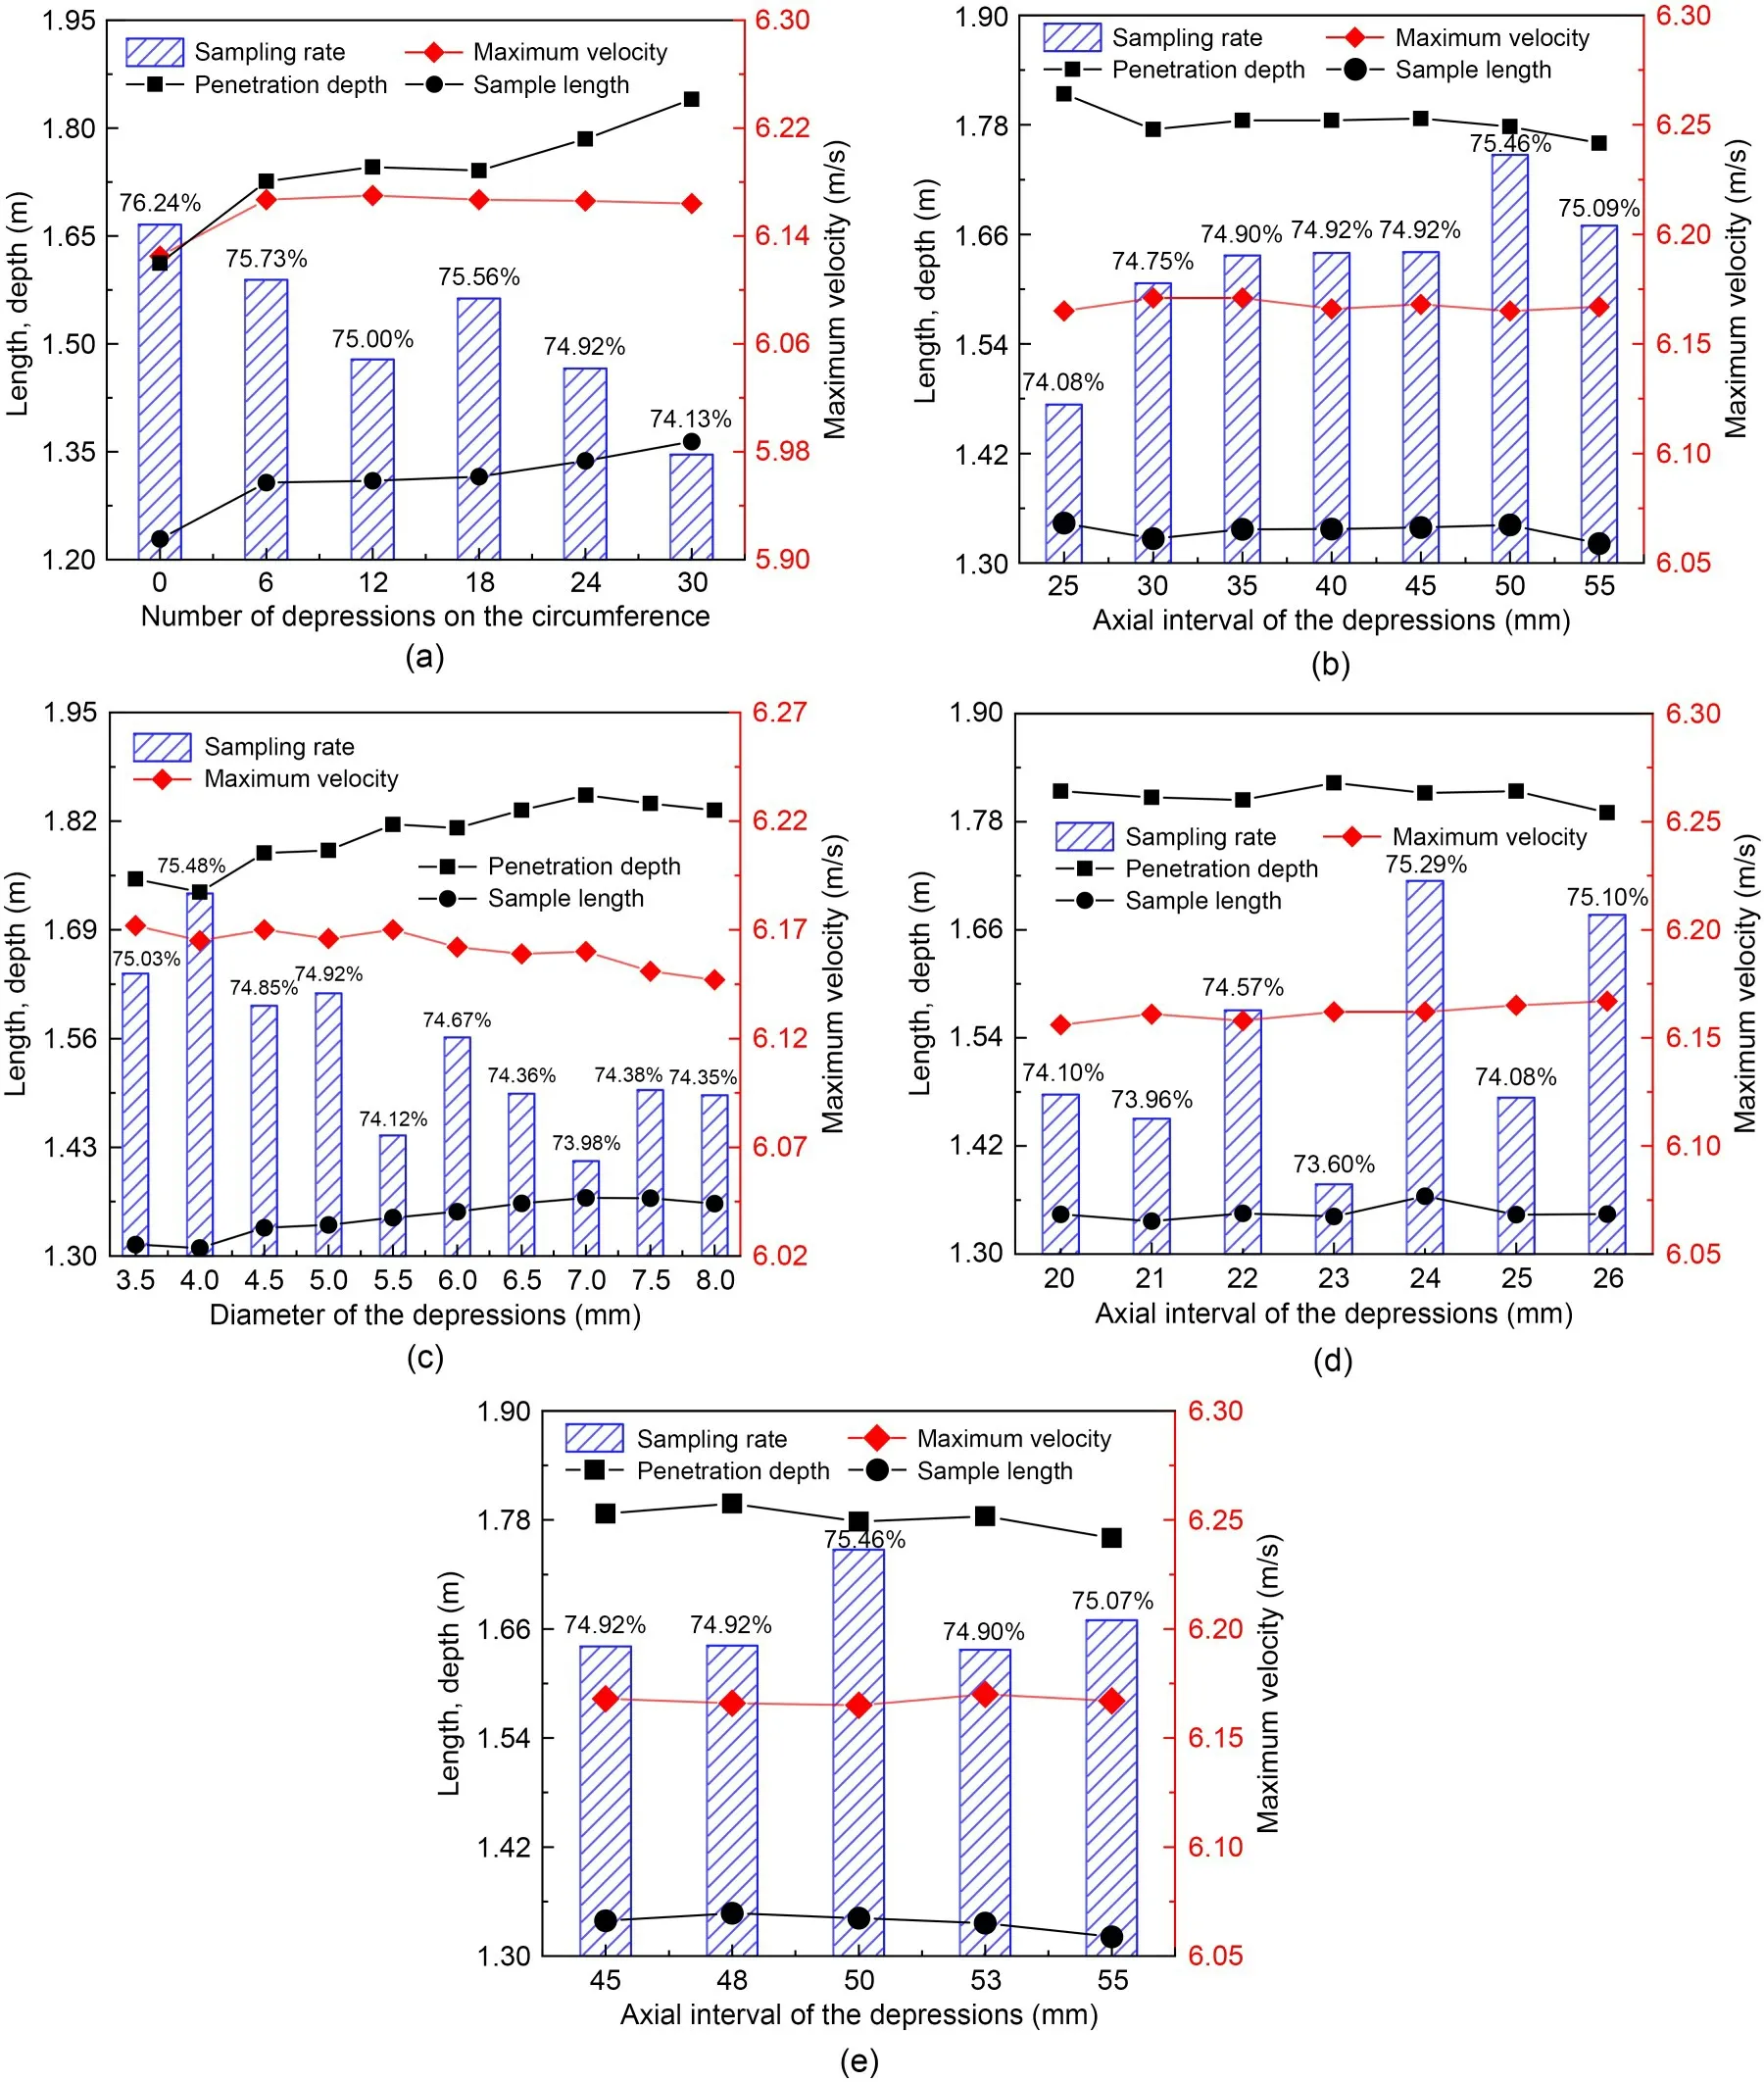
Fig.5 Influence of different factors on sampling performance: (a) circumferential distribution; (b) axial interval; (c)diameter; (d) axial intervals from 20 to 26 mm; (e) axial intervals from 45 to 55 mm
4.2.3.2 Axial interval
Fig.5b shows the results when the axial interval of the depressions (hereinafter referred as the axial interval) changes from 25 to 55 mm with a changing interval of 5 mm.Both the penetration depth and sample length show three-stage changes,namely decreaseincrease-decrease; thus,there are two peak values when the axial intervals of the depressions are 25 and 50 mm.However,the change of the maximum penetration velocity is opposite,and the sampling rate is very close.
More detailed parameter analysis was carried out near 25 and 50 mm,and the results are shown in Figs.5d and 5e.In Fig.5d,when the axial intervals are 23 and 24 mm,the penetration depth and sample length respectively reach maximum values of 1.823 and 1.364 m.The maximum penetration velocity increases as the axial interval increases and reaches a maximum of 6.167 m/s when the axial interval is 26 mm.As shown in Fig.5e,when the axial interval is 48 mm,both the penetration depth and the sample length reach the maximum values in this group: 1.798 and 1.347 m,respectively.The maximum penetration velocity reaches 6.171 m/s when the axial interval is 53 mm.
As shown in Fig.5b,from a comprehensive point of view,the axial intervals of the depressions corresponding to the optimal values of the four indicators are not the same.When the axial interval is 20-25 mm,the penetration depth and sample length are significantly larger than those for other axial intervals,and the penetration depth and sample length respectively reach their maximum values of 1.823 and 1.346 m when the axial intervals are 23 and 24 mm.The penetration velocity reaches a maximum value of 6.171 m/s when the axial intervals are 30 and 35 mm,and the sampling rate reaches the maximum value of 75.46% when the axial interval is 50 mm.
4.2.3.3 Diameter
Fig.5c shows the results when the diameter of the depressions (hereinafter referred to as the diameter)changes from 3.5 to 8.0 mm with a changing interval of 0.5 mm.The penetration depth and sample length respectively reach the maximum values of 1.851 and 1.369 m when the diameter is 7.0 mm,and the penetration velocity reaches the maximum value of 6.170 m/s when the diameters are 4.5 and 5.5 mm.
4.2.3.4 Summary
The comparison between the optimal values of the STDO and the NST is shown in Figs.4 and 5.The STDO can significantly improve the sampling ability and effect compared with NST.The maximum penetration depth and maximum sample length are increased by 14.8% and 11.4%,respectively.The diameter of the depressions has the greatest influence on the sampling effect,while the axial interval has the weakest influence.
4.3 Sampling performance of STDI
The numerical simulation and parametric analysis in Section 4.2 verify that the existence of the depressions can not only reduce the adhesion and frictional drag of the soil,but also increase the penetration depth and sample length.Therefore,this section mainly focuses on analyzing the sampling performance of STDI.
4.3.1 Comparison of STDI,STDO,and NST
4.3.1.1 Penetration depth,sample length,maximum velocity,and sampling rate
The comparison of the sampling ability and effect for NST,STDO,and STDI is listed in Table 3.First,it is shown that the existence of the depression,whether on the outer or inner surface,can improve the sampling ability and effect of the sampler tube,including the penetration depth,the sample length,and the maximum penetration velocity.Secondly,the penetration depth ofSTDO can be significantly increased,thereby increasing the sample length,but the sampling rate is decreased.As for STDI,the sample length can be directly increased,and the sampling rate can be improved at the same time.
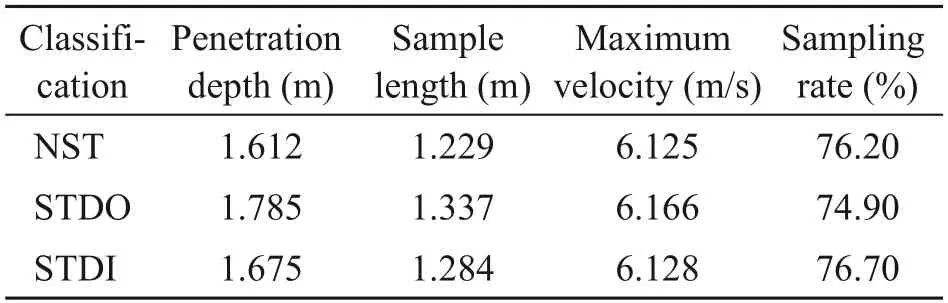
Table 3 Comparison of the sampling performance of STDI,STDO,and NST
4.3.1.2 Frictional drag
Fig.6a shows the frictional drag on the inner wall.The frictional drags of STDO and STDI are both smaller than that of NST,indicating that the disturbance of the soil sample is reduced.However,when STDO and STDI approach the deepest penetration depth (0.96-1.36 m),the frictional drags oscillate and increase.One possible reason is that the soil sample gradually enters the depression due to the decrease of the penetration velocity,resulting in an increase in the contact area of soil and tube and,finally,the drag reduction effect of the STDO and STDI is weakened.As for STDI and STDO,as the penetration depth of the sampler tube and the contact area between tube wall and soil increase,the frictional drag also increases accordingly.The frictional drag on the inner wall of the NST reaches its maximum when NST reaches the maximum penetration depth.However,since there are no depressions and swellings on the NST,the frictional drag will not oscillate when it reaches the maximum penetration depth.
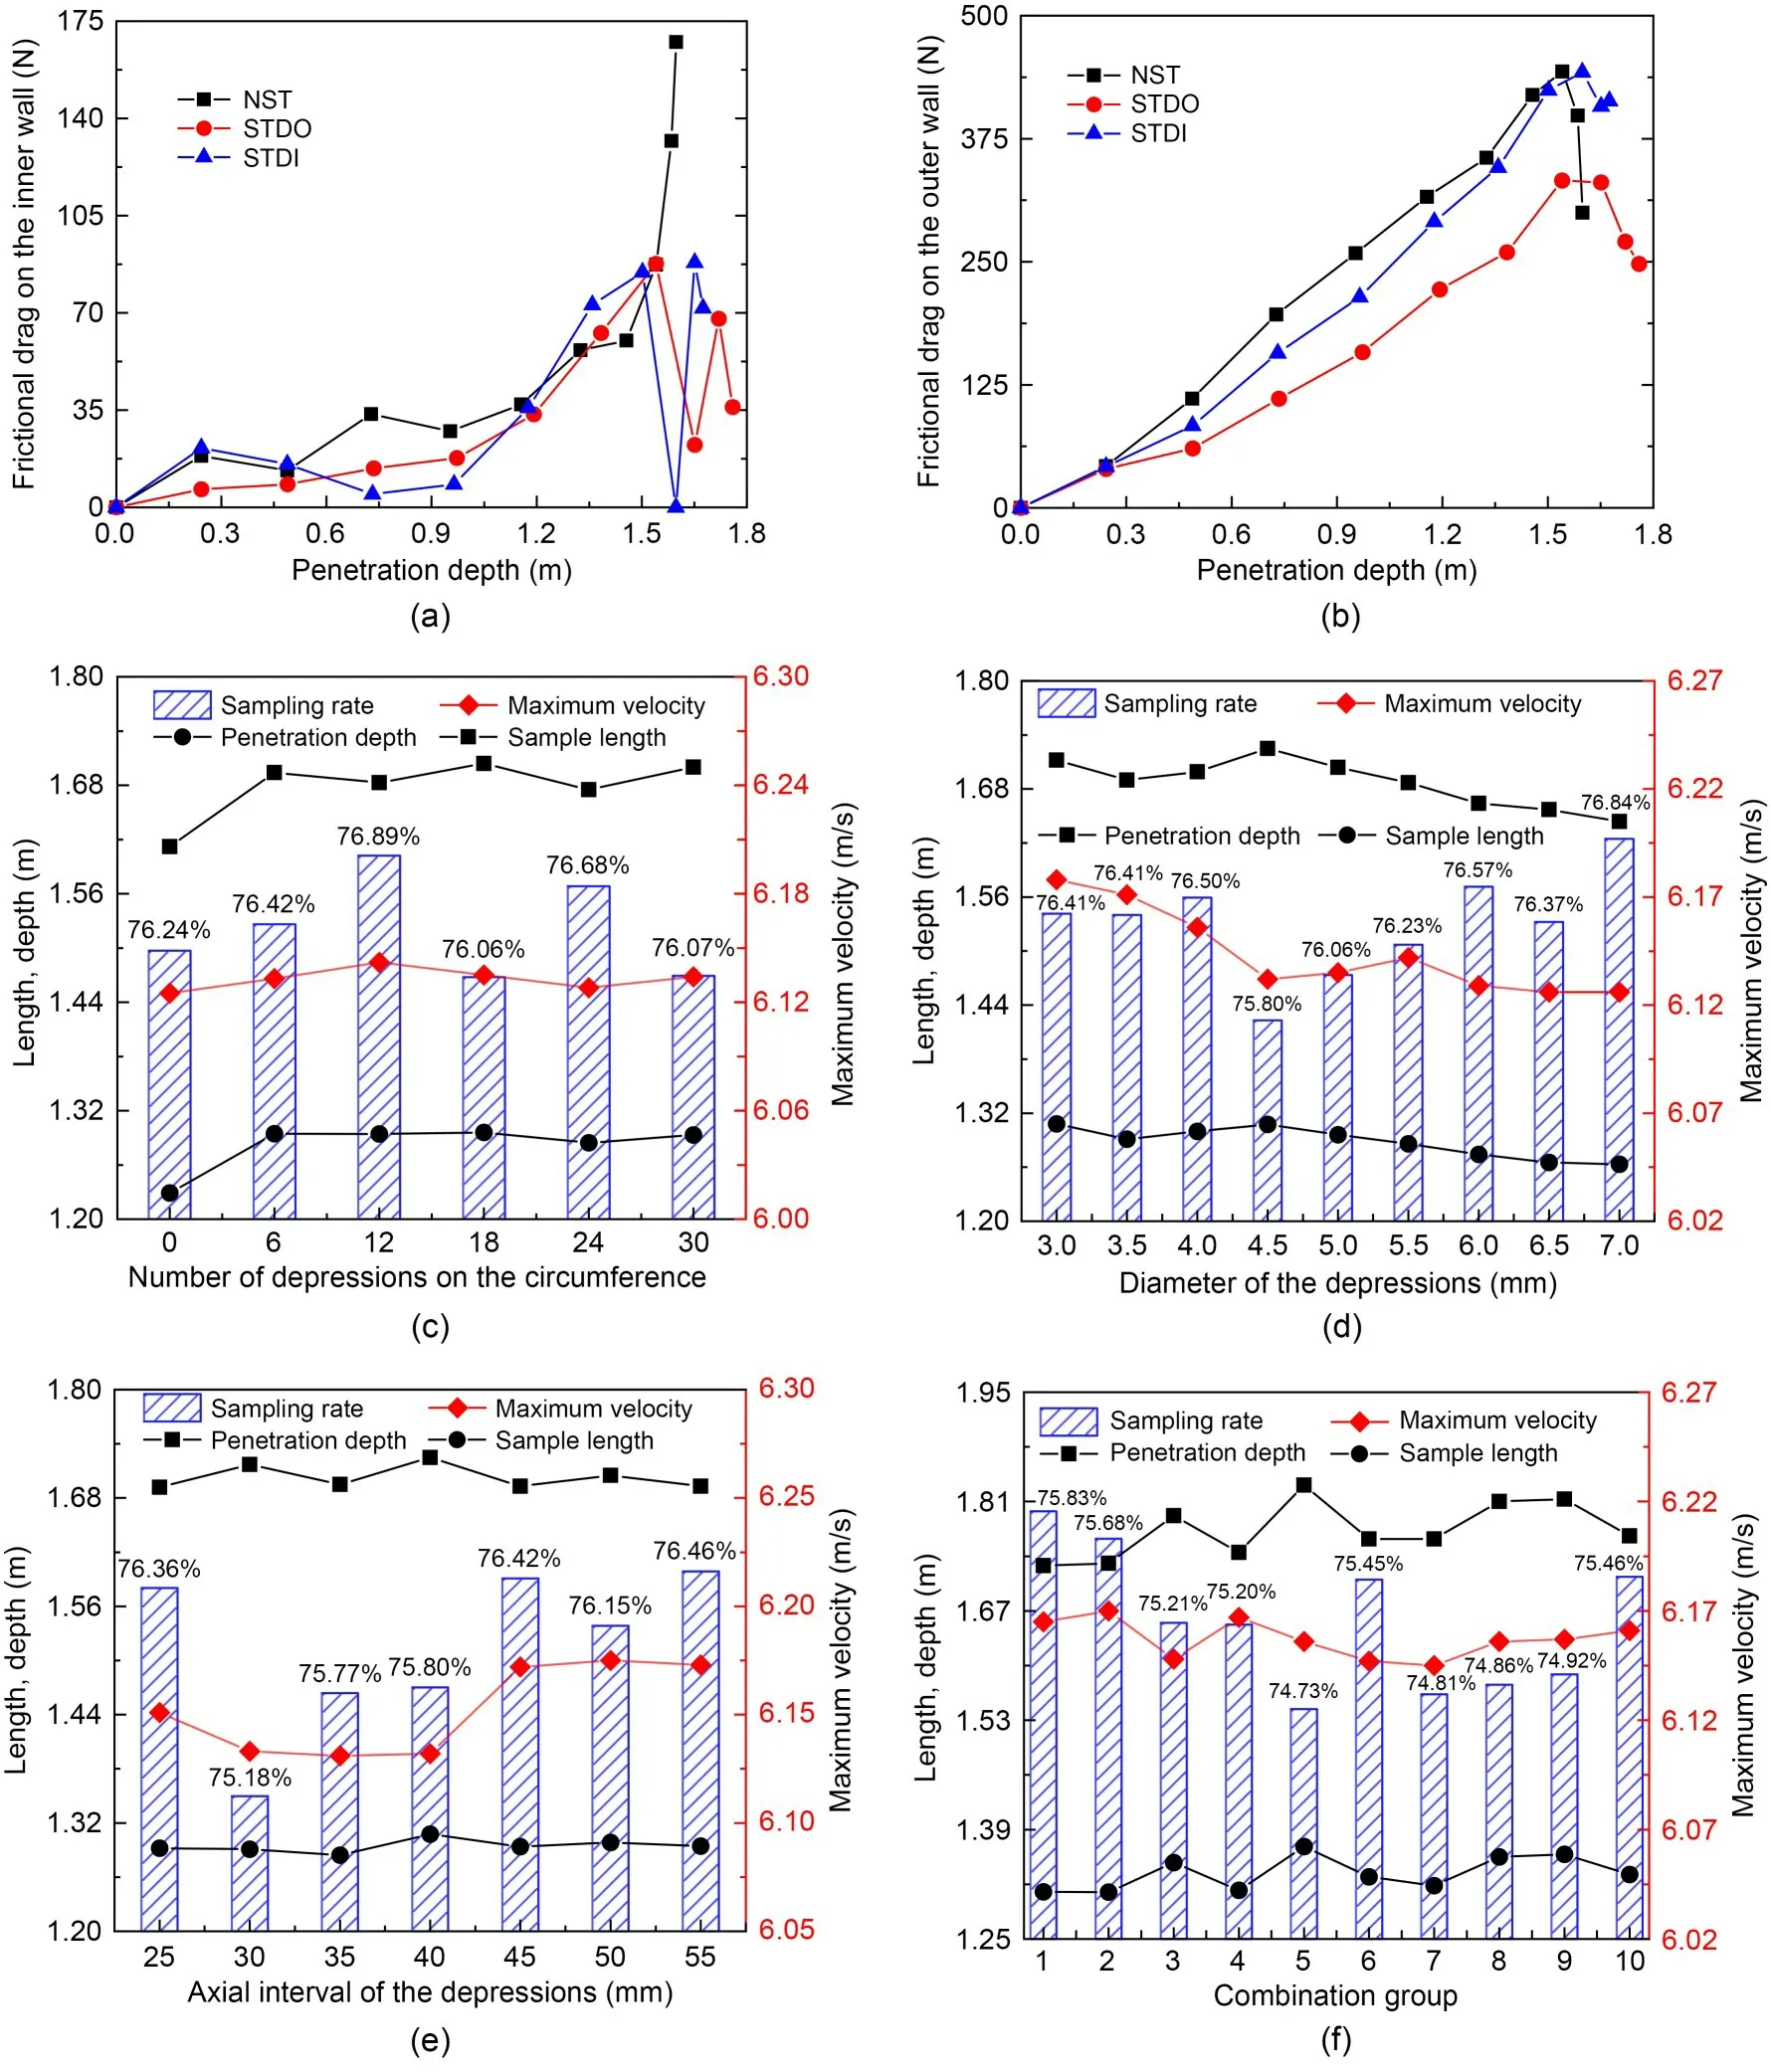
Fig.6 Sampling performance of STDI: (a) frictional drag on the inner wall; (b) frictional drag on the outer wall; (c)number of depressions on the circumference; (d) diameter of the depressions; (e) axial interval of the depressions; (f)combination group
Fig.6b shows the frictional drag on the outer wall.The frictional drag of the sampler tube will decrease before reaching the final penetration depth.The STDI has little effect on the drag in the outer wall,while the STDO can significantly reduce that drag by as much as 20%.The frictional drag on the outer wall of NST is similar to those of STDO and STDI,and also decreases before reaching the final penetration depth.
Comparing the wall frictional drag of three types of sampler tube during penetration,the frictional drag on the outer wall of the NST is the largest before reaching the final penetration depth.The order of frictional drag of the outer wall is: NST>STDI>STDO.
4.3.2 Parameter analysis of the characteristics of the depressions on the inner surface
4.3.2.1 Circumferential distribution
The diameter and axial interval of the depressions are 5 and 40 mm,respectively,and the number of depressions in the circumferential direction changes from 6 to 30 with a changing interval of 6.The result is shown in Fig.6c,where the number of depressions in the circumferential direction is 18,and the penetration depth and sample length reach the maximum values of 1.704 and 1.296 m,which improve by 5.7% and 5.5% respectively compared with the NST.When the number of depressions in the circumferential direction is 12,the penetration velocity and sampling rate reach the maximum values of 6.142 m/s and 76.89%.Since the penetration depth and sample length are two important indicators for evaluating the effect of the sampler tube,the number of the depression is set to 18 in the subsequent analysis.
4.3.2.2 Diameter
The axial interval is 40 mm and the number of depressions in the circumferential direction is 18,and the diameter of the depressions changes from 3.0 to 7.0 mm with a changing interval of 0.5 mm.The result is shown in Fig.6d.When the diameter of the depressions is 4.5 mm,the penetration depth and sample length reach the maximum values of 1.725 and 1.308 m,respectively,which are improvements of 7.0% and 6.4% compared with the NST.When the diameter of the depression is 3.0 mm,the penetration velocity reaches the maximum value of 6.178 m/s.
The influence of the diameter of the depressions on the sampler tube differs between STDO and STDI.With the increase of the diameter of the depressions,the penetration depth and sample length of the STDO gradually increase and remain stable,while the STDI gradually decreases.In addition,the change in the diameter of the depressions causes a smaller change in the penetration depth and sample length of the STDI,and the improvement of the sampling effect of the STDI is also smaller.Since the penetration depth and sample length reach their maximum value when the diameter is 4.5 mm,the diameter of the depressions is set to 4.5 mm in the subsequent analysis.
4.3.2.3 Axial interval
The diameter of the depressions is 4.5 mm and the number of depressions in the circumferential direction is 18,and the axial interval of the depression changes from 25 to 55 mm with a changing interval of 5 mm.The result is shown in Fig.6e.When the axial interval of the depression is 40 mm,the penetration depth and sample length reach the maximum values of 1.725 and 1.308 m,respectively,which are improvements of 7.0% and 6.4% compared with the NST.When the axial interval of the depression is 50 mm,the penetration velocity reaches the maximum value of 6.175 m/s,and the sampling rate reaches the maximum value of 76.46% when the axial interval is 55 mm.
4.3.2.4 Summary
The comparison results of the parametric analysis of the STDI are shown in Fig.6.The maximum penetration depth and maximum sample length are increased by 10.70% and 10.65%,indicating that the STDI can also improve the sampling performance but the improvement effect is weaker than that of STDO.Among the three parameters,the diameter of the depression has the greatest impact on the sampling effect,while the circumferential distribution has the least impact,which is consistent with the conclusions obtained from the STDO.
4.3.3 Sampling performance of the combined BST
Combining the optimal solutions of the parameters obtained in Sections 4.2.3 and 4.3.2 and considering the height difference of the depressions on the inner and outer walls (hereinafter referred to as height difference),a combined BST is designed.There are 10 groups of the combined bionic tubes,whered1,d2,n,Δd,and Δhrespectively represent the diameters of the depression on the outer and inner walls,the number of depressions on the circumference,the axial interval,and the height difference.These are listed in Table 4.
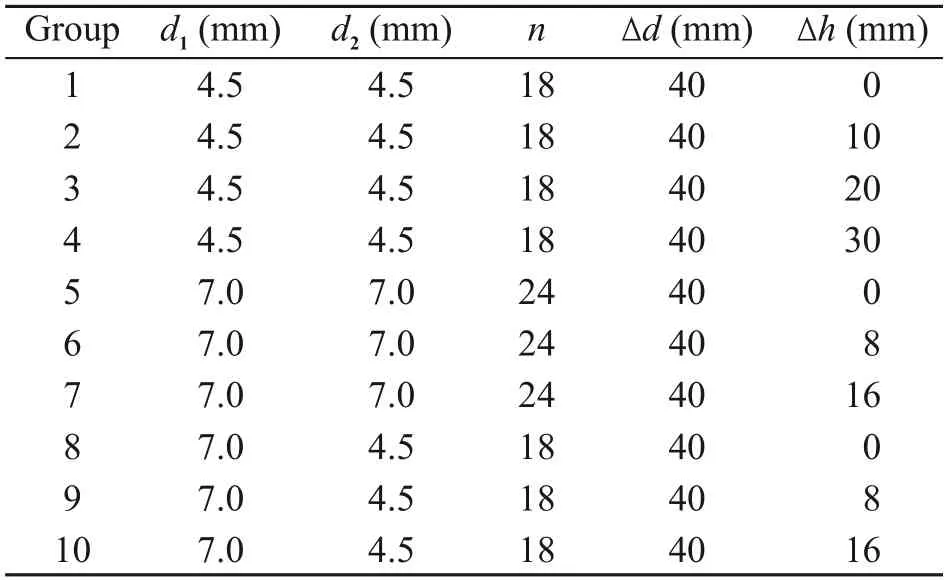
Table 4 Specifications of each combined BST
Fig.6f shows the simulation results of 10 groups.In groups 1-4,the penetration depth and sample length reach the maximum values of 1.729 and 1.348 m when the height difference is 20 mm,and in groups 5-7,the penetration depth and sample length reach the maximum values of 1.831 and 1.368 m when the height difference is zero,while in groups 8-10,the penetration depth and sample length reach their maximum values of 1.831 and 1.358 m when the height difference is 8 mm.Therefore,for different combinations of the diameters of the depressions,the influence of the height difference on the sampling effect of the tube is different.Group 5 performed the best in terms of sampling effect,with the deepest penetration depth and largest sample length,indicating that 7.0 mm is better than 4.5 mm for the diameter of the depressions on the outer wall.
4.4 Section summary
(1) A parameter analysis (i.e.,the inclination angle of the knife edge,wall thickness,and ratio of length and diameter) that affects the sampling performance of the sampler tube is carried out.The results show that the wall thickness has the greatest influence on the sampling performance compared with the inclination angle of the knife and the ratio of length and diameter.The optimal parameter combination is obtained,when the inclination angle is 30°,the wall thickness is 7 mm,and the length to diameter ratio is 17.(2) The BSTs and NST are designed and simulated,and their sampling performances are compared.The results verify that BSTs can reduce soil adhesion and drag and increase the penetration depth and sample length.(3) The influence of the size and distribution characteristics of the depressions and swellings on the outer surface on sampling performance is analyzed,and the results show that depressions are better than swellings in improving penetration depth and sample length.(4) The STDI is designed and simulated.It is shown that it can also improve the sampling performance of the sampler tube.Parametric analysis of the characteristics of the depressions and the sampling performance of the combined BST is conducted.
5 Experiment and results
5.1 Laboratory penetrating tests
5.1.1 Experimental setup
The experimental setup is schematically illustrated in Fig.7a.It consisted of a 3.5-m height experiment platform,a linear guide rail,a lead screw,a servo motor,a motor controller,a force sensor (HYLE-010,HYchuangan Co.,Ltd.,China),a plastic cylindrical soil tank,the model sampler tube,and the data acquisition and control system.The diameter and depth of the soil were 800 and 900 mm,respectively.The servo motor was installed on the top of the lead screw and could drive the lead screw along the guide trail at a specific velocity.A force sensor was placed between the model sampler tube and the lead screw to record the penetration drag.
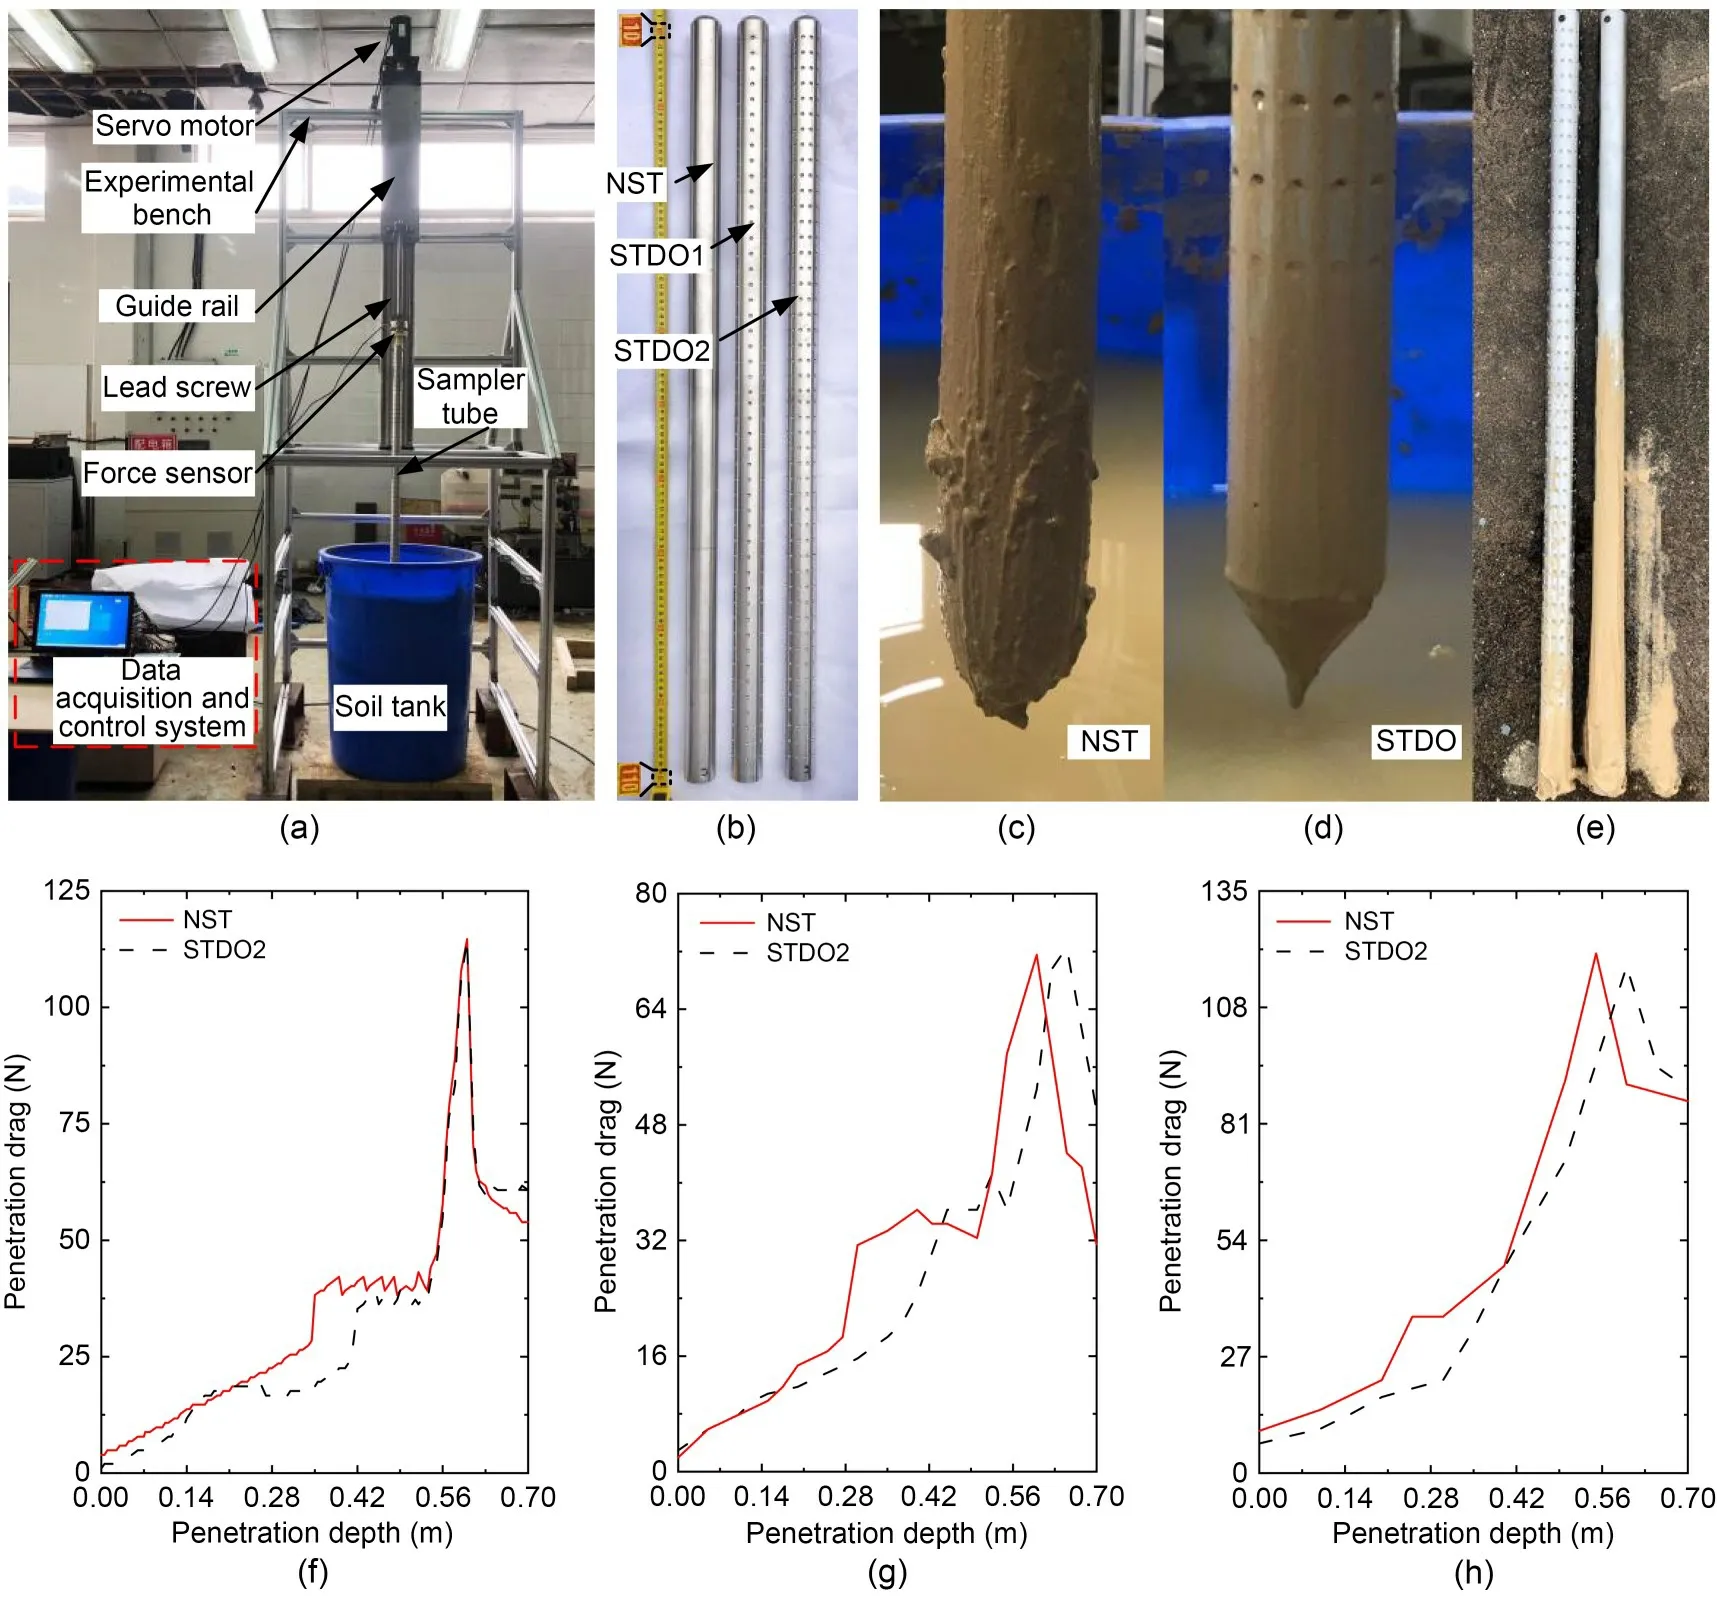
Fig.7 Layout of the experiment setup and penetrating test results: (a) global view of the test platform; (b) model NST and STDO; (c-e) adhesion of soil on the sampler tube; (f-h) penetrating results when the velocity is 0.01,0.05,and 0.10 m/s.STDO1 and STDO2 represent the STDOs with 6 and 12 depressions on the circumference,respectively
5.1.2 Model sampler tube and soil preparation
The model sampler tubes are shown in Fig.7b,and the specifications of the model tube are listed in Table 5.

Table 5 Specifications of the model NST and STDOs used in tests
A combination of bentonite and fine silica sand was used to model the simulated soil through analysis of the physical properties and field sampling data of seabed sediment (Zhang et al.,2015; Chen et al.,2016).The weight proportions were 65% and 35%,respectively.The soil preparation followed (Wang,2016),and the soil characteristics are listed in Table 6.Each test was repeated three times in order to eliminate the single measurement errors and,after each test,the soil was stirred with a cement vibrator and allowed to settle for 2 d to ensure that the soil was fully reconsolidated.The averaged drag was regarded as the final penetration drag.
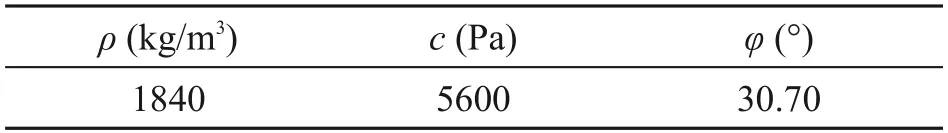
Table 6 Characteristics of the soil used in tests
5.1.3 Test results and analysis
To test the drag reduction effect of the STDO when penetrating the seabed soil,the laboratory test platform was designed,and the sampler tube and simulated seabed soil were prepared,as shown in Figs.7a-7e.The penetration tests of the BST and NST were carried out at a constant velocity,and the penetration drag was recorded in real time by the force sensor.However,due to the limitations of the test platform,the penetration velocity and depth are smaller than those set in the numerical simulation and are 0.01-0.10 m/s and 0.7 m,respectively.
The results of the tests are shown in Figs.7f-7h.Three levels of penetration velocity were tested: 0.01,0.05,and 0.10 m/s.The penetration drag first increases as the penetration depth increases,and then decreases after reaching a maximum value,the changing trend of which is consistent with the numerical results in Section 4.Since the penetration velocity is small,the penetration drags of the STDO and the NST are almost the same but,before the peak of the drag is reached,the penetration drag of the STDO is smaller than that of the NST.
In addition,when the sampler tube was pulled out of the soil tank at the same velocity as in the penetration stage,the experimental effect of reducing soil adhesion and scouring soil of the STDO is significantly better than that of NST,as shown in Figs.7c-7e.The surface of the NST was covered with a thick layer of soil,while the soil on the STDO is discontinuous,and only a small amount of soil existed between the depressions (Ren et al.,2002).The length and thickness of the soil covering the surface of the BST are smaller than those of the NST,indicating that the design of the STDO can reduce the frictional drag,adhesion,and disturbance of the soil,and improve the sampling ability and effect.
5.2 Sampling tests
5.2.1 Tidal flat sampling tests
As shown in Fig.8a,a field sampling experiment was conducted in a tidal flat at Huimin Bridge Pier of Zhejiang University,China.In Figs.8b and 8c,polyvinyl chloride (PVC) pipes were used to ensure that the penetration direction is vertical and the changes in the initial penetration velocity of the sampler tube were 1-7 m/s.The penetration depth and sampler length were measured and the results are shown in Figs.8d-8f.
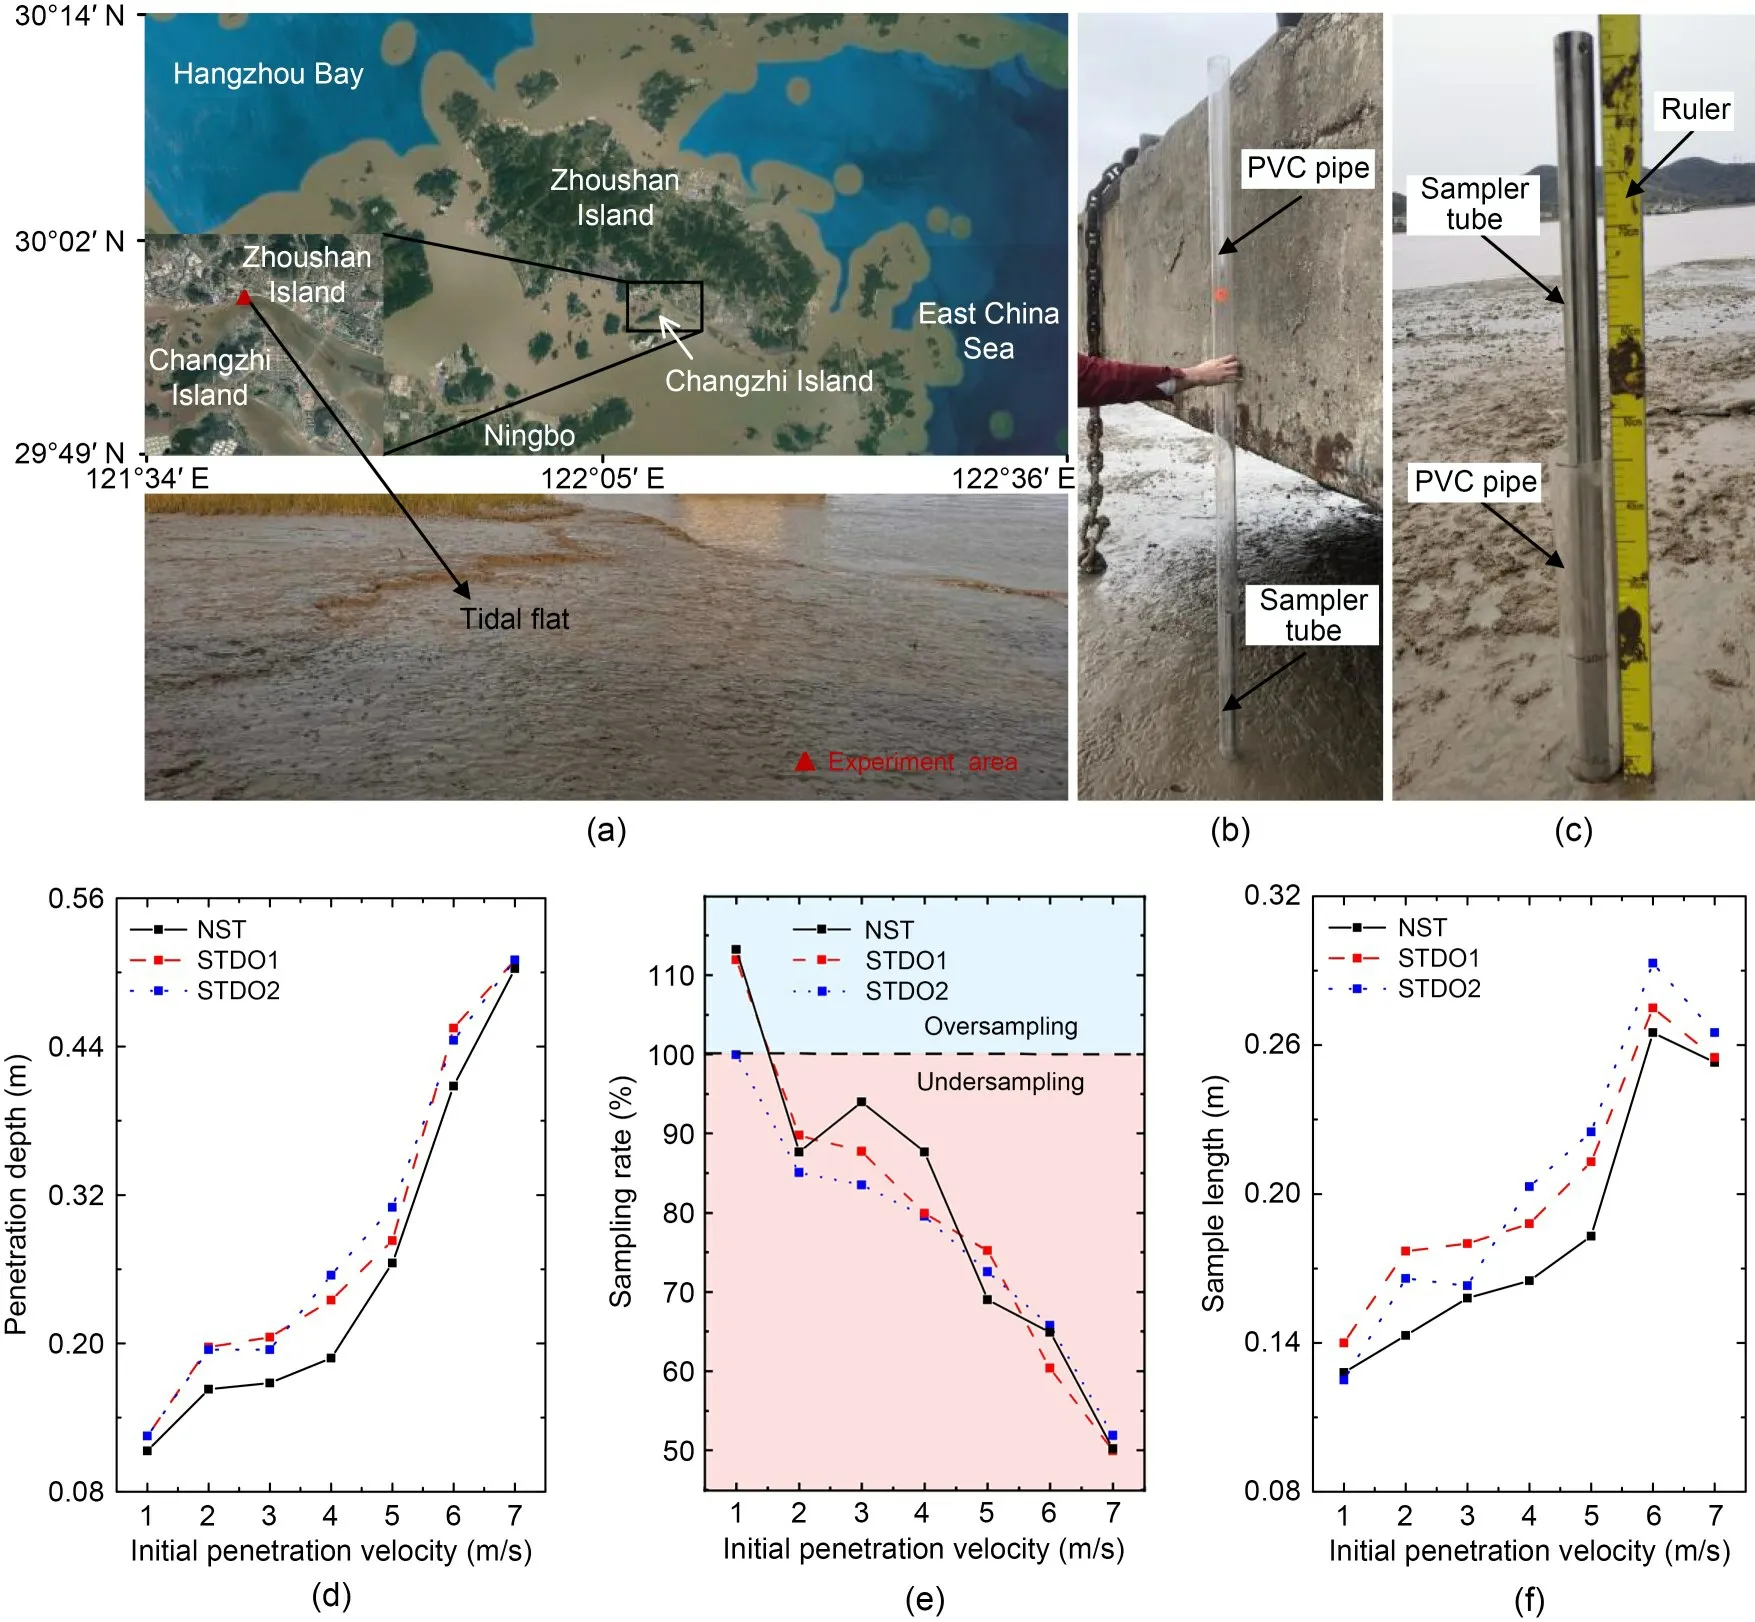
Fig.8 Tidal flat sampling tests and results: (a) experimental area; (b) sampler tube pass through the PVC pipe; (c)penetration depth measured by a ruler; (d-e) penetration depth,sampling rate,and sample length of the NST and STDOs
As shown in Figs.8d-8f,with the increase of the initial velocity,the penetration depth of the sampler tubes gradually increases,while the sample length first increases and then decreases.The sampler length reaches a maximum value when the penetration velocity is 6 m/s.The sampling rate shows a gradually decreasing trend,which even exceeds 100% when the penetration velocity is 1 m/s.
At the same initial penetration velocity,compared with the NST,the final penetration depth and sample length of the STDO are better.In particular,when the initial velocity is 4 m/s,the penetration depths of the two BSTs increased by 25.0% and 35.6%,and the sample lengths increased by 13.9% and 23.0%,respectively.Also,when the initial penetration velocity is 6 m/s,which is the same as in the numerical simulation,the penetration depths of the STDOs increased by 11.5% and 9.1%,and the sample lengths increased by 3.8% and 10.6%,respectively.The field test results validate the results in the numerical simulation.The STDO effectively promotes gravity coring,which is conductive to rapid and low-disturbance sampling of soil sediments.
In addition,the effect of the different STDOs on gravity coring was different in the field experiment.Also,for STDOs with different penetration velocities,the interaction between the soil and the depressions is also different.Generally,the faster the penetration velocity of the tube,the more obvious the reduction of soil adhesion and scouring soil but,as the penetration depth deepens,the density and viscosity of the soil increase and the drag reduction effect gradually weakens.The results of the field tests and the numerical simulation support each other,which not only verifies that the STDO can improve the penetration depth and sampler length of gravity coring,but also supplements the analysis of the sampling effect for a single initial penetration velocity in the numerical simulation.
5.2.2 Laboratory sampling tests
The test process and method of the laboratory tests are the same as the field tests.The initial penetration velocity of the sampler tube is 1-6 m/s.Fig.9 shows the test results.The penetration depth and sample length increase with the increase of the initial penetration velocity.In particular,when the penetration velocity exceeds 3 m/s,the penetration and sample length of the STDO are significantly greater than those of the NST,indicating that the greater the penetration velocity,the more obvious the improvement of the sampling performance of the STDO.Since the simulated soil in the laboratory test is closer to the seabed sediment,the penetration depth and sample length in the laboratory tests are greater than those in the field tests (as shown in Figs.8 and 9).In the numerical simulation,the length of the sampler tube is greater and the soil is softer,so the penetration depth and the sample length are larger than those in the laboratory.However,the sampling rates are close to each other.In the numerical simulation,the sampling rates of NST,STDO1,and STDO2 are 76.24%,75.73%,and 75.00% respectively,while in the laboratory test,they are 73.06%,73.02%,and 72.59%,respectively.
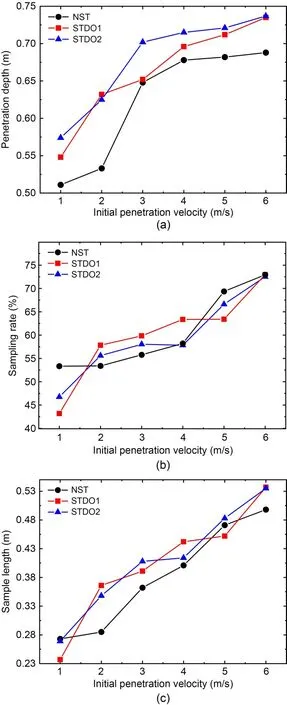
Fig.9 Laboratory penetration test results of the NST and STDOs at different initial penetration velocity: (a)penetration depth; (b) sampling rate; (c) sample length
6 Conclusions
In this study,a new bionic gravity sampler tube is presented.Sufficient comparison and analysis of the sampling performance was carried out through theoretical,numerical,and experimental studies.Firstly,the disturbance and frictional drag of the soil during the sampling process were studied based on a spherical cavity expansion model and the Mohr-Coulomb yield criterion.Then,based on ABAQUS software,the finite element model of a gravity sampler tube was established and the CEL method was carried out to analyze and compare the sampling ability of the NST and BST.A series of indoor and field tests was conducted to validate the sampling performance of the BST.The numerical and experimental results demonstrate the advantages of the proposed BST in the reduction of soil adhesion and drag.The main results of this study are as follows:
(1) The reaming pressure and frictional drag of the sampler tube were calculated,and demonstrated the feasibility of the theoretical and numerical calculation models.In the simulation calculation,the ultimate reaming pressures on the outer and inner walls were 20.6 and 18.4 kPa,respectively,and the frictional drags on the inner and outer walls were 334.94 and 581.59 N,respectively.In theoretical calculation,the ultimate reaming pressure was 22.1 kPa,and the frictional drags on the inner and outer walls were 525.01 and 685.80 N,respectively.
(2) For the NST,parameter analyses of the inclination angle of the knife edge,wall thickness,and ratio of length and diameter were carried out.The penetration depth,sample length,and sampling rate all increased as the inclination angle increased and reached their maximum values at 45° of 1.641 m,1.259 m,and 76.73%,respectively.The penetration depth and sample length decreased as the wall thickness increased and reached their maximum values at 7.0 mm,of 2.28 and 1.54 m,respectively.The NST has the best sampling performance with an inclination angle of 30°,a wall thickness of 7.0 mm,and the ratio of length and diameter of 17.
(3) The STDO and STSO were designed according to the non-smooth surface of the dung beetle,and the numerical results show that the sampling performances of the STDO were better than that of the STSO.The maximum penetration velocity,penetration depth,and sample length of STDO and STSO are 6.166 and 6.106 m/s,1.785 and 1.528 m,1.337 and 1.147 m,respectively.The maximum frictional drag on the inner wall of STDO is smaller than that of STSO,and they are 87.67 and 114.96 N,respectively.
(4) For STDO,the parameter analyses of the diameter,axial interval,and numbers on the circumference were carried out.The penetration depth and sample length increased as the inclination angle increased and also increased as the axial interval decreased.Among three parameters,the diameter of the depressions has the greatest influence on sampling,and the penetration depth and sample length increased by 14.8% and 11.4%,respectively.The STDO has the best sampling performance when the depression diameter is 7.0 mm,the number of depressions on the circumference is 24,and the axial interval is 40 mm.
(5) The STDI was designed and simulated.The numerical results show that the sampling performance of STDO is better than that of STDI.The penetration depth and sample length of STDI and STDO are 1.675 and 1.785 m,1.284 and 1.337 m,respectively.The maximum frictional drags on the inner walls of STDI and STDO are similar,but the maximum frictional drag on the outer wall of STDI is larger than that of STDO,which are 442.58 and 332.63 N,respectively.
(6) Considering the best sampling performance of STDO and STDI,the BSTs with depressions on both inner and outer surfaces were designed and simulated,and simulation results show that group 5 has the best sampling performance,in which the maximum penetration depth and sample length are 1.831 and 1.368 m,respectively.
(7) The NST and the STDOs were designed and manufactured.Laboratory penetration and field gravity tests were carried out,which verified the feasibility of the bionic non-smooth surface design and demonstrated that the bionic non-smooth surface can reduce adhesion and drag during sampling.That is important for realizing low-disturbance and fast gravity sampling of seabed sediment.
Acknowledgments
This work is supported by the Finance Science and Technology Project of Hainan Province (No.ZDKJ202019) and the National Natural Science Foundation of China (No.41976055).
Author contributions
Yongqiang GE,Jiamin HE,Peihao ZHANG,and Ziqiang REN designed the research.Yongqiang GE,Jiamin HE,Jin GUO,Hao WANG,and Xiaoling LE processed the corresponding data.Yongqiang GE and Jiamin HE wrote the first draft of the manuscript.Ying WANG and Yuhong WANG helped to organize the manuscript.Yongqiang GE and Jiawang CHEN revised and edited the final version.
Conflict of interest
Yongqiang GE,Jiamin HE,Jin GUO,Peihao ZHANG,Hao WANG,Ziqiang REN,Xiaoling LE,Ying WANG,Yuhong WANG,and Jiawang CHEN declare that they have no conflict of interest.
Electronic supplementary materials
Sections S1-S3
 Journal of Zhejiang University-Science A(Applied Physics & Engineering)2023年8期
- Journal of Zhejiang University-Science A(Applied Physics & Engineering)的其它文章
- Effects of potassium channel blockage on inverse stochastic resonance in Hodgkin-Huxley neural systems
- Vibration suppression of composite panel with variable angle tow design and inerter-based nonlinear energy sink
- Numerical study of wheel-rail adhesion performance of new-concept high-speed trains with aerodynamic wings
- Co3O4-ZnO/rGO catalyst preparation and rhodamine B degradation by sulfate radical photocatalysis
- Determination of the dynamic characteristics of locomotive drive systems under re-adhesion conditions using wheel slip controller