
CK2 α causes stemness and chemotherapy resistance in liver cancer through the Hedgehog signaling pathway
2023-08-02 09:00:44DiWuYuanQinYinYanLiLingZhangYouHongJiangZheWang
Di Wu , Yuan-Qin Yin , Yan Li , Ling Zhang , You-Hong Jiang , Zhe Wang
a Department of Tumor Biotherapy and Cancer Research, the First Affiliated Hospital of China Medical University, Shenyang 110 0 01, China
b Department of Pathology, Shengjing Hospital of China Medical University, Shenyang 110 0 04, China
Keywords:CK2 α Liver cancer Hedgehog signaling pathway Stemness Chemotherapy resistance
ABSTRACT Background: Liver cancer is one of the major causes of cancer-related deaths globally.Cancer cell stemness and chemotherapy resistance contribute to the high mortality.Although evidence indicates that the alpha subunit of protein kinase 2 (CK2α ) is involved in several human cancers, its function in liver cancer remains unknown.In the present study, we aimed to elucidate the role of CK2α in liver cancer.Methods: We examined the role of CK2α regulation in stemness and chemotherapy resistance capacity of liver cancer cells.MTT assays, tumor sphere formation assays, RT-PCR, flow cytometry, Western blotting assay, clonogenicity assay, matrigel invasion assay and bioinformatics were conducted in this study.Results: CK2α expression in the liver cancer tissues was notably upregulated compared with that in the corresponding non-tumorous tissues.The overexpression of CK2α promoted tumor sphere formation,increased the percentage of CD133( + ) and side population cells, caused the resistance of liver cancer cells to 5-FU treatment, increased the expression levels of NANOG, OCT4, SOX2, Gli1 and Ptch1, and enhanced the ability of CD133( + ) cell clone formation and invasion.Consistently, the downregulation of CK2α had the opposite effects.CK2α silencing inhibited the Hedgehog pathway by reducing the expression of Gli1 and Ptch1.Mechanistically, CK2α regulation on liver cancer cell stemness and chemotherapy resistance was found to be involved in the Hedgehog signaling pathway.Conclusions: Our study may bring some new insights into the occurrence of liver cancer.Furthermore,these findings suggest that targeting CK2 α may be a novel therapeutic strategy for patients with liver cancer.
Introduction
Liver cancer is one of the most common fatal tumors worldwide [1-3].Although great strides have been achieved in treating liver cancer, the overall survival is still unsatisfactory.An increase in stem cell-like properties in liver cancer and chemotherapy resistance partially lead to the high number of tumor-related deaths [4-6].To improve the quality of life and prolong the life span of patients with liver cancer, it is urgent to find more effective treatments.
The abnormal expression of some key cancer-related genes is involved in the pathogenesis and development of human tumors [7-9].Protein kinase 2 alpha (CK2α), the catalytic alpha subunit of protein kinase CK2, plays an essential role in cell proliferation, differentiation and tumorigenesis [10-12].CK2αis involved in the occurrence of many human neoplasms, such as gastric carcinoma [13], penile squamous cell carcinoma [14], breast cancer [15],thyroid cancer [16], bladder cancer [17]and liver cancer [18].In our previous study, we found CK2αhas the effect on migration and invasion of liver cancer cellsinvitro, which is related with MMPs,EMT process and Hedgehog signaling pathway [19].However, the exact role of CK2αin liver cancer remains unknown.
In the present study, we aimed to elucidate the function of CK2αin liver cancer.Our results may have important clinical implications in the treatment of this disease.
Materials and methods
Patients and tissue samples
Tumor and paracancer tissues of liver cancer were obtained from 150 diagnosed patients who received surgical resection without radiotherapy or immunotherapy at the First Affiliated Hospital of China Medical University.Tissue samples were snap frozen in liquid nitrogen immediately after resection and stored at -80 °C.The use of samples was approved by the Ethics Committee of the First Affiliated Hospital of China Medical University (2016-124), and this study was performed according to theDeclarationofHelsinki.Informed consent was obtained from each participant.
Cell culture
Li-7 and HepG2 cell lines were purchased from the Cell Bank of the Chinese Academy of Sciences (Shanghai, China).Dulbecco’s modified Eagle’s medium (DMEM; HyClone, Logan, UT, USA) supplemented with 10% foetal bovine serum (FBS; HyClone) was used to culture cells at 37 °C in an incubator with 5% CO 2.
Cell transfection
In accordance with the manufacturer’s instructions, Lipofectamine 20 0 0 (Invitrogen, Carlsbad, CA, USA) was used for cell transfection.Specific small interfering RNAs (siRNAs) targeting CK2αand CK2αexpression vectors were obtained from Shanghai Sangon Biotechnology (Shanghai, China).After incubating for 24 h,the cells were collected for further research.All experiments were conducted in triplicate.
Quantitative reverse-transcription polymerase chain reaction(qRT-PCR)
Total RNA was extracted from cultured cells or tissues using the TRIzol reagent following the manufacturer’s instructions (Invitrogen).RNA was reverse transcribed to complementary DNA from 1μg of total RNA in a final volume of 20μL oligo dT using the Reverse Transcription Kit (Thermo Fisher, Waltham, MA, USA).Quantitative analysis was conducted using a SYBR Green qPCR mix(TaKaRa, Dalian, China) following a standard protocol.The primers used in this study were synthesised by Shanghai Sangon Biotechnology, China.β-actin was used as the endogenous control.The 2-△△Ctmethod was used to calculate the relative expression level of the PCR targets.All experiments were conducted in triplicate.
Western blotting
Cells were lysed in RIPA buffer (Shanghai Sangon Biotechnology) containing a protease inhibitor cocktail and phenylmethylsulfonyl fluoride.Total protein concentration was determined using a BCA Kit (TaKaRa, Dalian, China).Sodium dodecyl sulfatepolyacrylamide gel (10%) electrophoresis was used to separate the proteins.Then, the proteins were transferred onto polyvinylidene difluoride membranes (TaKaRa).Antibodies (1:10 0 0) against CD133, NANOG, OCT4, SOX2, Gli1 and Ptch1 were purchased from Abcam (Cambridge, MA, USA) and CK2αwas bought from Santa Cruz Biotechnology (Santa Cruz, CA, USA).β-actin or GAPDH were used as controls (Santa Cruz).An ECL Detection Kit (TaKaRa) was used to develop the blots.All experiments were repeated three times.
Tumor sphere formation assay
Cells were placed into 6-well ultra-low cluster plates (Corning Inc., Corning, NY, USA) at a density of 500 cells/well and cultured for 12 days.Subsequently, the number of cell spheroids (nonadherent spherical masses of 50μm diameter) was counted under an inverse microscope (Olympus, Tokyo, Japan).Tumor spheroid formation efficacy was calculated using the following formula:spheroid forming efficiency = colonies/seeded cells × 100%.
Cell proliferation
Cell proliferation was evaluated using methyl thiazolyl terazolium (MTT) assay.In brief, cells were seeded into 96-well plate at a density of 5 × 10³cells/well.The MTT reagent (Shanghai Sangon Biotechnology) was added into each well and cells were incubated at 37 °C for 4 h.Then the optical density value was read at 570 nm using a microscope spectrophotometer (Thermo Fisher Technologies, Waltham, MA, USA).All experiments were carried out in triplicate.
Immunohistochemistry analysis
Formalin-fixed, paraffin-embedded tissue sections (5μm in thickness) were subjected to immunohistochemistry analysis.The samples were incubated with CK2αprimary antibodies (1:200, Abcam) at 4 °C overnight.After washing with phosphate buffered saline (PBS; 5 min each time, 3 times), the samples were incubated with a biotinylated secondary antibody (Abcam) for 1 h, and then with streptavidin-horseradish peroxidase for 20 min.Diaminobenzidine substrate was used as a developer.All experiments were carried out in triplicate.
The pathological changes were assessed using a staining index(value 0-12) independently by two expert pathologists blinded to the clinical data.The frequency of positive cells were determined as 0 (<5%), 1 (5%-25%), 2 (26%-50%), 3 (51%-75%), and 4 (>75%).The intensity scores were defined as follows: 0, negative; 1, weak;2, moderate; and 3, strong.The total score was calculated by multiplying the score of the positive cells by the score of the staining intensity.CK2αstaining results were classified into low expression(0-7) and high expression (8-12).
CD133( + ) cell isolation using flow cytometry
Fluorescence-activated cell sorting (BD FACSMelody, BD Bioscience, San Jose, CA, USA) was used to conduct CD133( + ) cell isolation.In brief, cells were blocked using a human Fc blocking antibody (BD Bioscience) in FACS buffer supplemented with 1% FBS and 0.02% sodium azide.After three washes with cold PBS, cells were stained with anti-CD133 antibodies conjugated with phycoerythrin in PBS and incubated for 30 min on ice.After another three washes with cold PBS, cells were analysed using flow cytometry on a BD Canto II flow cytometer, then using FACSDiva software(BD Bioscience) to analyse the data.
Side population (SP) cell analysis using flow cytometry
Cell suspensions were stained with Hoechst 33342 dye for SP analysis.In brief, cells were resuspended at a density of 1 × 10⁶cells/mL in prewarmed OptiMEM (2% FBS, Gibco, Grand Island, NY,USA), after which Hoechst 33342 dye was added to a final concentration of 5μg/mL.Then, the cells were incubated at 37 °C for 90 min with intermittent shaking.After washing with OptiMem(2% FBS, Gibco), the cells were centrifuged at 4 °C, and the pellet was suspended in ice cold OptiMem.Propidium iodide (Sigma,St.Louis, MO, USA) was added to the cells at a final concentration of 2μg/mL to gate viable cells.Before sorting, the cells were filtered using a 50μm cell strainer to obtain a single-cell suspension.A FACS system (BD Bioscience) was used to analyse and sort the data.
Clonogenicity assay
Five hundred cells were seeded in a six-well petri dish and kept growing.Twelve days later, these cells were fixed and stained with 0.5% crystal violet solution.Colonies with a diameter over 50μm were counted and five representati ve areas were recorded and photographed.
Matrigel invasion assay
Invasion of liver cancer cells was checked using matrigel-coated transwell inserts (Corning Inc.) with 8 μm pores of polycarbonate filter.The upper surface of the filter was coated with matrigel(1 mg/mL; BD Bioscience).Total 2 × 10⁴cells in 200 μL serumfree culture medium were placed into the upper chambers of the transwell inserts, and the lower chambers were filled with the complete medium.After 24 h of incubation at 37 °C, the inner surface of the upper chambers were wiped to remove the noninvasive cells.The invasive cells at the membrane were fixed with formaldehyde for 20 min, and then stained with hematoxylin for 5 min.The number of invading cells from five random areas of each well was calculated under an optical microscope (200 ×, Olympus).
Xenograft tumor model assay
Animal protocols in our study were approved by the Ethics Committee of the First Affiliated Hospital of China Medical University.A total of 16 BALB/c nude mice (5-6 weeks of age) were purchased from the Shanghai Laboratory Animal Center (Shanghai,China).CD133( + ) and CD133(-) liver cancer cells were administrated into the ventral sides of the nude mice separately.These tumor nodules in the mice were weighed after 21 d.The tumor volume was calculated using a modified ellipse volume formula:tumor volume (mm3) = length (mm) × width (mm2)/2.
Bioinformatic analysis and statistical analysis
Bioinformatic analysis containing patient data was performed using the web-based interface GEPIA, the Human Protein Atlas,TCGA and the GTEx database, and the Uniform Resource Locators are as below: Gene Expression Profiling Interactive Analysis (GEPIA), http://gepia.cancer-pku.cn/ ; The Human Protein Atlas,https://www.proteinatlas.org/ ; The Cancer Genome Atlas (TCGA),https://portal.gdc.cancer.gov/ ; Genotype-Tissue Expression (GTXx),https://www.gtexportal.org/home/index.html.
Data were presented as mean ± standard deviation (SD).SPSS 19.0 software (SPSS Inc., Chicago, IL, USA) was used to conduct statistical analysis of the experimental data, differences between two groups were analysed using the Student’st-test, and differences among three or more independent groups were estimated using one-way analysis of variance with post-hoc Dunnett’s multiple comparison.APvalue<0.05 was considered statistically significant.
Results
Expression of CK2α is markedly increased in liver cancer tissues
Expression ofCSNK2A1,the CK2αgene, is higher in liver cancer tissues compared with that of non-tumor tissues ( Fig.1 A).To confirm the role of CK2αin liver cancer, we tested the expression levels of CK2αin the liver tissues and corresponding non-tumorous tissues.The results of the qRT-PCR assays showed that the expression levels of CK2αmRNA in liver cancer tissues were significantly increased compared with those in the corresponding nontumorous tissues ( Fig.1 B).Consistently, immunohistochemistry results showed that CK2αexpression was higher in liver cancer tissues than in the corresponding non-tumorous tissues ( Fig.1 C).We sought to address the association between CK2αexpression and liver cancer pathological stage ( Fig.1 D), grade ( Fig.1 E) and overall survival ( Fig.1 F) by taking advantage of bioinformatic tools such asGEPIA ( https://gepia.cancer-pku.cn/index.html ), the Human Protein Atlas ( https://www.proteinatlas.org ), TCGA database and the GETx database.The results showed that the expression level ofCSNK2A1was positively correlated with the stage of liver cancer; the higher the expression, the later the tumor stage, the higher the grade and the poorer the prognosis.Furthermore, we found that CK2αupregulation was linked to tumor size, TNM stage, tumor differentiation and lymph node metastasis ( Table 1 ).

Fig.1.CK2 α expression is markedly increased in liver cancer tissues.A: The expression of CK2 α gene ( CSNK2A1 ) in liver cancer tissues and non-tumor tissues adjacent to cancer from TCGA and GTEx database.B: The mRNA expression levels of CK2 α in 150 pairs of liver cancer tissues and the corresponding non-tumorous tissues were determined using qRT-PCR.C: The expression of CK2 α protein in liver cancer tissues and the corresponding non-tumorous tissues was examined using immunohistochemistry.D:Differential gene expression analysis using one-way ANOVA analysis for CSNK2A1 based on different clinical pathological stage.E: Survival of different CSNK2A1 expression level and liver cancer pathological grade.F: Survival curve for the overall survival of liver cancer patients with different expression levels of CSNK2A1 using the log-rank test based on TCGA and GTEx database.*** P < 0.001.
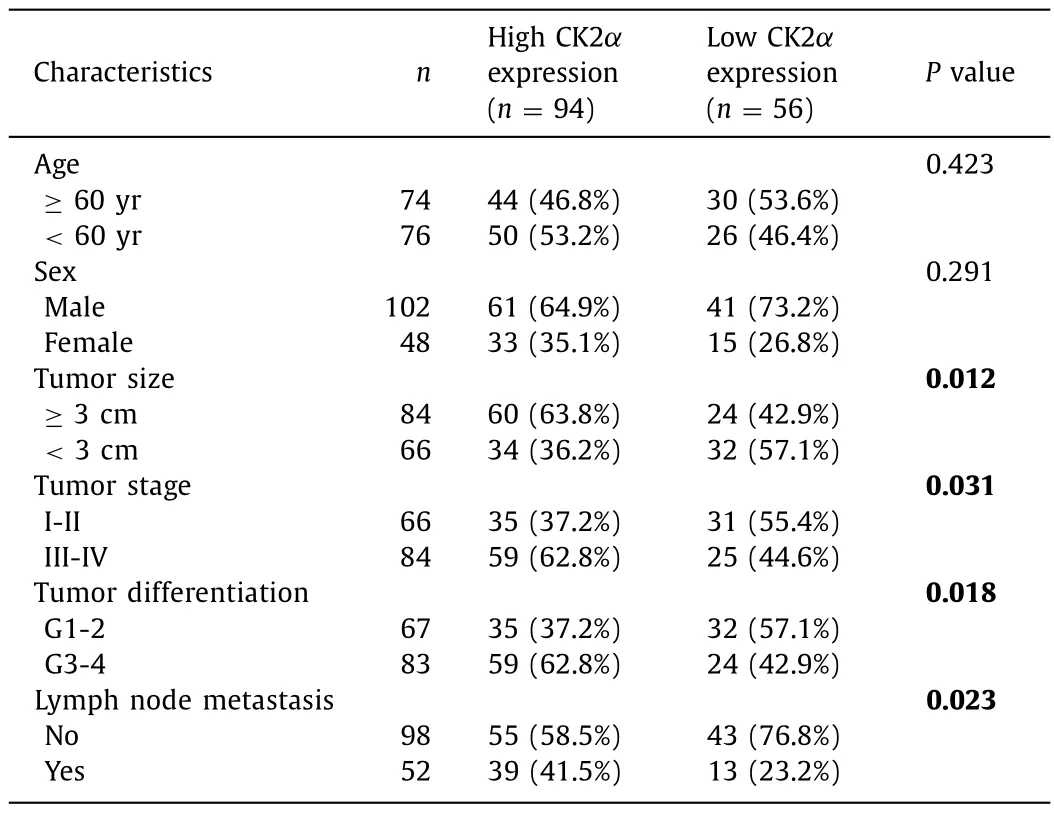
Table 1Relationship between clinicopathological parameters and CK2 α expression in patients with liver cancer.
CK2 α causes stemness and chemotherapy resistance in liver cancer cells
In a previous study [19], we found that HepG2 cells expressed the highest level of endogenous CK2α, and that Li-7 cells expressed the lowest level of four liver cancer cell lines (HepG2,SK-HEP-1, HuH-7 and Li-7) using Western blotting analysis.Here,we assessed the effects of CK2αdownregulation and upregulation on stem cell-like properties and chemotherapy resistance in liver cancer cells.Interference and overexpression efficiency were examined using Western blotting assays (F ig.2A ).CK2αinterference inhibited tumor sphere formation of HepG2 cells, while CK2αoverexpression promoted tumor sphere formation of Li-7 cells compared with control cells ( Fig.2B ).Flow cytometry analysis showed that compared with that in control cells, the downregulation of CK2αdecreased the percentage of CD133(+ ) cells, while overexpression of CK2αincreased this percentage ( Fig.2C ).Consistently,the downregulation of CK2αdecreased the percentage of SP cells,and overexpression of CK2αhad opposite effect on this percentage (F ig.2D ).Western blotting analysis revealed that CK2αinterference decreased the levels of NANOG, OCT4 and SOX2 proteins,while CK2αoverexpression increased these protein levels (F ig.2E ).The level of resistance of liver cancer cells to 5-FU treatment decreased after CK2αinterference but increased after its overexpression (F ig.2 F).These results suggest that CK2αpromotes stemness and chemotherapy resistance in liver cancer cells.

Fig.2.CK2 α promotes stemness and chemotherapy resistance in liver cancer cells.A: The expression levels of CK2 α protein were examined using Western blotting after the interference of CK2 α in HepG2 cells or overexpression of CK2 α in Li-7 cells.B: The formation of tumor spheres was observed after the interference or overexpression of CK2 α.C: The percentage of CD133( + ) cell populations was determined after the downregulation or overexpression of CK2 α.D: The percentage of side population cells was determined after the downregulation or overexpression of CK2 α.E: The expression levels of NANOG, OCT4 and SOX2 proteins were examined using Western blotting after the downregulation or overexpression of CK2 α.F: The resistance of liver cancer cells to 5-FU treatment was examined after the downregulation or overexpression of CK2 α.*** P < 0.001.
Hedgehog pathway plays a role in the effects of CK2α on liver cancer cell stemness and chemotherapy resistance
The expression levels of Gli1 and Ptch1 decreased after CK2αknockdown and increased upon its overexpression compared with those in the control group (F ig.3A ).The results of qRT-PCR(F ig.3B ) and Western blotting assays (F ig.3C ) showed that downregulation and upregulation CK2αcould interfere with the expression levels of stem cell markers (NANOG, OCT4 and SOX2), while activation or inactivation of the Hedgehog signaling pathway also changed with CK2αlevels in liver cancer cells.Activation of the Hedgehog signaling pathway increased the levels of NANOG, OCT4 and SOX2 compared with those in the interfering group.Contrary to this phenomenon, NANOG, OCT4 and SOX2 expressions were decreased when Hedgehog signaling pathway was inactivated.The results of MTT assays showed that resistance to 5-FU was induced with activation compared with inactivation of the Hedgehog signaling pathway, and CK2αcould interfere with the sensitivity of liver cancer cells to 5-FU ( Fig.3 D).Flow cytometry analysis showed that activation of the Hedgehog signaling pathway increased the percentage of CD133( + ) cells compared with that in the interfering group, and inhibition of the Hedgehog signaling pathway decreased the ratio of CD133( + ) cells compared with that in the overexpressing group ( Fig.3 E).The activation of the Hedgehog signaling pathway increased the percentage of SP cells compared with that in the interfering group ( Fig.3 F).Consistently, the inhibition of the Hedgehog signaling pathway decreased the percentage ofSP cells compared with that in the overexpressing group.Together,these results suggest that the Hedgehog signaling pathway was involved in the effect of CK2αon liver cancer cell stemness.

Fig.3.The Hedgehog pathway is involved in the effects of CK2 α on liver cancer cell stemness and chemotherapy resistance.A: The expression levels of Gli1 and Ptch1 proteins were determined using Western blotting analysis after the downregulation or overexpression of CK2 α.B: The mRNA expression levels of NANOG, OCT4 and SOX2 were determined by qRT-PCR.C: The expression levels of NANOG, OCT4, and SOX2 proteins were examined after the activation or inactivation of the Hedgehog signaling pathway.D: The viability of cells after adding 5-FU after the inactivation or activation of the Hedgehog signaling pathway was determined using the MTT assay.E: The percentage of CD133( + ) cells was determined after the activation or inactivation of the Hedgehog signaling pathway.F: The percentage of side population cells was determined after the activation or inactivation of the Hedgehog signaling pathway.* P < 0.05; *** P < 0.001.
Expression of CK2 α is markedly increased in CD133( + ) cells
We isolated CD133( + ) and CD133(-) cell populations from HepG2 cells overexpressing CK2α( Fig.4 A).The results of gel electrophoresis showed that the levels of CK2αmRNA were increased in CD133( + ) cells compared with those in CD133(-) cells ( Fig.4 B).This showed that CK2αexpression was higher in stem-like liver cancer cells.

Fig.4.CK2 α expression was markedly increased in CD133( + ) cells.A: Isolation of CD133(-) and CD133( + ) cell populations from HepG2 cells overexpressing CK2 α.B: Gel electrophoresis analysis of CK2 α mRNA expression levels in CD133(-) and CD133( + ) cell populations.
Stemness leads to chemotherapy resistance in CD133( + ) cells through the Hedgehog pathway
The expression levels of Gli1 and Ptch1 proteins were increased in CD133( + ) liver cancer cells and increased further after activation with SHH ( Fig.5 A).NANOG, OCT4 and SOX2 levels were increased in the CD133( + ) cell population compared with those in the CD133(-) cell population ( Fig.5 B).The MTT assays showed that resistance to 5-FU was higher in the CD133( + ) cell population than that in the CD133(-) cell population ( Fig.5 C).Similarly, murine xenograft model assays showed that the sensitivity to 5-FU was reduced in the CD133( + ) cell population compared with that in the CD133(-) cell population ( Fig.5 D).Interestingly, through cell clone formation ( Fig.5 E) and invasion ( Fig.5 F) assays, we found that the proliferative and invasive ability of liver cancer stem cells was enhanced after CK2αoverexpression and was further decreased after inactivation with cyclopamine.In contrast, these abilities were reduced when CK2αwas inhibited and further increased after the Hedgehog siganiling pathway was activated.From this, we inferred that CK2αcould promote the expansion and invasive ability of liver cancer stem cells and that this important role was associated with the Hedgehog signaling pathway.These results suggested that stemness lead to chemotherapy resistance in cells and that this was regulated by the Hedgehog pathway.

Fig.5.Stemness leads to chemotherapy resistance of CD133( + ) cells through the Hedgehog pathway.A: The expression levels of Gli1 and Ptch1 proteins were determined using Western blotting analysis in the CD133(-), CD133( + ) and CD133(-) SHH-activated cells.B: The levels of NANOG, OCT4 and SOX2 proteins were analysed using Western blotting in the CD133(-), CD133( + ) and Hedgehog signaling pathway activated in CD133(-) cells.C: The sensitivity of CD133( + ) and CD133(-) cells to 5-FU treatment was determined using the MTT assay.D: The sensitivity of CD133( + ) cells to 5-FU treatment was examined in the murine xenograft tumor model.E: CD133( + ) liver cancer cells with or without CK2 α and with inactivation or activation of the Hedgehog pathway were assessed in the cell clone formation assay.F: Cell invasive ability in transwells was examined in the same groups as above.* P < 0.05; *** P < 0.001.
Discussion
Although some patients with liver cancer show positive initial response to chemotherapy, the overall long-term prognosis of liver cancer is still unsatisfactory [ 20 , 21 ].Many studies have shown that the regulation of some important genes may be helpful in treating human tumors [ 19 , 22-24 ].Therefore, gene expression regulation may be an effective treatment strategy for patients with liver cancer.
CK2αis a catalytic subunit of the protein kinase CK2 that participates in the regulation of many biological processes such as cell differentiation, proliferation and apoptosis [10-12].CK2αis also involved in some certain human tumors.Zhang et al.[25]reported that inhibition of CK2αdownregulated the Hedgehog/Gli1 signaling pathway in human lung cancer cells and reduced stem-like SPs.Rabjerg et al.[26]reported that CK2αwas markedly upregulated in renal cell carcinoma tissues, correlating with a poor prognosis.However, the role of CK2αin liver cancer is still unknown.Through bioinformatics analysis tools, we found that theCSNK2A1(CK2αgene) is highly expressed in liver cancer cells, and is correlated with the tissue grade, TNM staging and survival period of liver cancer patients.We found that the expression levels of CK2αin liver cancer tissues were significantly increased compared with those in the corresponding non-tumorous tissues.Interestingly, we also found a link between CK2αupregulation and TNM stage and lymph node metastasis in patients with liver cancer.Furthermore,we found that CK2αoverexpression promoted the formation of tumor spheres, increased the percentage of CD133( + ) cells and SP cells, increased the expression levels of NANOG, OCT4 and SOX2,and increased resistance to 5-FU treatment.Consistently, we found that the downregulation of CK2αinhibited the formation of tumor spheres, decreased the ratio of CD133( + ) cells and SP cells, downregulated the expression levels of NANOG, OCT4 and SOX2, and reduced resistance to 5-FU treatment.
It has been suggested that the Hedgehog pathway is activated in more than 50% of liver cancer specimens.CK2αhas been shown to have a positive regulatory function on the Hedgehog signaling pathway in Drosophila cell lines, but it is not clear whether it affects this pathway in liver cancer.In our earlier study, we showed that knocking down the expression of CK2αcan lead to inactivation of the Hedgehog pathway in human liver cancer cell lines [19].Therefore, we studied the potential effect of CK2αon the Hedgehog signaling pathway in liver cancer cells.Our data indicated that CK2αsilencing inhibited the expression of Ptch1 and Gli1, which were the receptors and effectors of Hedgehog pathway, respectively.The Hedgehog signaling pathway performs important roles in tumorigenesis, cancer stem cell maintenance and embryogenesis [27-29].We also found that the Hedgehog signaling pathway was involved in the effect of CK2αregulation on liver cancer cell stemness and chemotherapy resistance, and increased the ability of CD133( + ) cell clonogenicity and cell invasion.These results indicated that CK2αmight participate in the tumorigenesis of human liver cancer by regulating the Hedgehog signaling pathway.
In summary, we demonstrated that CK2αwas overexpressed in liver cancer tissues compared with that in the corresponding non-tumor tissues.Moreover, our research suggested that CK2αregulated stemness and chemotherapy resistance in liver cancer through the Hedgehog signaling pathway.Thus, our study might provide some important insights into the pathogenesis and progression of liver cancer.Nonetheless, additional studies are essential for testing the diagnostic value of CK2αin liver cancer.Collectively, our data not only lead to better understanding of the mechanism of stemness and chemotherapy resistance in liver cancer but also suggest that CK2αmay be used as a candidate treatment target for patients with liver cancer.
Acknowledgments
None.
CRediT authorship contribution statement
Di Wu:Conceptualization, Data curation, Funding acquisition,Methodology, Writing - original draft.Yuan-Qin Yin:Conceptualization, Writing - review & editing.Yan Li:Formal analysis,Methodology.Ling Zhang:Data curation.You-Hong Jiang:Resources, Validation.Zhe Wang:Conceptualization, Formal analysis,Funding acquisition, Supervision, Writing - review & editing.
Funding
This study was supported by grants from the National Natural Science Foundation of China (81602589 and 81601692) and 345 Talent Program of Shengjing Hospital.
Ethicalapproval
This study was approved by the Ethics Committee of the First Affiliated Hospital of China Medical University (2016-124).
Competing interest
No benefits in any form have been received or will be received from a commercial party related directly or indirectly to the subject of this article.
 Hepatobiliary & Pancreatic Diseases International2023年4期
- Hepatobiliary & Pancreatic Diseases International的其它文章
- Novel re-intervention device for occluded multiple uncovered self-expandable metal stent (with video)
- Hepatopancreatoduodenectomy for the treatment of extrahepatic cholangiocarcinoma ✩
- Microbiological cultures and antimicrobial prophylaxis in patients undergoing total pancreatectomy with islet cell autotransplantation
- Risk factors for posttransplant diabetes in patients with hepatocellular carcinoma
- The role of targeting protein for Xklp2 in tumorigenesis of hepatocellular carcinoma
- Isolated IgG4-associated autoimmune hepatitis or the first manifestation of IgG4-related disease?