
Biomechanics associated with tibial stress fracture in runners:A systematic review and meta-analysis
2023-06-06 13:35ClreMilnerEricFochJosephGonzlesDrewPetersen
Clre E.Milner *,Eric Foch ,Joseph M.Gonzles ,Drew Petersen
a Department of Physical Therapy and Rehabilitation Sciences,Drexel University,Philadelphia,PA 19102,USA
b Department of Health Sciences,Central Washington University,Ellensburg,WA 98926,USA
Abstract Background: Tibial stress fracture (TSF) is an overuse running injury with a long recovery period.While many running studies refer to biomechanical risk factors for TSF,only a few have compared biomechanics in runners with TSF to controls.The aim of this systematic review and meta-analysis was to evaluate biomechanics in runners with TSF compared to controls.Methods: Electronic databases PubMed,Web of Science,SPORTDiscus,Scopus,Cochrane,and CINAHL were searched.Risk of bias was assessed and meta-analysis conducted for variables reported in 3 or more studies.Results: The search retrieved 359 unique records,but only the 14 that compared runners with TSF to controls were included in the review.Most studies were retrospective,2 were prospective,and most had a small sample size (5-30 per group).Many variables were not significantly different between groups.Meta-analysis of peak impact,active,and braking ground reaction forces found no significant differences between groups.Individual studies found larger tibial peak anterior tensile stress,peak posterior compressive stress,peak axial acceleration,peak rearfoot eversion,and hip adduction in the TSF group.Conclusion: Meta-analysis indicated that discrete ground reaction force variables were not statistically significantly different in runners with TSF compared to controls.In individual included studies,many biomechanical variables were not statistically significantly different between groups.However,many were reported by only a single study,and sample sizes were small.We encourage additional studies with larger sample sizes of runners with TSF and controls and adequate statistical power to confirm or refute these findings.
Keywords: Bone stress injury;Gait;Kinematics;Kinetics;Tibial acceleration
1.Introduction
Running is a popular form of exercise with many health benefits,but it is also associated with a high rate of overuse injury,ranging from 19% to 80%.1Overuse injuries result in time lost from running,which can impact health,well-being,and fitness or competition goals.While many factors both internal and external to the body may contribute to overuse injury,2running biomechanics is a readily modified factor and,therefore,a common target for injury prevention efforts.
Tibial stress fracture (TSF) is a running injury caused by repeated mechanical loading leading to bone strain that creates microcracks at a rate that accumulates beyond the bone’s capacity for repair and remodeling.3It is also a serious injury with a typical recovery period of up to 8 weeks.4Furthermore,runners are 5 times more likely to experience a recurrence of stress fracture after the initial injury episode,pointing to an underlying factor that is not resolved during rehabilitation treatments.5Thus,efforts to reduce the risk of TSF in runners are needed to break the cycle of recurrent and long-lasting periods of injury.Given the frequency and severity of TSF,running biomechanics have been a target of TSF research.
We have observed that many studies refer to biomechanical risk factors for TSF when interpreting findings on healthy runners,but only a few have compared biomechanics in runners with TSF to controls.Rather,many studies report biomechanics of healthy runners only and do not include a TSF group.Additionally,existing systematic reviews evaluating the literature on running biomechanics and injury have only considered vertical ground reaction force variables.6,7Thus,there is a need to systematically review the literature that compares the biomechanics of runners with TSF to controls to determine the strength of current evidence for biomechanical differences and to identify gaps in the literature as well as areas where further research is needed.Therefore,the aim of this systematic review and meta-analysis was to examine biomechanics in runners with TSF compared to controls by evaluating and synthesizing the peer-reviewed literature.
2.Methods
2.1. Literature search
We conducted a systematic review of the published peerreviewed literature reporting running biomechanics associated with TSF.The review and protocol were not registered but were conducted according to published Preferred Reporting Items for Systematic reviews and Meta-Analyses (PRISMA)guidelines.8-10A research question was developed according to the 3 elements detailed by Booth et al.11(who: runners;what: TSF;and how: biomechanics): Which biomechanical parameters distinguish runners with TSF from runners without TSF?A search strategy was developed with the assistance of a librarian to define search terms for the study participants(runners),target condition (TSF),and outcome measures of interest (biomechanical variables measured during running).The electronic databases PubMed,Web of Science,SPORTDiscus,Scopus,Cochrane,and CINAHL were searched for published peer-reviewed articles and abstracts from all years up to May 2021.Literature review articles and articles in languages other than English were excluded.The complete search strategy for all databases is detailed in Supplementary Table 1.Additionally,a hand search of the reference lists of review articles identified during the search was conducted.
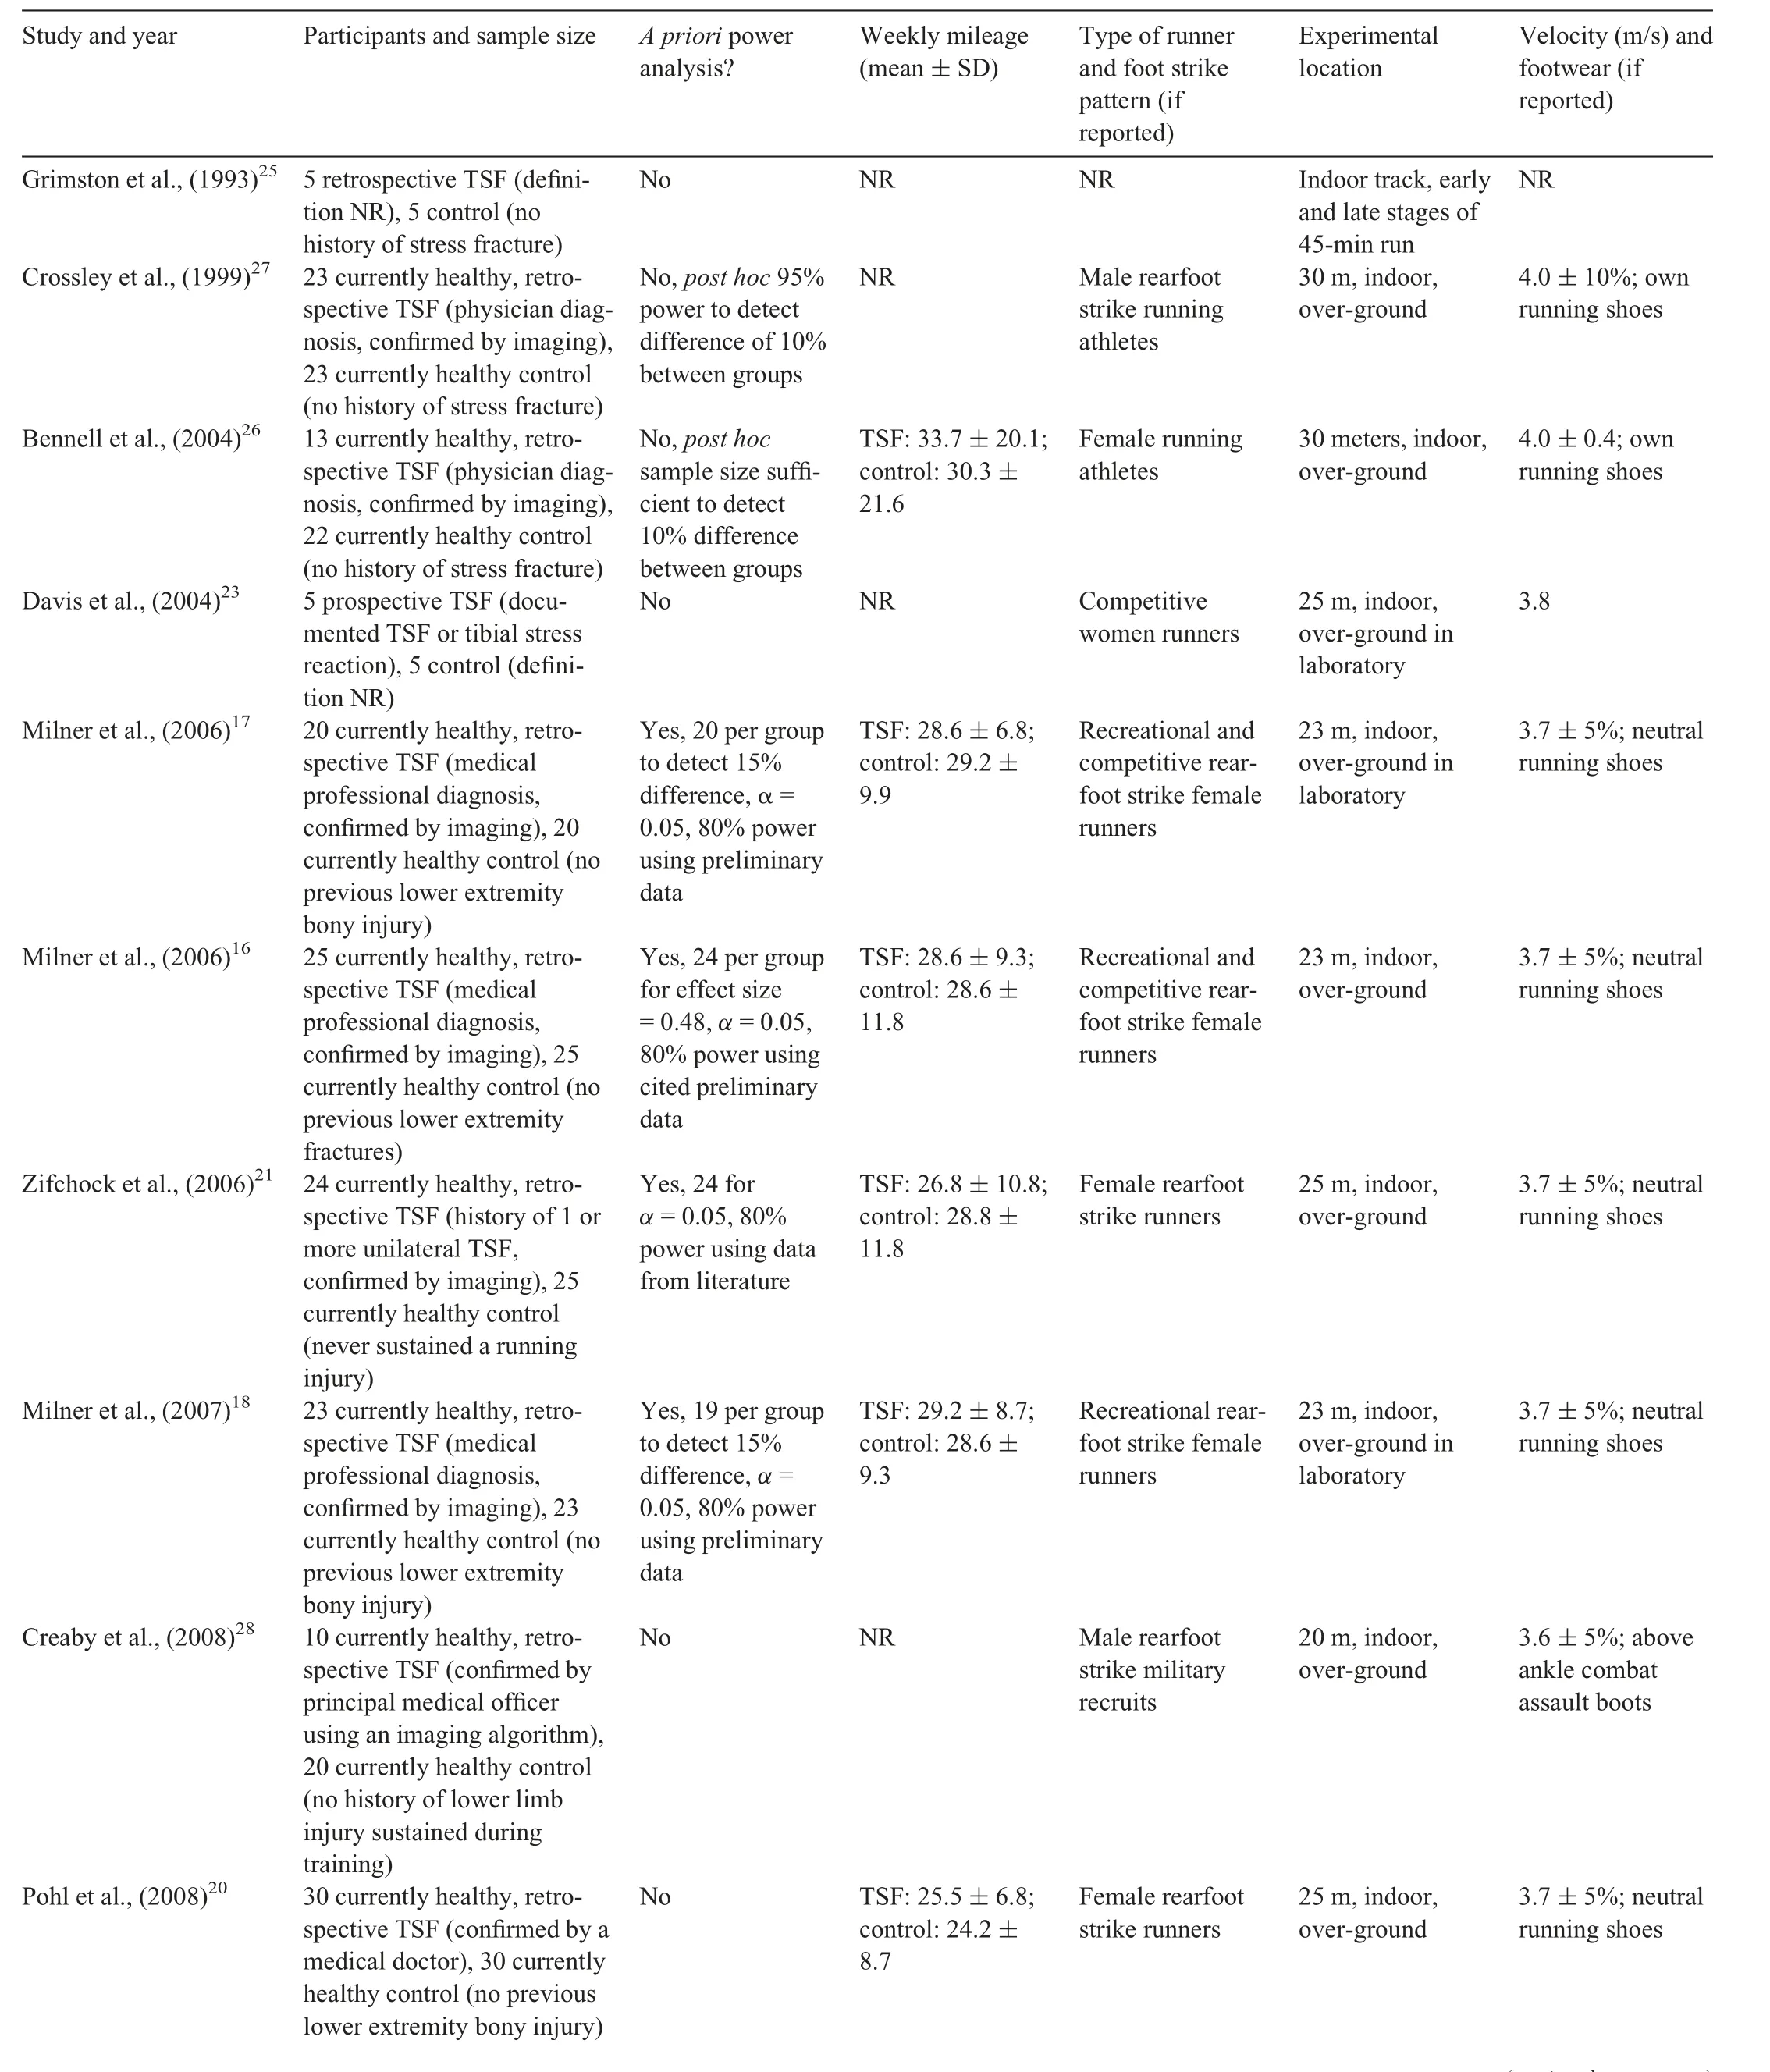
Table 1 Description of included studies.
Two reviewers (CEM and DP) independently screened items for inclusion in the review in 3 rounds.First,articles that could be excluded based on title were excluded from further review.Second,articles were excluded based on their abstract.Third,the full text of all remaining articles was retrieved,then articles were excluded following review of the full text by both reviewers.The final lists of potential articles for inclusion from each reviewer were compared.Disagreements in article selection were resolved by discussion and joint review of the full text until consensus was reached.
2.2. Data extraction
Study details were extracted into a spreadsheet independently by 2 reviewers (DP and JMG).Details extracted included country,year of publication,group definitions and inclusion/exclusion criteria,participant characteristics(weekly mileage,sex,running level,and foot strike pattern of participants),sample sizes,experimental location,running velocity,footwear during testing,and primary data analysis.Extracted details for each study were then compared,and discrepancies between reviewers were resolved by discussion and review of the article with the third reviewer(CEM).
Biomechanical data for the comparison of TSF and control groups were extracted from all included articles by a single reviewer(JMG)and put into a spreadsheet.Group means,standard deviations (SDs),and sample sizes were extracted,plus effect size,if reported,andpvalues for group comparisons.A second reviewer (DP) confirmed the extracted data’s fidelity with the original articles.Any discrepancies between reviewers were resolved by discussion and review of the articles with the third reviewer (CEM).All quantitative biomechanical variables reported in the articles were extracted.When an outcome variable was reported more than once from the same large research study,only the findings from the report with the largest sample size were included to avoid over-representing the study in this review.Cohen’sdeffect sizes12were calculated when group means and standard deviations were provided in studies that did not report effect size.Data were compiled into tables for presentation of results.
2.3. Risk of bias assessment
The risk of bias in included articles was assessed by 2 reviewers (JMG and DP) using 2 tools.Included studies were evaluated according to the Joanna Briggs Institute checklist for analytical cross-sectional studies.13The checklist was modified by removing an item about exposure,leaving a total of 7 items for appraisal.Articles were scored 0-7 with 1 point given for each“yes”answer to checklist questions about study methods and statistical analysis.Answers of“no”or“unclear”were given 0 points.Included studies were also evaluated for the quality of study design,reporting of results,and risk of bias using the AXIS tool for cross-sectional studies.14Any discrepancies between reviewers were resolved by discussion and review of the article with the third reviewer (CEM).An overall risk of bias was determined for each study based on the collective findings of these evaluations.
2.4. Meta-analysis
To be included in the meta-analysis,a variable must have been reported for both TSF and control groups in 3 or more studies.Mean,SD,and group sample size for each variable were entered into the software Review Manager Version 5.41.(RevMan,Copenhagen,Denmark).Separate meta-analyses were performed for each continuous variable.Group mean differences were analyzed via an inverse variance fixed-effect model.15This statistical model weights the effect of each study by the inverse of the variance from each study included in the meta-analysis.Group mean differences were considered different from 0 if the overall effect wasp<0.05.Ninety-five percent confidence intervals were also computed for the mean differences within each study.The test statistics χ2(with correspondingpvalue)and heterogeneity(I2)were used to describe the amount of heterogeneity across studies in each metaanalysis.15I2was considered low (25%-<50%),moderate(50%-<75%),and high(≥75%).15
3.Results
3.1. Study selection
The initial search retrieved 684 records,resulting in 359 unique records when duplicates were removed (Fig.1).Following evaluation of title and abstract,337 items were excluded,and 28 full texts were retrieved for assessment,with 14 items (12 research articles and 2 conference abstracts)retained for inclusion in the review.
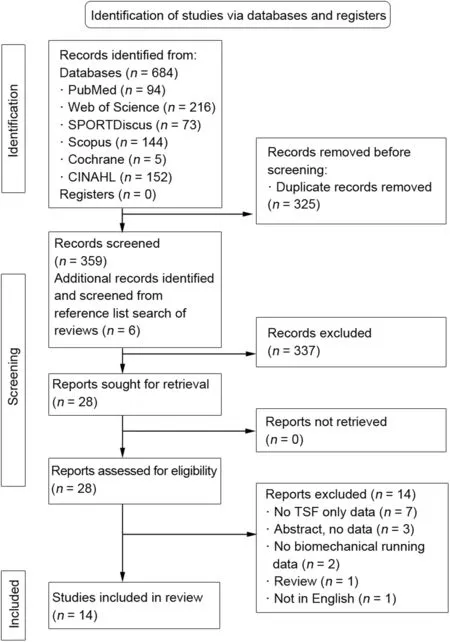
Fig.1.Preferred Reporting Items for Systematic reviews and Meta-Analyses(PRISMA)202010 flow diagram.TSF=tibial stress fracture.
3.2. Study characteristics
The 14 included publications were published between 1993 and 2020 in Australia,Canada,the UK,and the USA(Table 1).Of these 14,6 were from the same larger research study reporting runners with a history of TSF.16-21Sample sizes ranged from 5 to 30 participants per group,anda prioripower analysis for sample size justification was provided in 6 studies (Table 1).All studies compared a group of runners with current,future,or a history of TSF to a healthy control group.There was some variation in how the groups were defined according to study inclusion and exclusion criteria.Occurrence of TSF was confirmed by a medical professional and/or confirmed by imaging in all but a single study.There was also some variation in the definition of the control group.Runners in both groups were healthy and free of injury at the time of data collection in most studies.One study included currently injured runners,22and 2 others were prospective.23,24Most studies were conducted indoors,looked at overground running,and reflected the traditional gait analysis laboratory setting.One study was conducted on an indoor running track with the runner making contact with the force platform once per lap,25and another was conducted on an instrumented treadmill.22When reported,running velocity was fixed and ranged from 3.6 m/s to 4.0 m/s.In the treadmill study,running velocity was self-selected and averaged 2.60 m/s in runners with current TSF and 2.65 m/s in controls.22
Discrete biomechanical outcome variables were measured and/or calculated in all studies.Direct measurements were made of lower extremity kinematics,tibial acceleration,and ground reaction forces during running.Lower extremity kinetics were calculated via inverse dynamics.Bone stress variables were modeled from 3-dimensional gait analysis combined with bone parameters determined from tibial X-rays.Following traditional gait analysis methods,peak magnitudes for variables of interest or magnitude at defined time points in the stride cycle were extracted from the time series data.Magnitudes were averaged across multiple trials per participant,and group differences analyzed to identify statistically significant differences.
3.3. Risk of bias in included studies
The majority(12/14)of articles scored 7/7 for methodological quality according to the Joanna Briggs Institute checklist,indicating a low risk of bias.Two conference abstracts scored 2/7 and 3/7,respectively,indicating greater risk of bias(Supplementary Table 2).The AXIS appraisal tool mirrored these findings,with the 2 abstracts being of lower methodological quality due to their brevity and smaller sample size than the majority of studies,which were high quality (Supplementary Table 3).Thus,except for the 2 abstracts,all included studies were considered to have a low risk of bias.
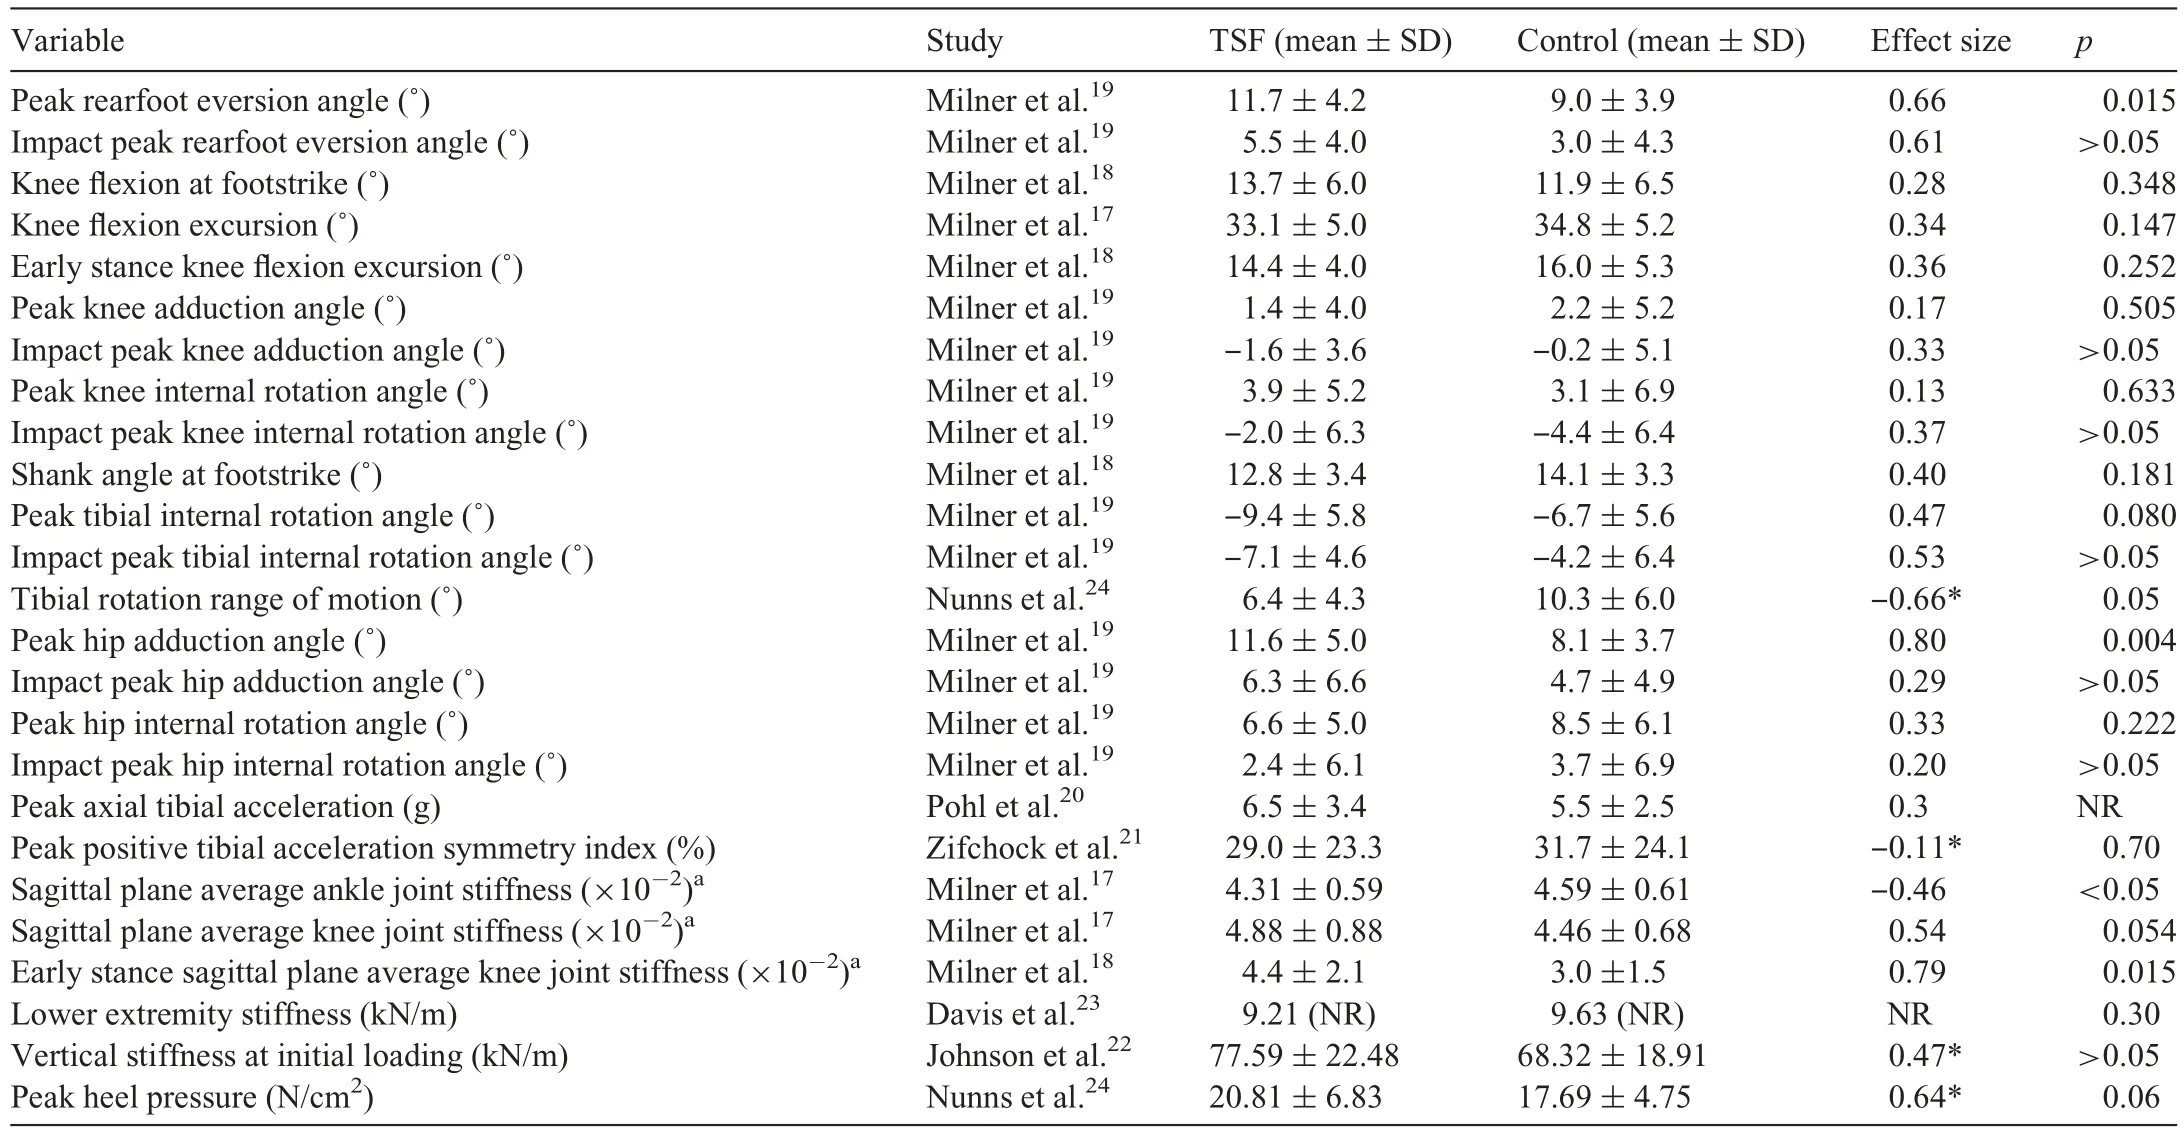
Table 2 Kinematic and kinetic variables in tibial stress fracture(TSF)and control groups.
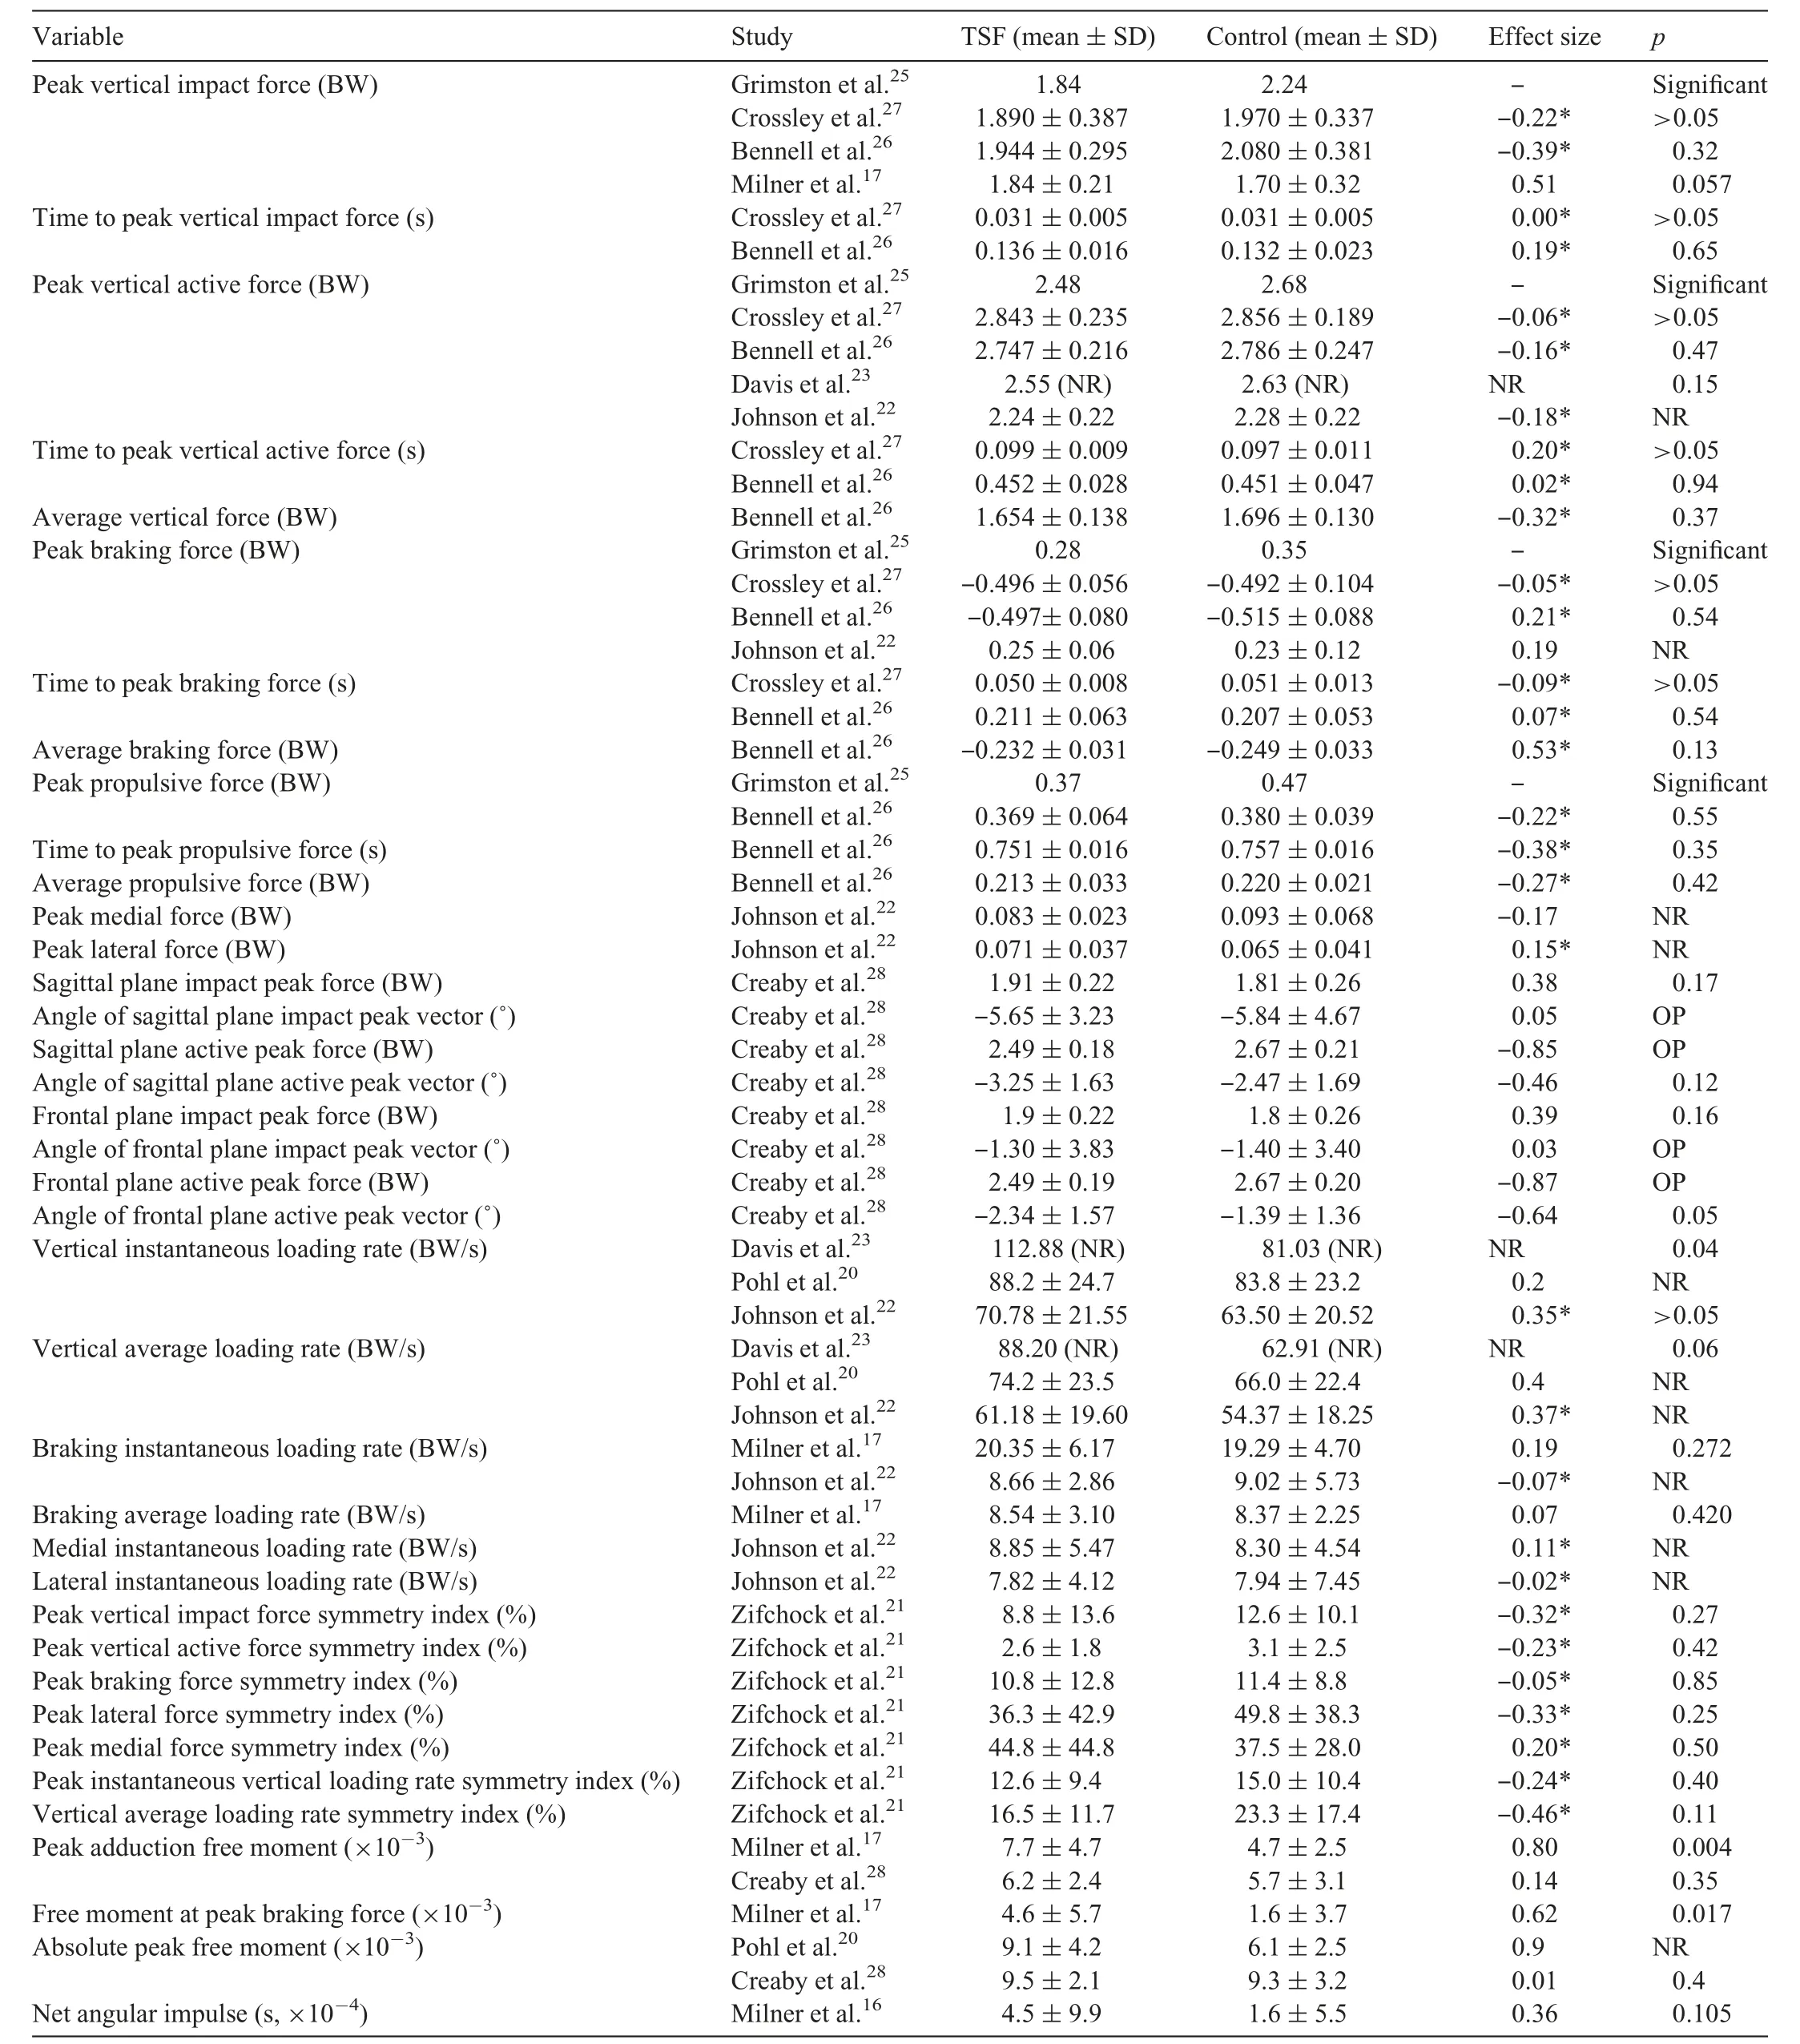
Table 3 Ground reaction force variables in TSF and control groups.
3.4. Findings of included studies
3.4.1.Meta-analysis results
Due to the greater risk of bias,data reported in either of the 2 abstracts were not included in the meta-analysis.Therefore,meta-analyses were conducted for 3 variables: peak vertical impact force,peak vertical active force,and peak braking force.The results present insufficient evidence to reject the null hypothesis of no difference between groups for any of the ground reaction force variables included in the meta-analysis of runners with previous TSFvs.controls (p>0.05).Specifically,the meta-analysis for peak vertical impact force included 122 runners and had ap-value of 0.92 with moderate heterogeneity (I2=57%;Fig.2).The meta-analysis for peak vertical active force,included 170 runners and had ap-value of 0.36 with low heterogeneity(I2=0%;Fig.3).Lastly,the meta-analysis for peak braking force included 170 runners and had ap-value of 0.53 with low heterogeneity(I2=0%;Fig.4).
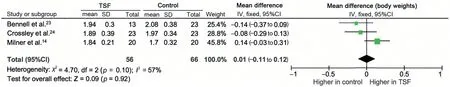
Fig.2.Forest plot of vertical impact peak during running showing no difference between groups.Normalized to body weight.95%CI=95%confidence interval;IV=inverse variance;TSF=tibial stress fracture.TagedEnd
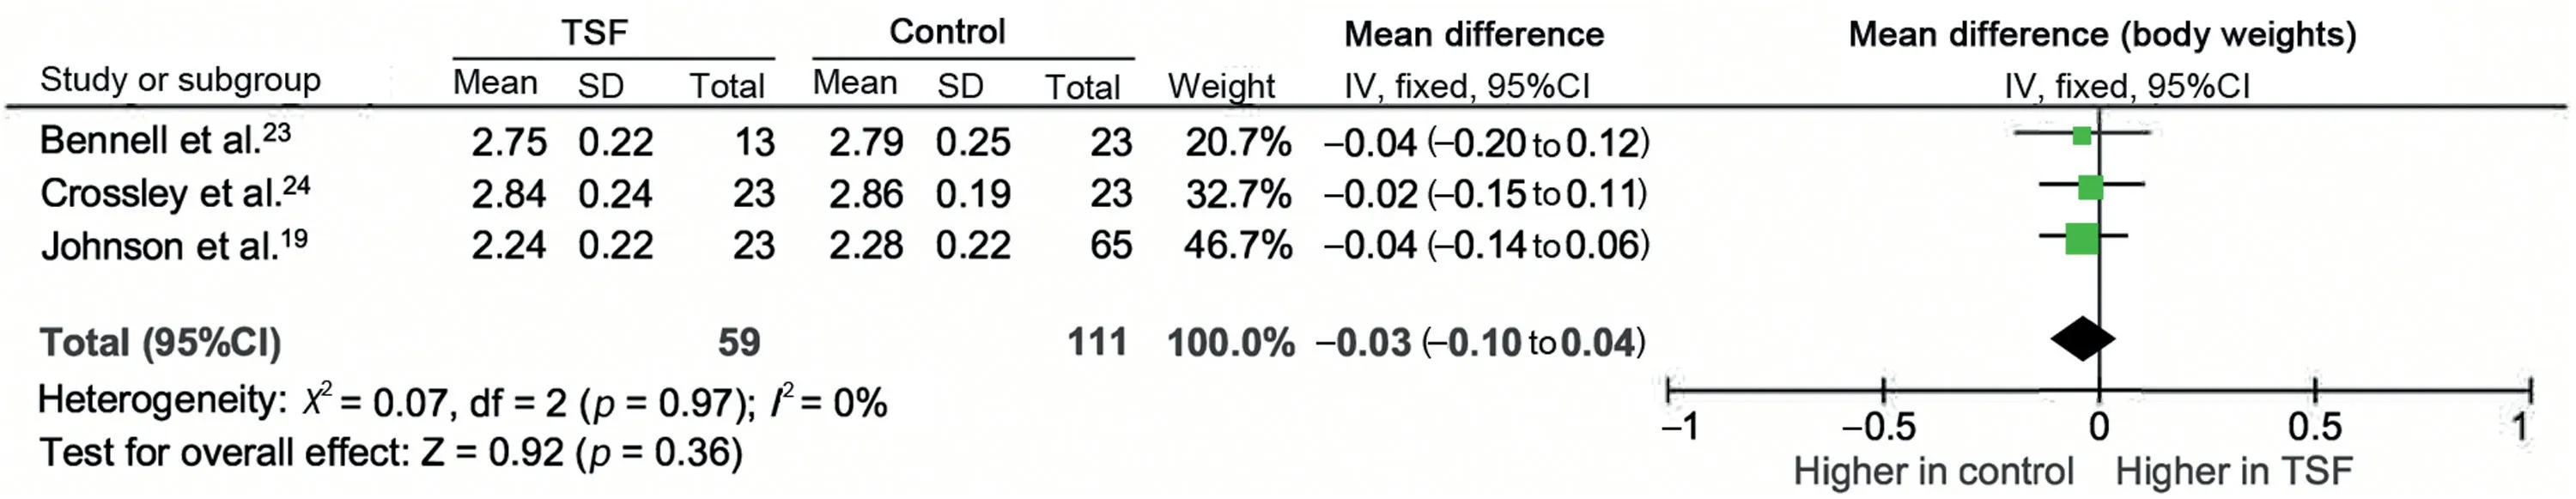
Fig.3.Forest plot of peak vertical active force during running showing no difference between groups.Normalized to body weight.95%CI=95% confidence interval;IV=inverse variance;TSF=tibial stress fracture.TagedEnd
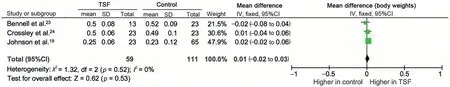
Fig.4.Forest plot of peak braking force during running showing no difference between groups.Normalized to body weight.95%CI=95% confidence interval;IV=inverse variance;TSF=tibial stress fracture.TagedEnd
3.4.2.Systematic review results
A total of 25 kinematic and kinetic variables were reported,with many having no effects and insufficient evidence to reject the null hypothesis of no significant differences between groups (Table 2).However,some significant differences (p<0.05) were noted as follows: Peak eversion angle was significantly larger with a moderate effect in the TSF group compared to controls.19At the hip,the peak adduction angle was larger in the TSF group,with a large effect compared to controls.19Early stance sagittal plane knee joint stiffness was significantly larger with a large effect18in the TSF group compared to controls.Additionally,tibial rotation range of motion was smaller,with a moderate effect (compared to controls) during barefoot running in recruits who went on to sustain TSF.24
A total of 38 different ground reaction force variables were reported,with most having no to small effects and insufficient evidence to reject the null hypothesis of no significant differences between groups (Table 3).Peak vertical impact force was significantly smaller in the TSF group compared to controls in an abstract25but not statistically significantly different in other studies.17,26,27Similarly,in the same abstract peak propulsive force was significantly smaller in the TSF group,25but it was not statistically significantly different in another study.26It should be noted that the abstract25did not indicate whether standard deviation or standard error of the mean was reported;thus,effect sizes were not calculated here.Vertical instantaneous loading rate was significantly larger in a small prospective TSF group compared to controls reported in another abstract,23but it was not statistically significantly different in other studies.20,22Peak adduction free moment was significantly larger in the TSF group and with a large effect compared to controls in 1 study16but not statistically significantly different and with no effect in another.28Free moment at peak braking force was significantly larger in the TSF group and with a moderate effect compared to controls.16
Tibial bone stress during running was reported in a recent study by Meardon et al.29(Supplementary Table 4).Peak anterior tensile stress and peak posterior compressive stress at the distal third of the tibia were both significantly larger in the TSF group and with moderate effects compared to controls.
4.Discussion
The purpose of this systematic review and meta-analysis was to examine biomechanics in runners with TSF compared to controls by evaluating and synthesizing the peer-reviewed literature.Overall,365 relevant publications were found,but only 14 compared runners with TSF to a control group.Risk of bias was low,except for the 2 abstracts,which lacked methodological detail due to their short length.All 365 publications identified in the search included some combination of the tibia/tibial and stress fracture/bony injury terms as indicated in Table 1.However,the vast majority of those studies did not include a group of runners with TSF,despite appearing in a search specifically including TSF in the terms.While there is clearly a great deal of interest in understanding the biomechanics associated with TSF in runners,few studies have adequately addressed this by including runners with the injury.
4.1. Sample size of included studies
Overall,the sample sizes of these studies were rather small.According to G*Power,30for an independent samplesttest with 80%power andp<0.05,a sample size of 26 participants per group would be needed to detect a significant difference between groups for a large effect size,and 64 per group to detect a significant difference for a moderate effect size.Only 2 studies included more than 26 participants per group,19,20and none had more than 30 per group.Thus,10 of the 14 reports were underpowered to detect large effects,and all were underpowered to detect moderate effects.We acknowledge that increasing the sample size in studies of runners with TSF will take more resources,which may be a practical limitation for many researchers seeking to investigate the biomechanics of TSF in runners.These practical limitations are likely major contributing factors to the small sample sizes in many of the included studies.Differences of 15% or 1 standard deviation were used to determine sample size in several included studies.However,if there are important differences between TSF and control groups that are smaller than this(e.g.,moderate effect sizes),they are not likely to be identified as significant differences.Thus,the systematic review findings for variables reported by only 1 or 2 studies should be considered preliminary and suggestive of variables that may be further investigated in the effort to understand biomechanical differences between runners with TSF and controls.
4.2. Variables for further investigation
Variables from the present studies with moderate or larger effect sizes (andp>0.05) may also be considered worthy of further investigation.Thus,dependent variables to be considered include peak hip adduction angle,20peak rearfoot eversion,19tibial internal rotation and rearfoot eversion at impact peak,19sagittal plane average knee stiffness,17vertical impact peak,17average braking ground reaction force,26absolute peak free moment,20frontal and sagittal plane vertical ground reaction force active peaks,28angle of the frontal plane vertical ground reaction force vector at active peak,28and peak heel pressure.24Overall,the current body of literature comparing runners with TSF to controls identified several biomechanical variables that may be larger in the TSF group and,therefore,appropriate for further investigation.
Of the 67 dependent variables identified,only 3 were reported in 3 or more higher quality studies,and so only these 3 were included in the meta-analysis.All of these variables were discrete ground reaction force variables—verticalimpact,active peaks,peak braking force—and were not different in runners with TSF compared to controls.This is not surprising as ground reaction force is a response to the acceleration of the center of mass of the whole body.Therefore,observed ground reaction forces cannot be attributed to an individual joint or specific body segment,such as the tibia.31It is feasible that many different body segment acceleration configurations could result in the same magnitude of ground reaction force peaks.Bone stress is influenced by muscle forces and joint reaction forces in addition to ground reaction forces.29Therefore,discrete ground reaction force variables are likely not sensitive enough to indicate differences between TSF and control runners.
Of the remaining 64 ground reaction force,kinematic,kinetic,and bone stress variables,the majority were reported in only a single study.Most variables reported were not significantly different between groups,with only small effects identified.However,the study modeling tibial bone stress found significant moderate to large effects for higher anterior tensile and posterior compressive tibial stress in the TSF group compared to controls.29These findings suggest that the tibia is loading differently during running in those with TSF compared to controls.Approaches that seek to characterize the biomechanics of the tibia during running,including bone stress and strain,may prove fruitful in teasing out conditions that increase the magnitude of tibial loading.This may help to identify targets for intervention to reduce injury risk during running.29These tibial measures may be most insightful when included with variables characterizing running biomechanics to help determine which gait patterns reduce tibial load.
There was a pattern of frontal plane kinematic differences with greater peak rearfoot eversion and hip adduction angles19,20but smaller tibial rotation range of motion during running in the TSF group compared to controls.24Differences in frontal plane alignment and transverse plane motion in runners with TSF may alter the distribution of loading on the tibia from that seen in controls.19Since rearfoot eversion is coupled with tibial rotation at the subtalar joint,32a smaller range of tibial rotation with greater peak rearfoot eversion may increase torsional loads within the tibia and contribute to increased bone stress.Therefore,these differences in lower extremity frontal plane alignment may alter the distribution of forces on the tibia,possibly contributing to the risk of injury.
4.3. Characteristics of study participants
Per our review criteria,all TSF groups included runners with TSF.Most studies published as original research articles were retrospective and included runners who had a previous TSF from which they had recovered and who were injury-free at the time of testing.However,1 study did include runners who were currently injured.22Furthermore,2 studies with a small number of runners in the TSF group were prospective.23,24As is typical for overuse running injuries,no prospective biomechanical studies with a large sample size of injured runners have been reported.However,given that there is a high likelihood of recurrence of TSF following the initial injury,5retrospective studies can provide insight into underlying factors that may be associated with the injury and future injury recurrence.Criteria for inclusion in the control group varied from no history of TSF specifically to no history of any running injury.If there are unique biomechanical features of running associated with TSF,the control group would,at a minimum,need to only exclude runners with a TSF.Given the reported 19% to 79% incidence of injury in runners,1excluding runners with any previous running injury from the control group greatly reduces the available pool of participants.Thus,to facilitate the inclusion of larger sample sizes,we recommend that future studies include currently healthy runners with confirmed history of TSF in the injury group and runners with no history of TSF in the control group.
The majority of studies focused on female runners,likely because female runners have a higher incidence of stress fracture.33However,3 studies included only male runners,24,27,282 included both men and women,22,29and 1 did not report.25Since differences in running biomechanics between men and women have been reported for some lower extremity biomechanical variables,34it is necessary to confirm that differences reported in female runners also occur in male runners and vice versa.For example,a study conducted in female runners comparing those with TSF to a control group found larger peak free moment in the TSF group,14but a study comparing male runners found no difference in the same variable between groups.28However,it cannot be determined whether these are gender differences or simply conflicting study findings.Therefore,we recommend that future studies include both male and female runners and power the study so that women and men can be treated as separate subgroups during statistical analysis.Alternatively,if limited resources prohibit this,we suggest focusing on either female or male runners.
All but 2 studies reported laboratory gait analysis during overground running in short trials of 15-30 m.Recent work with precision wearables found significant differences between the magnitude of biomechanical variables collected in the traditional gait analysis laboratory setting and field measures.35In particular,tibial acceleration variables were higher when measured during outdoor running compared to running in the laboratory in healthy runners.35Thus,biomechanical variables associated with TSF during laboratory gait analysis cannot be assumed to have the same magnitudes when measured during running in the field.Field-based investigations must seek to determine whether the same differences exist between runners with TSF and controls when they are in the outdoor environment.
Some limitations of this review should be noted.The search was restricted to research literature published in English and so does not account for studies published in other languages.Our focus was on running biomechanics,which may be modifiable,and so we did not include bone geometry or other unmodifiable anatomical variables.Since our focus was specifically on TSF,we excluded studies that placed runners with stress fracture at other lower extremity locations within the same group as those with TSF.This reduced the number of included studies but avoided the risk of masking differences attributable to TSF that may be inconsistent with other stress fracture sites,such as the femur or metatarsals.Furthermore,given the potential limiting effects on meta-analysis of a small number of included studies and moderate heterogeneity,36the finding for peak vertical impact force should be interpreted with caution.
5.Conclusion
The literature reveals an ongoing interest in identifying approaches for reducing the risk of TSF in runners by examining running biomechanics.However,we found only 14 reports (2 of which were abstracts) that compared aspects of running biomechanics between TSF and control groups,and only 1 that reported tibial stress.Many variables were reported by only a single study.Many variables were not statistically significantly different between the TSF and control groups.Specifically,meta-analysis indicated that the discrete ground reaction force variables vertical impact peak,vertical active peak,and peak braking force were not statistically significantly different in runners with TSF compared to controls.Sample sizes were small,so studies may have been underpowered to detect important differences.We encourage future studies to compare runners with previous,current,or prospective TSF to controls with no history of TSF and to use sample sizes of at least 26 per group to detect group differences with large effects and at least 64 to detect moderate effects.This may require multi-center studies to ensure sufficient statistical power.While prospective studies are the gold standard,we acknowledge that the resources required for these studies are substantial.Thus,we also encourage studies comparing runners with a history of TSF or current TSF to controls to identify biomechanics associated with TSF.
Acknowledgments
The authors gratefully acknowledge the assistance of librarian Ms Janice Masud-Paul in developing our search strategy.Financial support was not received for this review.Data extracted from individual studies are reported in tables and Supplementary Tables.
Authors’contributions
CEM conceived the idea and developed the design of the review,reviewed the literature,wrote the manuscript,and checked data fidelity;JMG and DP also reviewed the literature,contributed to table and figure preparation and data extraction,checked data fidelity,and provided suggestions and revisions to the original draft;EF performed all meta-analyses and associated figure preparation and provided suggestions and revisions to the original draft.All authors have read and approved the final version of the manuscript,and agree with the order of presentation of the authors.
Competing interests
The authors declare that they have no competing interests.
Supplementary materials
Supplementary materials associated with this article can be found in the online version at doi:10.1016/j.jshs.2022.12.002.
 Journal of Sport and Health Science2023年3期
- Journal of Sport and Health Science的其它文章
- Impact loading in female runners with single and multiple bone stress injuries during fresh and exerted conditions
- Are EPB41 and alpha-synuclein diagnostic biomarkers of sport-related concussion?Findings from the NCAA and Department of Defense CARE Consortium
- Factors and expectations influencing concussion disclosure within NCAA Division I athletes:A mixed methodological approach
- Effects of contact/collision sport history on gait in early-to mid-adulthood
- Refinement of saliva microRNA biomarkers for sports-related concussion
- Lacrosse-related injuries in boys and girls treated in U.S.emergency departments,2000-2016