
Impact loading in female runners with single and multiple bone stress injuries during fresh and exerted conditions
2023-06-06 13:35KristinPoppJeremeOuterleysSarahGehmanMargaretGarrahanSaraRudolphElizaethLorangerKathrynAkermanAdamTenfordeMaryBouxseinIreneDavis
Kristin L.Popp *,Jereme Outerleys ,Sarah Gehman ,Margaret Garrahan ,Sara Rudolph ,Elizaeth Loranger ,Kathryn E.Akerman,d,Adam S.Tenforde,Mary L.Bouxsein,e,‡,Irene S.Davis,‡
a Military Performance Division,United States Army Research Institute of Environmental Medicine,Natick,MA 01760,USA
b Endocrine Unit,Massachusetts General Hospital,Harvard Medical School,Boston,MA 02114,USA
c Department of Physical Medicine and Rehabilitation,Spaulding Rehabilitation Hospital,Harvard Medical School,Cambridge,MA 02138,USA
d Department of Sports Medicine,Boston Children’s Hospital,Harvard Medical School,Boston,MA 02115,USA
e Center for Advanced Orthopedic Studies,Beth Israel Deaconess Medical Center,Harvard Medical School,Boston,MA 02215,USA
Abstract Background: Bone stress injuries (BSIs) are common in female runners,and recurrent BSI rates are high.Previous work suggests an association between higher impact loading during running and tibial BSI.However,it is unknown whether impact loading and fatigue-related loading changes discriminate women with a history of multiple BSIs.This study compared impact variables at the beginning of a treadmill run to exertion and the changes in those variables with exertion among female runners with no history of BSI as well as among those with a history of single or multiple BSIs.Methods: We enrolled 45 female runners (aged 18-40 years)for this cross-sectional study: having no history of diagnosed lower extremity BSI(N-BSI,n=14);a history of 1 lower extremity BSI(1-BSI,n=16);and diagnosed by imaging,or a history of multiple(≥3)lower extremity BSIs(M-BSI,n=15).Participants completed a 5-km race speed run on an instrumented treadmill while wearing an Inertial Measurement Unit.The vertical average loading rate(VALR),vertical instantaneous loading rate(VILR),vertical stiffness during impact via instrumented treadmill,and tibial shock determined as the peak positive tibial acceleration via Inertial Measurement Unit were measured at the beginning and the end of the run.Results: There were no differences between groups in VALR,VILR,vertical stiffness,or tibial shock in a fresh or exerted condition.However,compared to N-BSI,women with M-BSI had greater increase with exertion in VALR (-1.8% vs.6.1%, p=0.01) and VILR (1.5% vs.4.8%,p=0.03).Similarly,compared to N-BSI,vertical stiffness increased more with exertion among women with M-BSI(-0.9%vs.7.3%,p=0.006)and 1-BSI (-0.9% vs.1.8%, p=0.05).Finally,compared to N-BSI,the increase in tibial shock from fresh to exerted condition was greater among women with M-BSI(0.9%vs.5.5%,p=0.03)and 1-BSI(0.9%vs.11.2%,p=0.02).Conclusion: Women with 1-BSI or M-BSIs experience greater exertion-related increases in impact loading than women with N-BSI.These observations imply that exertion-related changes in gait biomechanics may contribute to risk of BSI.
Keywords: Biomechanics;Bone stress injuries;Fatigue;Runners;Stress fracture
1.Introduction
Bone stress injuries (BSIs) are a common and debilitating overuse injury,particularly in women1-4who engage in repetitive mechanical loading such as military training5-7and running.4,8BSIs are often accompanied by risk of re-injury,persisting morbidity,and failure to return to sport or military duty.9-12Moreover,prior BSI is among the strongest risk factors for future BSI.8,13-15Because BSIs generally require a minimum of 6-12 weeks for healing,sustaining multiple BSIs is particularly devastating to military trainees and athletes.Thus,these injuries may result in military discharge or loss of ability to compete in sport.
Although the exact etiology of BSI or multiple BSIs remains ill-defined,16BSIs are thought to result from a combination of factors.These include strain magnitude,strain rate,and the number of loading cycles contributing to local fatigue of bone and subsequent injury.17Several biomechanical factors during running have been associated with BSI incidence and history.Vertical ground reaction force (VGRF),in particular,are often studied in running injury research,with the vertical component representing the largest contributor to ground reaction force.18-21Greater vertical average loading rate(VALR)and vertical instantaneous loading rate(VILR)as well as tibial shock have been reported in women with tibial stress fracture history.22-24This was further supported by a systematic review that concluded that VILR and VALR were higher in BSI groups compared to controls,while peak vertical forces were not.25While load rates are a measure of the change in force with respect to time,vertical stiffness provides a measure of change in force with respect to center of mass excursion.This measure,taken during the impact phase,provides an indication of how well one is able to attenuate the impact force,with lower stiffness indicating greater attenuation.26,27
Most evidence linking kinetic variables to injury has been established during running in a fresh condition,though it is well acknowledged that both kinematic and kinetic factors may change with high levels of exertion over distances longer than 3000 m.28,29The effects of exertion on biomechanical variables associated with BSI have not been well elucidated;impact forces have been the most commonly studied outcomes.However,studies assessing impact forces are conflicting.Some reports indicate increased VGRF impacts and tibial shock measures via force plate or accelerometer with localized muscle fatigue (reduced maximum voluntary contraction) or after running exertion,30-32and others have found decreased impacts during an exertion inducing treadmill run or marathon.33,34To our knowledge,no study has assessed the relationship between changes in impact biomechanics with running exertion and history of multiple BSIs.
Therefore,the purpose of this study was to (a) compare impact variables at the beginning of a treadmill run to exertion between female runners with no history of BSI and those with a history of single or multiple(>3)BSIs,and(b)compare the changes in impact variables at the end of a treadmill run to exertion between female runners with no history of BSI and those with a history of single or multiple (>3) BSIs.We hypothesized that women with multiple BSIs would demonstrate higher impact forces during a fresh state and greater changes in impact variables with exertion when compared to women with no history of BSI and women with a history of single BSI.
2.Materials and methods
2.1. Participant characteristics
We recruited female athletes ages 18-40 years from the local community between May 2017 and January 2020.To be included in the study,participants had to engage in a minimum of 4 h of self-reported weightbearing exercise per week,including a minimum of 10 miles run per week,be injury-free for at least 6 months prior to enrollment,and report being able to complete an approximately 5-km run on a treadmill.All participants were classified as rearfoot or midfoot strikers using sagittal plane 2 dimensional digital video (125 Hz) during treadmill running at a standardized speed(2.7 m/s).A rearfoot strike pattern was defined as one where the heel contacted the ground first.A midfoot pattern was defined as the heel and ball of the foot contacting the ground simultaneously.Midfoot strikers were included because their load rates and tibial shock values have been shown to be similar to rearfoot strikers.35,36Women self-identified as having no history of diagnosed lower extremity BSI (N-BSI),a history of 1 lower extremity BSI(1-BSI),diagnosed by imaging,or a history of multiple (≥3)lower extremity BSIs (M-BSI) diagnosed by imaging.Exclusion criteria included underlying medical conditions (e.g.,diagnosed eating disorder,hyperparathyroidism,celiac disease) or use of medications (e.g.,oral steroids,bisphosphonates,lithium) known to affect bone health.This study was approved by the Institutional Review Boards of Massachusetts General Hospital and Spaulding Rehabilitation Hospital.Informed written consent was obtained from each subject prior to participation in the study.
2.2. Clinical history,anthropometric measurements,and bone mineral density
We measured height (to the nearest mm) using a wallmounted stadiometer.Body mass (to the nearest 0.1 kg) was obtained by calibrated electronic scale (Model 813;Seca GmbH &Co KG,Hamburg,Germany).We calculated body mass index as mass (kg) divided by height squared (m2).All measurements were taken twice,and the mean of the 2 measurements was used.Questionnaires were administered to assess health,physical activity,and injury history.
To compare bone quality between groups,we used dualenergy X-ray absorptiometry(DXA:QDR45000A;Hologic Inc.,Bedford,MA,USA) to assess bone mineral density (g/cm2) at the lumbar spine,femoral neck,and total hip.Bone mineral density values were standardized tozscores using available age,sex,and ethnicity normative values.Quality control was maintained through daily measurements of a Hologic DXA anthropomorphic spine phantom and visual review of every scan image by an investigator certified in bone densitometry interpretation.
2.3. Instrumented treadmill run
All participants were provided conventional,neutral cushioned shoes (Nike Air Pegasus;Nike Inc.,Beaverton,OR,USA) during testing.Inertial Measurement Units were attached(IMeasureU BlueThunder Inertial Measurement Unit,Auckland,NZ,USA;Accelerometer: +/16 g,1000 Hz) to the anteromedial aspect of both the right and left distal tibia,with the y-axis aligned with the long axis of the tibia.The device included an accelerometer housed in a 40 mm×28 mm×15 mm plastic housing and was secured by a canvas and Velcro strap.The device was tightened as much as possible without causing discomfort.Positive y-accelerations were directed toward the proximal tibia.
The running protocol was performed on a force instrumented treadmill (Tandem Belt,AMTI,Watertown,MA,USA),with force data sampled at 1500 Hz.Prior to running,each participant self-reported an estimated 5-km race pace in minutes per mile to be used during the run.Each participant’s estimated 5 km race pace was adjusted by an additional 15 s(i.e.,slower),to account for laboratory and treadmill effects,and converted to meters per second.
Participants performed a 5-min warm up at a self-selected speed.To initiate the run to exertion,the treadmill speed was set to each participant’s estimated 5-km race pace,with data collected at the end of the first min(4000 samples of data over 16 s).Participants ran at their 5-km race pace until they reached exertion.We defined exertion as a rating of perceived exertion(RPE)score of ≥18.Using this scale,a score of 1 is considered a very easy level of physical effort,≥18 is considered extremely hard effort,and 20 is considered maximal effort.Participants reported RPE every minute following the first 5 min of the run.Once an RPE of 17 was reached,force data were collected for each minute until an RPE of ≥18 was reported.This was followed by a final 4000 samples of data collected that were used for analysis.Treadmill speed was then reduced.
2.4. Data processing
The VGRF data collected using an instrumented treadmill were then used to calculate VALR,VILR,and vertical stiffness during impact.First,these force data were low-pass filtered at 50 Hz using a zero-phase fourth order Butterworth filter,with foot contacts identified when the vertical force exceeded a threshold of 40 N.The algorithm used to calculate VALR and VILR has been described previously.37Briefly,a region of interest was defined between the first instance that VGRF exceeded 75%of body weight and the last instance that the slope of the VGRF was >15 body weight/s.The latter point identifies the impact peak in most cases,particularly in rearfoot strike runners.VILR was calculated as the peak instantaneous derivative between 20%-100% of this region.VALR was calculated as the average derivative over 20%-80%of this region.Vertical stiffness during impact was calculated as the change in vertical force divided by the absolute change in vertical displacement of the center of mass during 20%-80% of the region of interest defined above (i.e.,same as the VALR).Center of mass displacement was determined through double integration of the VGRF38,39(Fig 1).
Tibial shock was determined from Inertial Measurement Unit accelerometer data using a custom Python processing script(Python Language Reference,Version 2.7;Python Software Foundation,Fredericksburg,VA,USA) that identified each stance phase during running.35,40The peak positive vertical acceleration measured at the distal medial tibia was then extracted from the raw accelerometer data during each stance phase.Data for each variable were extracted for 10-foot strikes and averaged.Accelerations due to gravity (g=9.81 m/s2)were used to normalize tibial shock variables to gravitational equivalents(g).For the BSI cohorts,the data used for analysis were from the side with the greatest number of BSIs.If the number of BSIs was even per side,the side with the most recent BSI was chosen.For the N-BSI group,the side was randomly chosen.Due to data collection issues,tibial shock data were not available for 9 participants (one N-BSI,seven 1-BSI,and one M-BSIs).
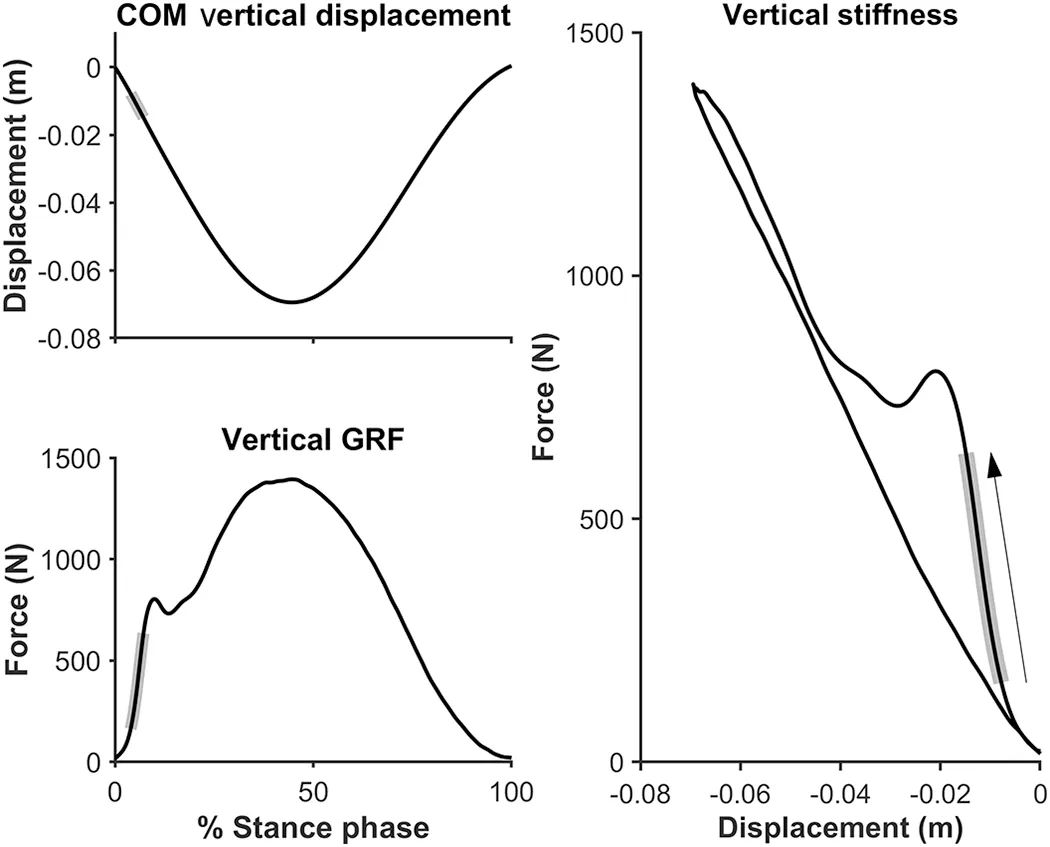
Fig.1.Vertical stiffness at impact during the stance phase was calculated as the change in vertical GRF divided by the absolute change in vertical displacement of the center of mass of 20%-80%of the region defined during load rate calculation(shaded region).COM=center of mass;GRF=ground reaction force.
2.5. Statistical analysis
Data were checked for normality and are reported as mean±SD for normally distributed variables or medians(interquartile range) for non-normally distributed variables.We performed one-way analysis of variance tests to determine differences in age,height,mass,body mass index,and DXAzscores.We used Fischer’s exact test to determine differences in groups for footstrike pattern.We performed Kruskal-WallisHtests to determine differences in exertion run speed,time to exertion,average miles run per week,force and tibial shock data,and changes in force and tibial shock data with exertion.As main effectpvalues were significant or approaching significance for changes in force and tibial shock,we subsequently performed pairwise comparisons between groups using Dunn’s test.We determined Pearson’s correlation coefficients for run time and changes in force and tibial shock data from the beginning and end of the treadmill run.Stata 15.1(StataCorp.,College Station,TX,USA)was used for statistical analyses.
3.Results
3.1. Participant characteristics
We enrolled 45 women (26.7 ± 4.7 years) who completed this study (Table 1).On average,participants had a normal body mass index (21.6 ± 1.81 kg/m2),ran 25.5 ± 11.4 miles per week over the previous year,and had normal DXAzscores at the lumbar spine(-0.60±1.02),total hip(-0.05± 0.76),and femoral neck(-0.20±0.78).The M-BSI group averaged 4.5 ± 1.5 BSIs per participant (range: 3-7).The most common location for BSIs was the tibia,followed by the metatarsals(Table 2).Forty athletes ran with a rearfoot strike pattern,and 5 with a midfoot strike pattern.
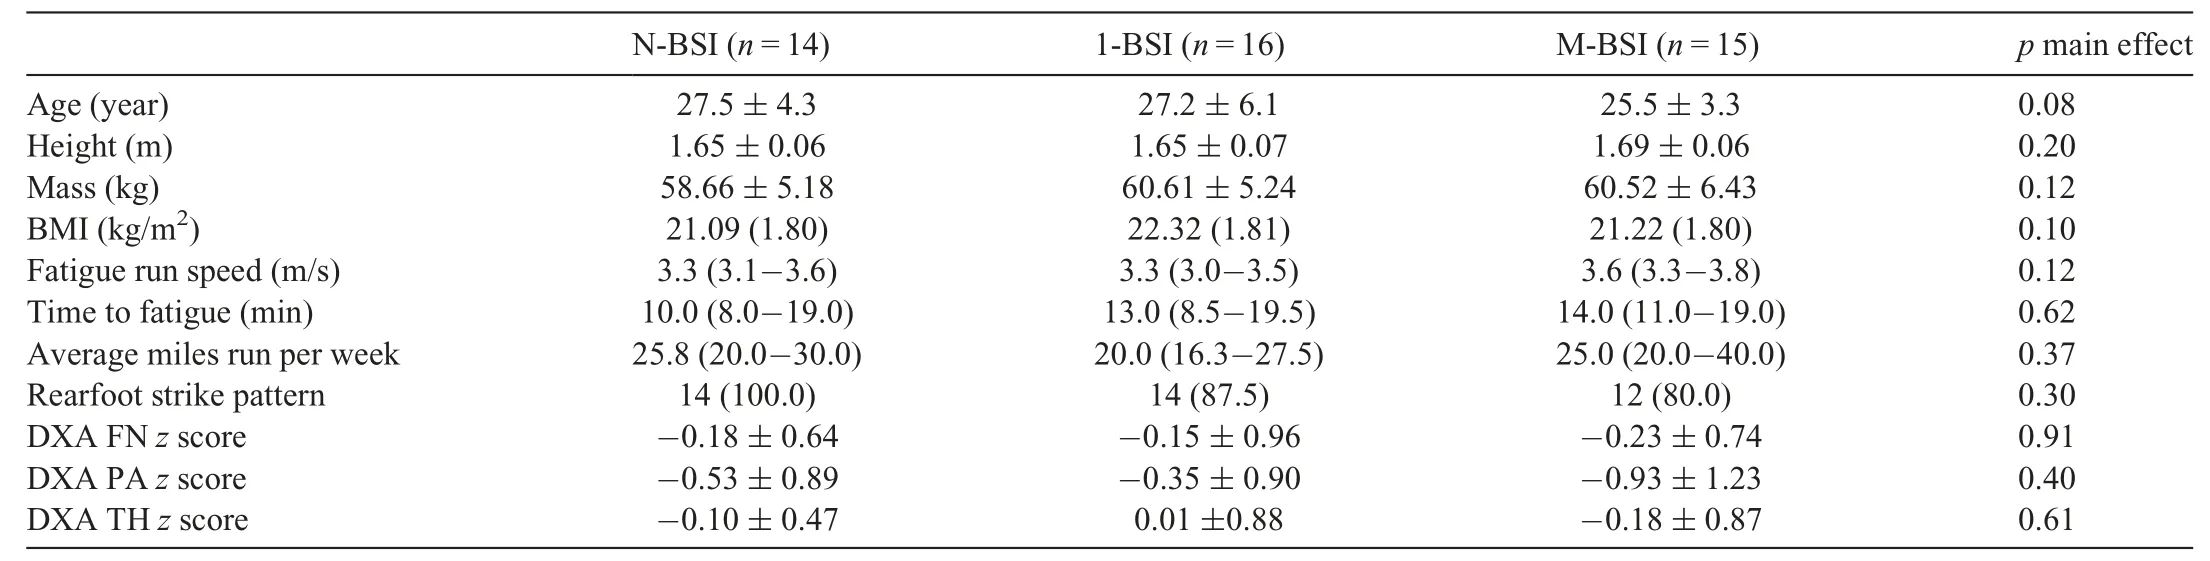
Table 1 Characteristics for participants with a history of N-BSI,1-BSI,and M-BSI.
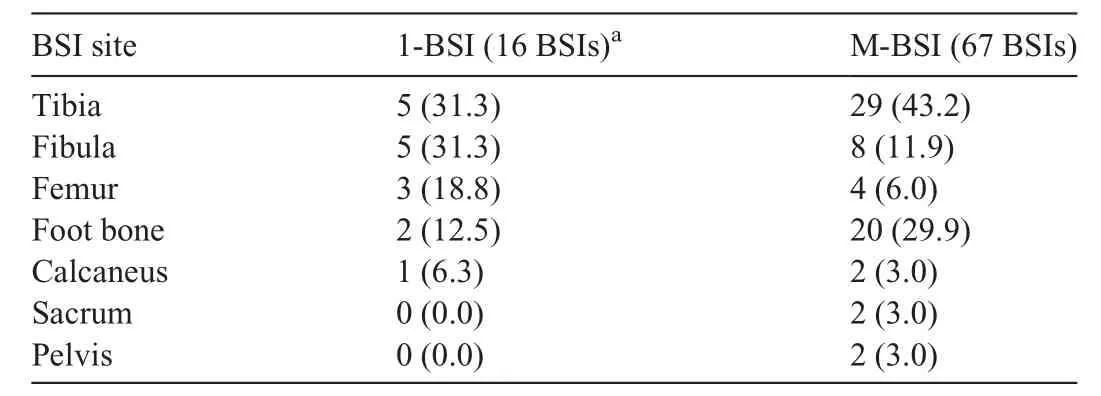
Table 2 Historical BSI locations for participants with a history of 1-BSI and M-BSI.
3.2. Fatigue run and biomechanics
Participants ran for a mean time of 14 min before reaching an RPE value ≥18 at their self-determined 5-km race speed(mean speed=3.43 m/s,min speed=2.86 m/s,max speed=4.47 m/s).There were no differences between groups in VALR,VILR,vertical stiffness,or tibial shock at selfreported 5-km race pace in either the fresh or exerted condition(Table 3).However,there were significant differences among groups in the change in VALR (p=0.048) and vertical stiffness(p=0.04)with exertion.Specifically,compared to women with N-BSI,women with M-BSI had greater increases in VALR (-1.8%vs.6.1%,p=0.01) and VILR (1.5%vs.4.8%,p=0.03) (Fig 2).A similar pattern was seen for increase in vertical stiffness among women with N-BSI compared to those with M-BSIs (-0.9%vs.7.3%,p=0.006) and 1-BSI (-0.9%vs.1.8%,p=0.05) following exertion.Compared to women with N-BSI,the increase in tibial shock from fresh to exerted condition was greater in women with M-BSIs(0.9%vs.5.5%,p=0.03) and 1-BSI (0.9%vs.11.2%,p=0.02).Finally,there were no correlations between time to exertion and changes in VALR,VILR,vertical stiffness,or tibial shock.
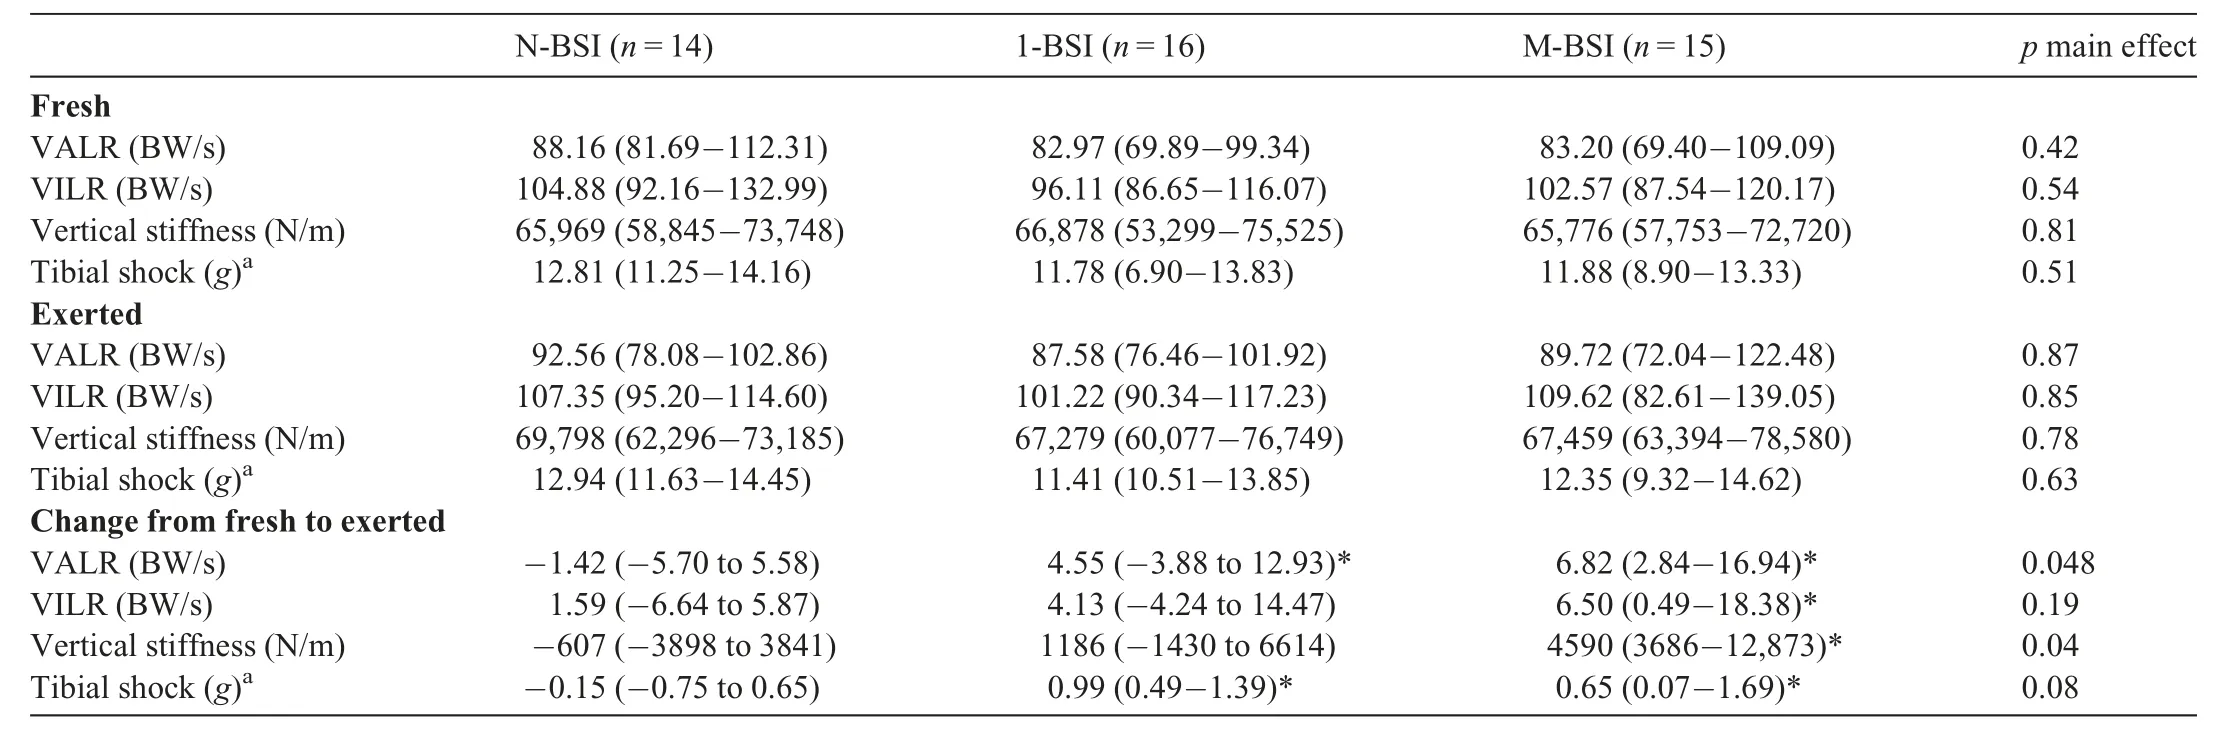
Table 3 VALR,VILR,vertical stiffness,tibial shock during fresh and exerted running,and absolute change in each variable from fresh to exerted running among participants with a history of N-BSI,1-BSI,and M-BSI.
4.Discussion
In this study,we compared impact variables at the beginning of a treadmill run to exertion and the changes in those variables with exertion among female runners with no history of BSI as well as those with a history of single or multiple BSIs.We expected the impact variables to be lowest in the runners without a history of BSIs and highest in those with 3 or more.Similarly,we expected to see a greater change in impact variables from the beginning to the end of the treadmill run in women with multiple BSIs compared to those with a history of 1 or no BSIs.
Contrary to our hypotheses,ground reaction force impact variables (VALR,VILR,and vertical stiffness) were similar during the fresh running state between the control group and those with 1-BSI or M-BSIs.Consistent with our findings,another study reported no differences in VALR,VILR,or vertical stiffness in 23 runners with prior tibial BSI when compared to 65 non-injured runners.39Our findings were in contrast,however,to other studies that noted higher impact variables in runners with a history of tibial stress fractures.23,41,42For example,Milner,et al.23reported 20%higher vertical load rates and 33%higher tibial shock in those with a history of tibial BSI during overground running at a self-selected speed.While load rates in our injured group were consistent with Milner et al.,23load rates in their control group were markedly lower than those in the controls in the present study,which accounts for their significant findings.An important distinction between the current study and the Milner study23is that the protocol in the current study was designed to fatigue participants,and the fresh condition data are at speeds beyond a self-selected comfortable pace.Furthermore,our study included individuals with BSIs sustained to both the tibia and other anatomical locations.It is possible that higher impact loading is associated with tibial BSI but not all lower extremity BSIs.
In examining impact loading at the end of the treadmill run,we hypothesized that all groups would experience increased impacts due to the reduced ability to control their landings,with the BSI groups increasing to a greater extent.Similar to the fresh state,we found no differences in any of the impact variables in the exerted state among the 3 groups.However,there was a difference in the change in impacts across the 3 groups.Whereas impact variables did not change with exertion in the N-BSI group,they did increase with exertion in the BSI groups.In particular,we saw the greatest increase in the impact variables in runners with a history of multiple lowerextremity BSIs.To the authors’ knowledge,only 1 other study43has examined ground reaction forces while running in an exerted condition in women with BSIs.Interestingly,Grimston et al.43reported higher vertical impacts and forces in their no BSI group as compared to their BSI group during early stages of a 45-min exhaustive run,with no change in the N-BSI group throughout the run.In contrast,maximum vertical forces increased in the BSI group throughout the run.While the results from Grimston et al.43align with the present study,sample sizes were low(5 BSI and 5 N-BSI),the running protocols were different,and the outcomes were not identical(vertical impact peak and maximum vertical forcevs.VALR,VILR,and vertical stiffness),making interpretation and comparison difficult.Further studies are needed to determine the underlying causes of changes in running biomechanics with exertion.As these are cross-sectional data,we cannot discern between cause and effect.Therefore,while it is possible that harder landings resulted in the BSIs,it is plausible that a history of BSIs leads to a reduced ability to attenuate loads with exertion.Future prospective work will ideally explore running biomechanics before and after BSIs and identify potential areas for intervention,such as gait retraining and/or improvements in muscle activation,strength,and endurance.
Tibial shock followed a similar pattern as load rates,with no differences noted among the groups in either the fresh or exerted states.Additionally,tibial shock did not change in the control group from the fresh to exerted state,but increased among women with multiple BSIs.The control group result agrees with the data reported by Clansey et al.,44but contrasts those presented by Derrick et al.28Both studies were conducted on cohorts of healthy male runners,but they differed in their running protocol,making comparisons to the present study difficult.Both Clansey et al.44and Derrick et al.28reported increased knee flexion at initial contact with fatigue,which resulted in lower effective mass and increased tibial accelerations.28Future work should investigate whether those with a history of BSIs present with increased knee flexion at initial contact when exerted as compared to controls.Furthermore,tibial shock has been strongly correlated to load rate in both healthy45and injured runners.36As such,it can be used as a surrogate for load rates that normally require force plates or force treadmills for measurement.Therefore,accelerometers can provide a way to measure changes in impacts in a runner’s natural environment,40perhaps allowing for a more ecologically valid measure of changes related to exertion in real world conditions.
While we know little about whether running in an exerted state influences impact variables in runners with BSI,there are a number of studies that have examined this in healthy runners.Overall,the findings from these studies have been equivocal.Some authors have reported increased impacts after localized muscle fatigue (reduced maximum voluntary contraction) or running to exertion or exhaustion,28,30-32while others have reported decreases.33-35These differences are likely related,in part,to the method of inducing fatigue or exertion.Three of these studies used longer duration running protocols at paces that correspond to <80%of oxygen uptake peak to achieve an exerted state.31,32,35In these protocols,exertion was typically reached between 30-60 min.Others used shorter higher intensity running protocols,similar to our protocol,that correspond to approximately 95% of peak oxygen uptake or graded exercise protocols,both of which are designed to elicit exertion in<20 min.28,34Some researchers have fatigued specific muscle groups and then assessed changes in kinetic and kinematic variables during running.30,46
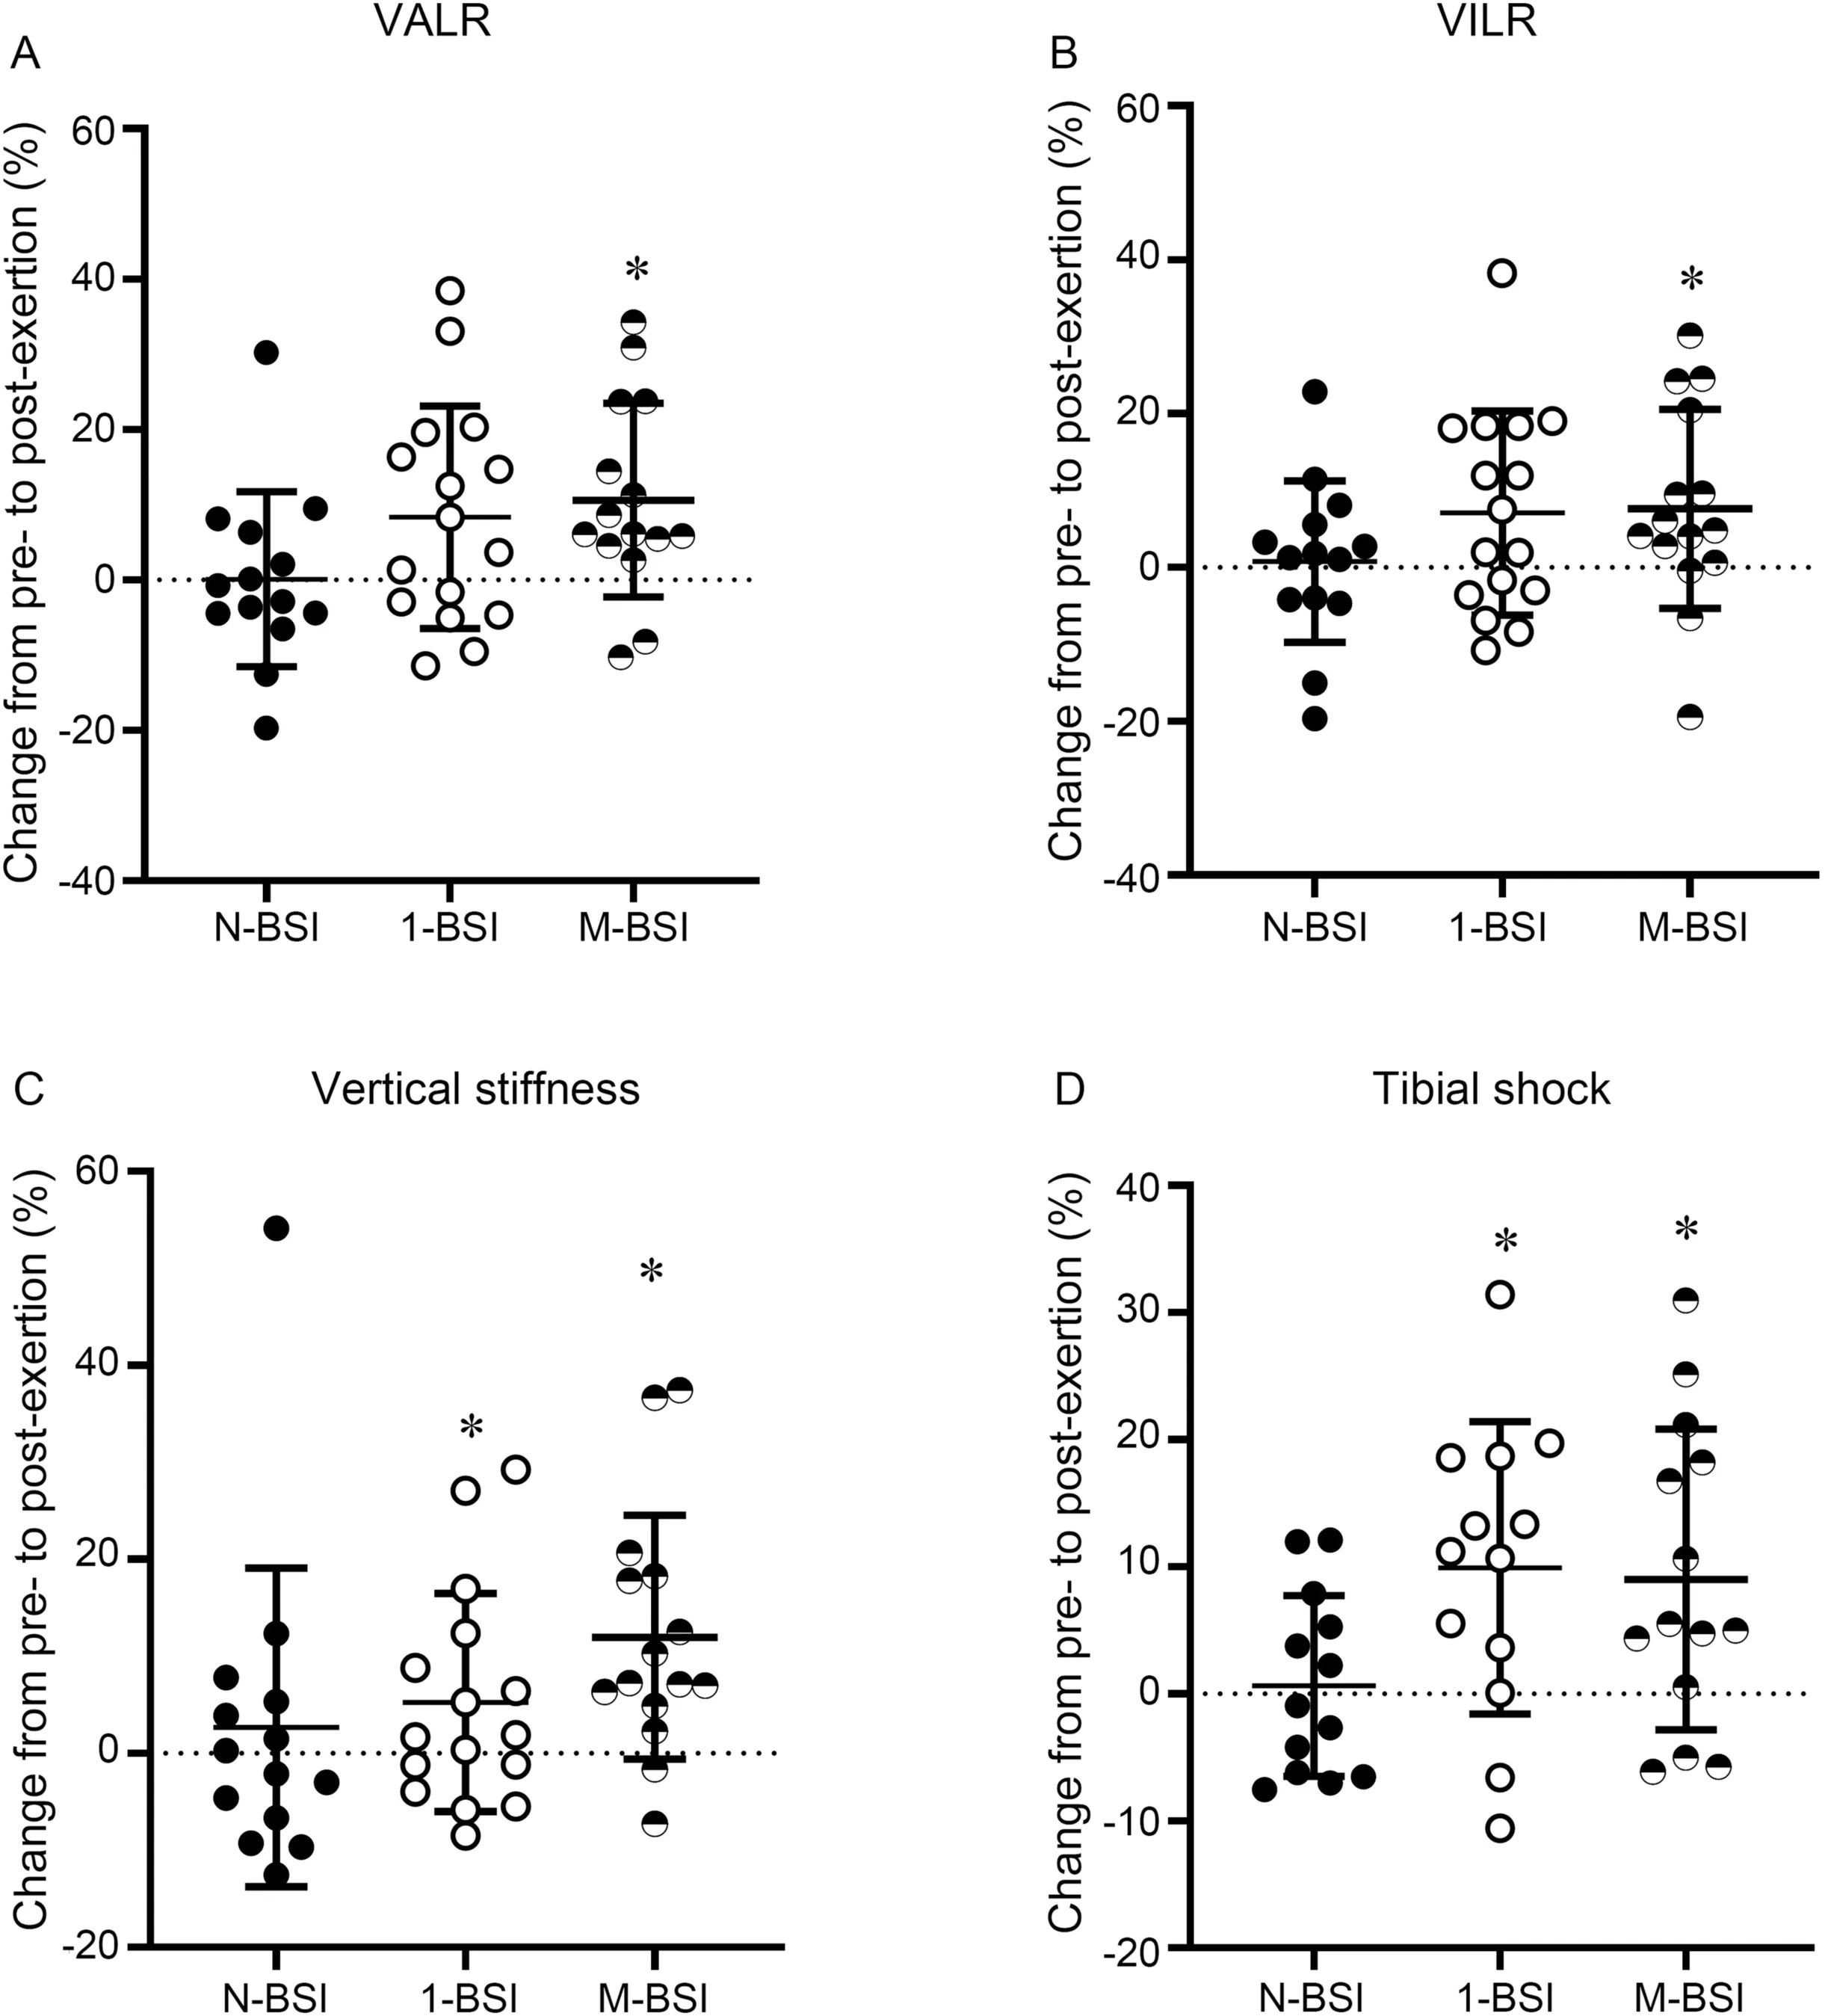
Fig.2.Percent change in(A)VALR,(B)VILR,(C)vertical stiffness,and(D)tibial shock among those with a history of N-BSI,1-BSI,and M-BSI.*p <0.05 compared to N-BSI.1-BSI=a history of 1 lower extremity BSI;BSI=bone stress injury;M-BSI=diagnosed by imaging,or a history of multiple (≥3) lower extremity BSIs;N-BSI=no history of diagnosed lower extremity BSI;VALR=vertical average loading rate;VILR=vertical instantaneous loading rate.TagedEnd
This study is not without limitations.First,the cross-sectional design does not allow us to discern whether the running biomechanics we observed existed prior to the injury and whether they were the cause or the effect of the BSI.However,given the differences seen between the 1-BSI and M-BSI groups,the greater change in impact variables experienced by the M-BSI group suggests a potential area for future intervention.Second,we determined the treadmill pace based upon a self-reported 5 km race time.Runners reached an RPE of ≥18 sooner than expected,resulting in shorter run time to exertion,though each runner still reached the desired level of perceived exertion.Finally,the state of exertion was determined using a RPE scale,which has been argued to measure a state separate from the symptom of fatigue or performance fatigability.47Despite this,previous studies investigating changes in biomechanics during exhaustive runs have used RPE,48and it likely measures a state variable of perceived fatigability that is suggested to only be measurable using self-report.49There is currently no consensus regarding the best way to elicit fatigue or exertion during running in a laboratory setting aimed at capturing biomechanical changes.This highlights the need for the development of validated fatigue or exertion protocols and measures specific to running that are linked to the performance changes we expect to observe along with the associated biomechanical changes.49
Despite our limitations,this is the first study to assess biomechanics in women with a history of multiple BSIs in both fresh and exerted conditions.Our novel investigation of the change in impact loading as a result of exertion indicates a potential area for future BSI interventions.Moreover,our combined use of accelerometers and ground reaction forces indicate an opportunity for future research to be conducted outside of a lab setting for these populations.
5.Conclusion
Our findings suggest that women with a history of BSIs experience greater changes in impact biomechanics at racelike speeds when compared to those with N-BSI.These increases in impact loading with exertion may contribute to abnormal loads on musculoskeletal tissues or to associated biomechanical changes that may result in increased risk of subsequent BSI.From a clinical standpoint,interventions to reduce biomechanical changes with exertion may be important for avoidance of future BSIs.
Acknowledgments
The opinions or assertions contained herein are the private views of the authors and are not to be construed as official or reflecting the views of the U.S.Army or the Department of Defense.Any citations of commercial organizations and trade names in this report do not constitute an official U.S.Army,Department of Defense endorsement or approval of the products or services of these organizations.This paper has been approved for public release with unlimited distribution.This research was supported in part by appointments to the Department of Defense Research Participation Program at the U.S.Army Research Institute of Environmental Medicine administered by the Oak Ridge Institute for Science and Education.We acknowledge support from the U.S.Department of Defense,Defense Health Program,and Joint Program Committee (W81XWH-16-1-0652),and the National Institutes of Health shared instrumentation grant (S10 RR023405).The results of this study are presented clearly,honestly,and without fabrication,falsification,or inappropriate data manipulation.
Authors’contributions
KLP and JO conceptualized this manuscript,performed analyses,conducted a literature search,prepared the first draft of the manuscript,and contributed to data collection;MLB and ISD conceptualized this manuscript;SG,MG,SR,and EL contributed to data collection;KEA,AST,and all other authors contributed to the study design,investigation,review,and editing process.All authors have read and approved the final version of the manuscript,and agree with the order of presentation of the authors.
Competing interests
The authors declare that they have no competing interests.
 Journal of Sport and Health Science2023年3期
- Journal of Sport and Health Science的其它文章
- Effects of contact/collision sport history on gait in early-to mid-adulthood
- Refinement of saliva microRNA biomarkers for sports-related concussion
- Are EPB41 and alpha-synuclein diagnostic biomarkers of sport-related concussion?Findings from the NCAA and Department of Defense CARE Consortium
- Factors and expectations influencing concussion disclosure within NCAA Division I athletes:A mixed methodological approach
- Association between ACTN3 R577X genotype and risk of non-contact injury in trained athletes:A systematic review
- Lacrosse-related injuries in boys and girls treated in U.S.emergency departments,2000-2016