
Overweight and obesity in young adults with patellofemoral pain:Impact on functional capacity and strength
2023-04-10 06:42AmndSchenttoFerreirBenjminMentiplyBincTord
Amnd Schentto Ferreir,Benjmin F.Mentiply,Binc Tord,
Marcella Ferraz Pazzinattoa,b,Fábio Mícolis de Azevedoa,Danilo de Oliveira Silvaa,b
a Department of Physiotherapy,School of Science and Technology,Sao Paulo State University(UNESP),Presidente Prudente,19060-900,Brazil
b La Trobe Sport and Exercise Medicine Research Centre,School of Allied Health,Human Services and Sport,La Trobe University,Melbourne,VIC 3086,Australia
Abstract Purpose: This study aimed to (a) investigate the proportion of overweight/obesity in a cohort of young adults with patellofemoral pain (PFP) and(b)explore the association of body mass index(BMI),body fat,and lean mass with functional capacity and hip and knee strength in people with PFP.Methods:We included a mixed-sex sample of young adults(18-35 years old)with PFP(n=100).Measurements for BMI,percentage of body fat,and lean mass(assessed by bioelectrical impedance)were obtained.Functional capacity was assessed by the Anterior Knee Pain Scale,plank test, and single-leg hop test. Strength of the knee extensors, knee flexors, and hip abductors was evaluated isometrically using an isokinetic dynamometer.The proportion of overweight/obesity was calculated based on BMI.The association between BMI,body fat,and lean mass and functional capacity and strength was investigated using partial correlations,followed by hierarchical regression analysis,adjusted for covariates(sex,bilateral pain,and current pain level).Results:A total of 38%of our cohort had their BMI categorized as overweight/obese.Higher BMI was associated with poor functional capacity(ΔR2=0.06-0.12,p ≤0.001)and with knee flexion strength only(ΔR2=0.04,p=0.030).Higher body fat was associated with poor functional capacity (ΔR2=0.05-0.15, p ≤0.015) and reduced strength (ΔR2=0.15-0.23, p < 0.001). Lower lean mass was associated with poor functional capacity(ΔR2=0.04-0.13,p ≤0.032)and reduced strength(ΔR2=0.29-0.31,p<0.001).Conclusion:BMI,body fat,and lean mass should be considered in the assessment and management of young people with PFP because it may be detrimental to function and strength.
Keywords: Body fat distribution;Body mass index;Patellofemoral pain syndrome;Torque
1. Introduction
Patellofemoral pain (PFP) is characterized by insidious onset of diffuse anterior knee pain, exacerbated by activities that load the patellofemoral joint (e.g., running, climbing stairs, squatting).1PFP has an estimated annual prevalence of 23% in the general population and up to 35% prevalence in sporting populations.2PFP is associated with poor quality of life, poor physical health, and poor psychological health.3-5Furthermore,there has been speculation that PFP is a precursor to patellofemoral osteoarthritis(OA).6-8
Numerous biomechanical, anatomical, and psychological factors have been linked to PFP.1,9-11Specifically, impaired knee strength is a risk factor for people with PFP,12and impaired functional capacity predicts poor outcomes for people with PFP after rehabilitation.13,14Other potential factors associated with PFP that have received less attention are body composition measures. Findings from a systematic review indicates that young adults with PFP have greater body mass index (BMI)15than pain-free controls. Greater BMI has also been reported as a clinical predictor of poor long-term outcomes in people with PFP.16Despite compelling evidence indicating that high BMI is detrimental to people with PFP,its impact on functional capacity and strength in this population has never been explored. Moreover, other measures of body composition (e.g., body fat and lean mass), which seem to provide additional and more accurate implications of overweight and obesity on an individual’s health status compared to BMI alone,17,18have also never been explored in this population.
Overweight and obesity are associated with impaired functional capacity and knee strength in people with knee OA,18-22with body fat and lean mass presenting a higher association (ΔR2=0.162 and ΔR2=0.093, respectively) with impaired functional capacity than BMI (ΔR2=0.005).18Although these findings are mostly related to the tibiofemoral joint (i.e., tibiofemoral OA), previous studies23have reported that overweight and obesity also have deleterious effects on patellofemoral OA,likely via metabolic factors(i.e.,increased leptin due to obesity has been associated with reduced patellar cartilage volume)24and/or mechanical factors (i.e., increased loading by obesity may also affect patellar cartilage and its biomechanical properties).25,26Additionally, studies have reported that a weight loss of 10% or higher led to clinically important improvements in pain, functional capacity, and knee strength in people with knee OA (both tibiofemoral and tibiofemoral plus patellofemoral OA).27-30However, as highlighted in a recent editorial,interventions targeting weight loss do not exist in the PFP literature.31The detrimental effects of overweight and obesity have been extensively explored in several other musculoskeletal conditions.18,32-34However, it remains underexplored in PFP. More research is needed to understand the impact of overweight and obesity on clinically important PFP outcomes, such as functional capacity and strength. Considering that overweight and obesity are modifiable factors, our findings could provide novel insights toward changing traditional rehabilitation of PFP.35Therefore, the aims of our study were twofold: (a) to investigate the proportion of overweight and obesity in a cohort of young adults with PFP and (b) to explore the association of BMI, body fat, and lean mass with functional capacity and knee strength in young adults with PFP.
2. Methods
This cross-sectional study was reported according to the Strengthening the Reporting of Observational Studies in Epidemiology guideline recommendations.36The study was approved by the University Ethics Committee (No.1.484.129), and each participant provided informed written consent prior to data collection.
2.1. Recruitment
Participants were recruited from the community between October 2018 and November 2019 via advertisements at universities and fitness centers and via posts on social media.Participants were between 18 and 35 years of age. Eligibility criteria were assessed by a physiotherapist (with >7 years of experience in assessing people with PFP). Eligibility criteria included (a) anterior knee pain in at least one limb provoked by at least two of the following activities: running, walking,hopping, landing, squatting, negotiating stairs, kneeling, or prolonged sitting,1(b) insidious onset of symptoms with a duration of at least 3 months,and(c)anterior knee pain in the previous month of at least 30 mm on a 100-mm visual analogue scale.37Exclusion criteria included the following:a history of patellar subluxation,a history of surgery on any lower limb joint,the presence of meniscal injury38or ligament instability,39and self-reported back, hip, ankle, or foot pain. To control for potential carry-over effects from previous treatments that might influence the outcomes assessed, those who had received acupuncture, physiotherapy, or any other treatment for PFP during the preceding 6 months were also excluded from our study. Participants were asked to refrain from taking,in the 7 days prior to data collection,any medications and to avoid participating in any type of physical activity they were unaccustomed to.
2.2. Sample size calculation
An a priori sample size calculation was performed using G*Power Statistical Power Analysis Software V3.1 (Universität Düsseldorf, Düsseldorf, Germany). In our pilot study,with data drawn from 30 participants with PFP,BMI uniquely explained 4.8%of the variance in the single-leg hop test while the covariates explained 39.0%. We chose the single-leg hop test to power our study because it presented the smallest ΔR2among all variables.We estimated that we would need at least 94 participants to detect a ΔR2of 0.048 with 80% of power and an α level of 0.05,using 4 predictor variables.
2.3. Overview of the experimental approach
A total of 100 young adults with PFP were invited to attend a one-day assessment at the Sao Paulo State University. BMI,percentages of body fat and lean mass, functional capacity(measured by the Anterior Knee Pain Scale (AKPS), plank test,and single-leg hop test),and strength measures(peak isometric knee extension,knee flexion,and hip abduction torque)were obtained. After data collection completion, the proportion of overweight and obesity in our sample (based on BMI)was calculated and described as a percentage of the entire cohort (Aim 1). Then, we used partial correlation and hierarchical regression analysis to investigate the relationship of BMI, body fat, and lean mass with functional capacity and strength in young adults with PFP (Aim 2).All analyses were adjusted for covariates (sex, bilateral pain, and current pain level) on the basis of previously reported associations40-42or plausible hypotheses. Fig. 1 shows in detail the experimental design of our study.
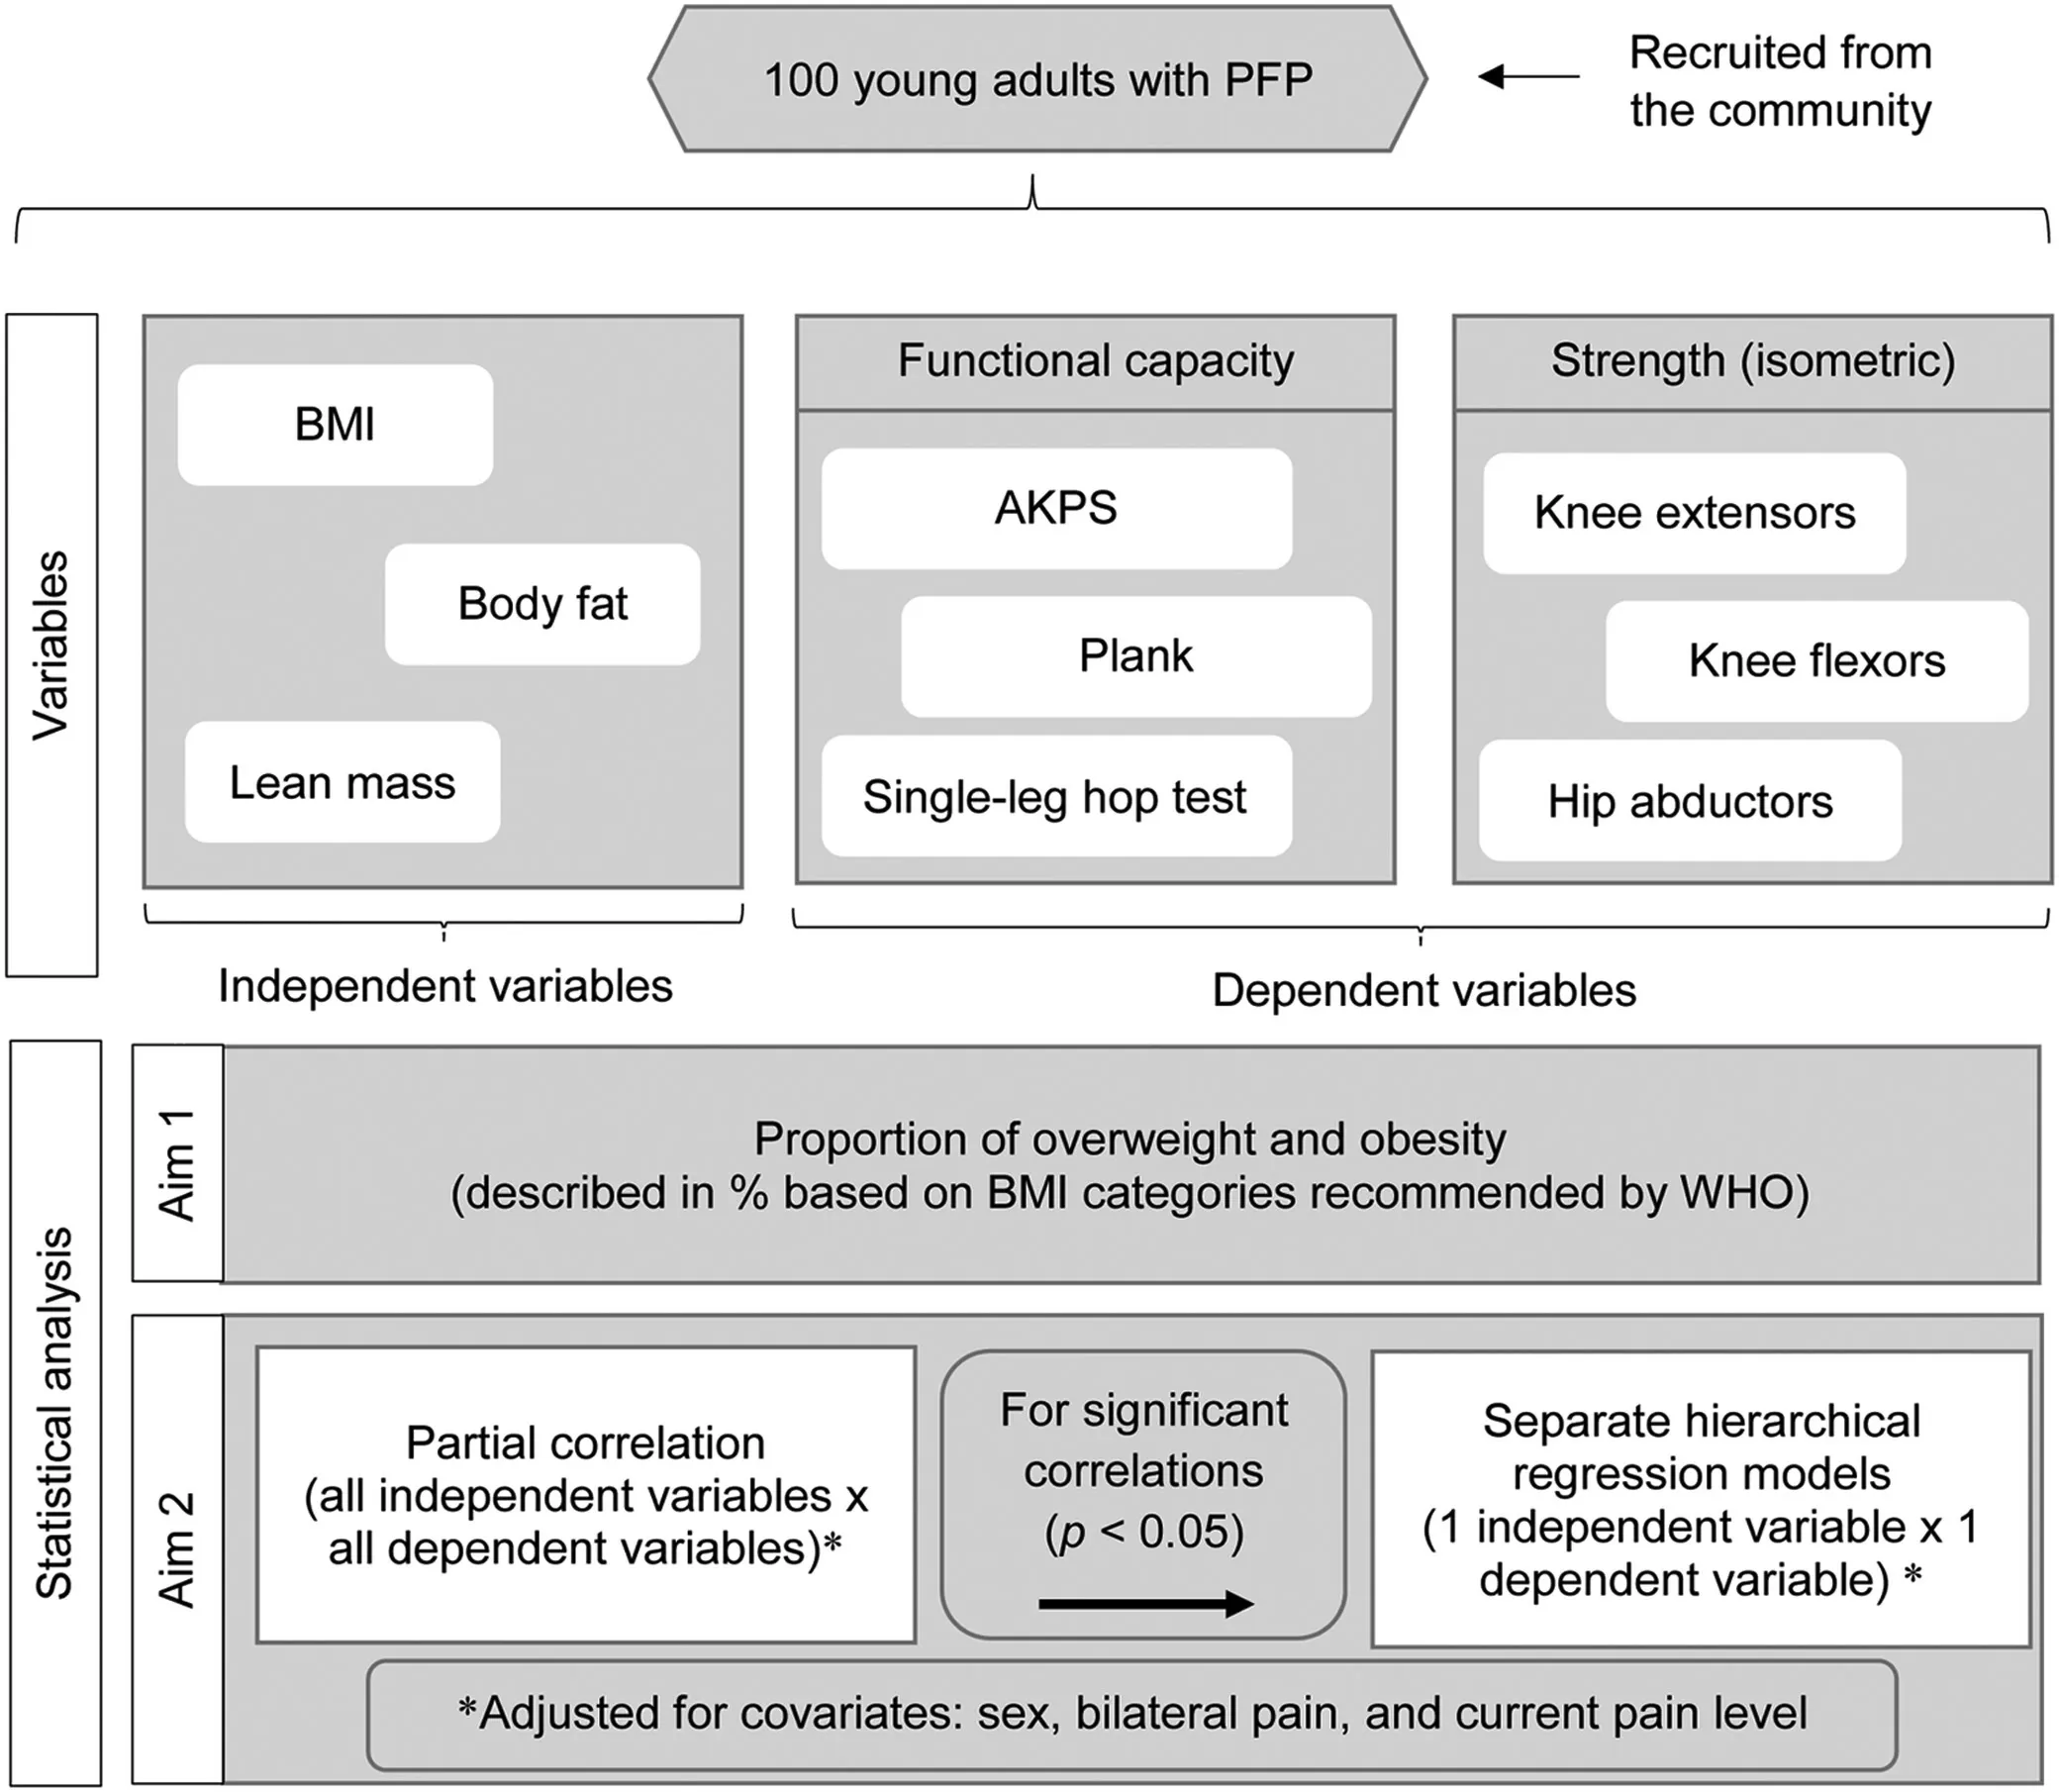
Fig. 1. Flowchart describing the experimental approach. AKPS=Anterior Knee Pain Scale; BMI=body mass index; PFP=patellofemoral pain; WHO=World Health Organization.
2.4. Participant characteristics
Demographics (age, sex, height, and body mass) were obtained,along with duration of symptoms(months)and presence of bilateral pain. Height and body mass were assessed with participants wearing light clothing and no shoes. Body mass was measured to the nearest 0.1 kg, and height was measured to the nearest 0.1 cm using a calibrated scale with a stadiometer (Welmy 110 CH; Welmy®, Sao Paulo, Brazil).Body mass and height were used to calculate BMI(kg/m2).
Before data collection, all participants rated their current knee pain intensity on a 0-100 visual analogue scale, with 0 indicating no pain and 100 indicating the worst pain possible.37
2.5. Bioelectrical impedance analysis
Body fat and lean mass were measured using a bioelectrical impedance analyzer (Omron HBF 514C; Omron Healthcare Co.,Kyoto,Japan).The device uses 8 electrodes in a tetrapolar arrangement and requires participants to stand on metal footpads in bare feet and hold a pair of electrodes fixed on the display unit, with arms extended in front of their chest. The manufacturers’valid and reliable equations43were used to predict body fat and lean mass(expressed as a percentage of total body mass). Due to the inclusion of a mixed-sex sample with wide ranges of body mass, body fat, and lean mass were reported as a percentage to facilitate the interpretation of results. Participants were instructed to avoid alcohol and caffeine consumption for 24 h prior to measurement,to avoid vigorous exercise for 12 h prior to measurement, and to avoid food and beverages for 2 h prior to measurement.
2.6. Functional capacity
Self-reported functional capacity was assessed by the AKPS. Objective functional capacity was assessed by the plank test and single-leg hop test in a randomized order. Data collection for all lower limb assessments was performed in the symptomatic leg or most symptomatic leg(in case of bilateral symptoms).5
The AKPS is a valid and reliable 13-item questionnaire used to assess functional capacity of people with PFP; the overall score ranges from 0 (maximum functional limitation)to 100(no functional limitation).37
To perform the plank test, participants assumed a prone position supported by their forearms and feet,with the shoulders and elbows flexed at 90˚.They were instructed to raise their pelvis from the floor, maintaining a straight line from head to ankles, and to hold this static position as long as possible. If necessary, verbal instructions were given to correct participants’positioning.The evaluator ended the test when participants were no longer able to maintain the proper position after 2 warnings or when the participant ended it due to fatigue.Participants performed a single trial, and the test duration was recorded with a stopwatch.44
To perform the single-leg hop test,the participant stood on the tested leg with the heel positioned on a marked line and with the other leg lifted from the floor by flexing the contralateral knee.The participants were told to hop as far as possible,keeping their arms behind their back, taking off and landing on the same foot, and maintaining their balance for about 2 s after landing. The hop distance (cm) was measured, with a measuring tape that was affixed to the floor, from the heel in the starting position to the heel in the landing position. A hop was considered successful when the participant was able to maintain balance for at least 2 s after landing.A hop was considered unsuccessful when the participant touched the floor with the contralateral lower extremity, lost balance, pushed with the contralateral foot, or did not keep the hands behind the back. Each participant was given 3 practice trials before the test. Three successive trials were then recorded. One minute of rest was provided between each trial. The average value of the 3 trials was used for statistical analysis.5
Before the strength tests were administered, participants were given a minimum of a 10-min rest after performing the functional tests (plank test and single-leg hop test) in order to avoid pain summation and limit neuromuscular fatigue. Additionally, participants were asked to perform the next test only when they felt completely recovered from the previous one.
2.7. Knee and hip strength
After functional capacity assessments, maximal voluntary isometric contractions (MVICs) of the knee extensors, knee flexors, and hip abductors were measured using an isokinetic dynamometer(Biodex System 4 Pro;Biodex Medical Systems Inc., New York, NY, USA). Knee extensor and knee flexor strength was assessed (Biodex System 4 Pro; Biodex Medical Systems Inc.) in the same seating position, with the hips and non-tested knee flexed at 90˚. Four straps were used to stabilize the trunk,pelvis,and the tested limb.The dynamometer’s rotational axis was aligned with the lateral epicondyle of the femur, and the resistance pad was placed 5 cm above the lateral malleolus. The MVICs of the knee extensors and flexors were assessed with the tested limb at 60˚of knee flexion.45
Hip abductor strength was assessed (Biodex System 4 Pro;Biodex Medical Systems Inc.) in a side-lying position, with the tested limb on top of the non-tested limb, in neutral hip flexion/extension and medial/lateral rotation alignment and with an extended knee. Four straps were used to stabilize the trunk and non-tested limb.The dynamometer’s rotational axis was aligned with the hip joint center in the frontal plane of the tested limb,and the resistance pad was placed on the lateral aspect of the distal thigh, 5 cm above the patella. MVICs for the hip abductors were assessed with the tested limb at 30˚of hip abduction.45
The testing order for the muscle groups was randomized.The assessor provided standardized verbal encouragement during contractions to elicit maximal effort. Participants performed 2 submaximal contractions of 6 s, with an interval of 30 s between trials for familiarization with each test position.Then,3 maximal isometric contractions of 6 s,with an interval of 1 min between each trial,were performed in order to determine the MVIC for each muscle group. The highest peak torque (N∙m) achieved in one of the 3 trials was used in the statistical analysis.45,46
2.8. Statistical analysis
Normality and variance homogeneity of data were tested using the Shapiro-Wilk and Levene tests, respectively. Duration of symptoms and results of the plank test were non-normally distributed; therefore, results of the plank test were log transformed before being included in the partial correlation and hierarchical regression analyses. Descriptive statistics were used to describe participant characteristics, body composition, functional capacity, and strength measures for the total sample. Descriptive statistics were also described according to BMI categories suggested by the World Health Organization (WHO). Normally distributed variables were reported as mean ± SD, and non-normally distributed variables were reported as median(interquartile range).
The first aim of our study was to determine the proportion of overweight and obesity in our sample of young adults with PFP. Overweight and obesity were defined based on the following BMI categories recommended by the WHO:47participants with a BMI of <18.5 kg/m2were categorized as underweight,18.5 kg/m2≤BMI<25 kg/m2were categorized as normal weight,25 kg/m2≤BMI<30 kg/m2were categorized as overweight, and a BMI of ≥30 kg/m2were categorized as obese.The proportion for each category was presented as a percentage of the entire cohort.No participants were underweight.
We also compared demographics and participant characteristics,body composition,functional capacity,and knee and hip strength measurements across all 3 BMI categories by running a one-way analysis of variance or a Kruskal-Wallis test.Bonferroni’s post hoc test for multiple pairwise comparisons was performed when overall differences were statistically significant (p < 0.05). Comparisons between BMI categories for bilateral pain and sex were made using x2tests, with pairwise multiple comparisons using Bonferroni correction of p values when overall differences were statistically significant (p < 0.05). These analyses are reported in Supplementary Table 1.
Our second aim was to explore the association of BMI,body fat, and lean mass with functional capacity and strength in young adults with PFP. We used partial correlation coefficients48,49to determine the relationship between independent variables(BMI,body fat,and lean mass)and dependent variables(AKPS,plank test,single-leg hop test,and peak isometric strength of the knee extensors, knee flexors, and hip abductors). All partial correlation analyses were adjusted for the following covariates: (a)sex (previous studies have found sex differences in the clinical presentation of people with PFP40,41), (b) bilateral pain (our sample included participants with unilateral and bilateral symptoms; since it may influence the outcomes, we included bilateral pain as a covariate), and(c) current pain level (PFP is characterized by intermittent pain42that may highly influence the outcomes for each participant individually). The classification of correlation was defined as small:r=0.10-0.30,moderate:r=0.31-0.50,and strong: r=0.51-1.00.49The variables that presented significant correlations (p < 0.05) were included in hierarchical regression models.
Separate hierarchical regression models were used to determine the unique association of each measure of BMI,body fat,and lean mass with each measure of functional capacity and strength that presented significant correlations. All regression models were also adjusted for covariates by first entering the covariates (sex, bilateral symptoms, and current pain level)into the hierarchical regression model (Model 1). Then,either BMI, body fat, or lean mass was added into the model(Model 2), which means that all changes in the results of the regression models, from the first step to the second step, were due to the insertion of the independent variable (either BMI,body fat,or lean mass).
An α level of 0.05 was set for all statistical tests.All analyses were performed using the PASW Statistics software(Version 18.0;SPSS Inc.,Chicago,IL,USA).
3. Results
From October 2018 to November 2019, 100 young adults with PFP (60 females and 40 males) were enrolled in our study. Descriptive statistics for all variables are presented in Table 1.
3.1. Proportion of overweight and obesity in young adults with PFP
Of the 100 participants included in our study, 62% were categorized as normal weight,24%as overweight,and 14%as obese.
3.2. Correlation coefficient findings
The partial correlation coefficients between variables of interest are reported in Table 2. Significant negative correlations were found for BMI with AKPS, plank, and single-leg hop test(r=-0.28 to-0.41,small to moderate).And a significant positive correlation was found for BMI with knee flexion strength (r=0.22, small). No significant correlations were found between BMI and knee extension and hip abductor strength.Significant negative correlations were found for body fat with AKPS, plank, single-leg hop test, and strength measures(r=-0.25 to-0.49,small to moderate).Significant positive correlations were found for lean mass with AKPS, plank,single-leg hop test, and strength measures (r=0.22 to 0.57,small to strong).
3.3. Regression models
The results of the hierarchical regression analyses are reported in Tables 3, 4, and 5. After adjusting for covariates,BMI significantly explained 6% of the variance in AKPS(p<0.001),9%of the variance in plank(p<0.001),12%of the variance in single-leg hop test (p < 0.001), and 4% of the variance in knee flexion strength(p=0.030)(Table 3).
After adjusting for covariates, body fat significantly explained 5%of the variance in AKPS(p=0.015),10%of the variance in plank (p < 0.001), 15% of the variance in singleleg hop test (p < 0.001), 18% of the variance knee extension strength (p < 0.001), 15% of the variance in knee flexion strength(p<0.001),and 23%of the variance in hip abductor strength(p<0.001)(Table 4).
After adjusting for covariates, lean mass significantly explained 4%of the variance in AKPS(p=0.032),11%of the variance in plank (p < 0.001), 13% of the variance in singleleg hop test(p<0.001),31%of the variance in knee extension strength (p < 0.001), 29% of the variance in knee flexionstrength(p<0.001),and 31%of the variance in hip abductor strength(p<0.001)(Table 5).
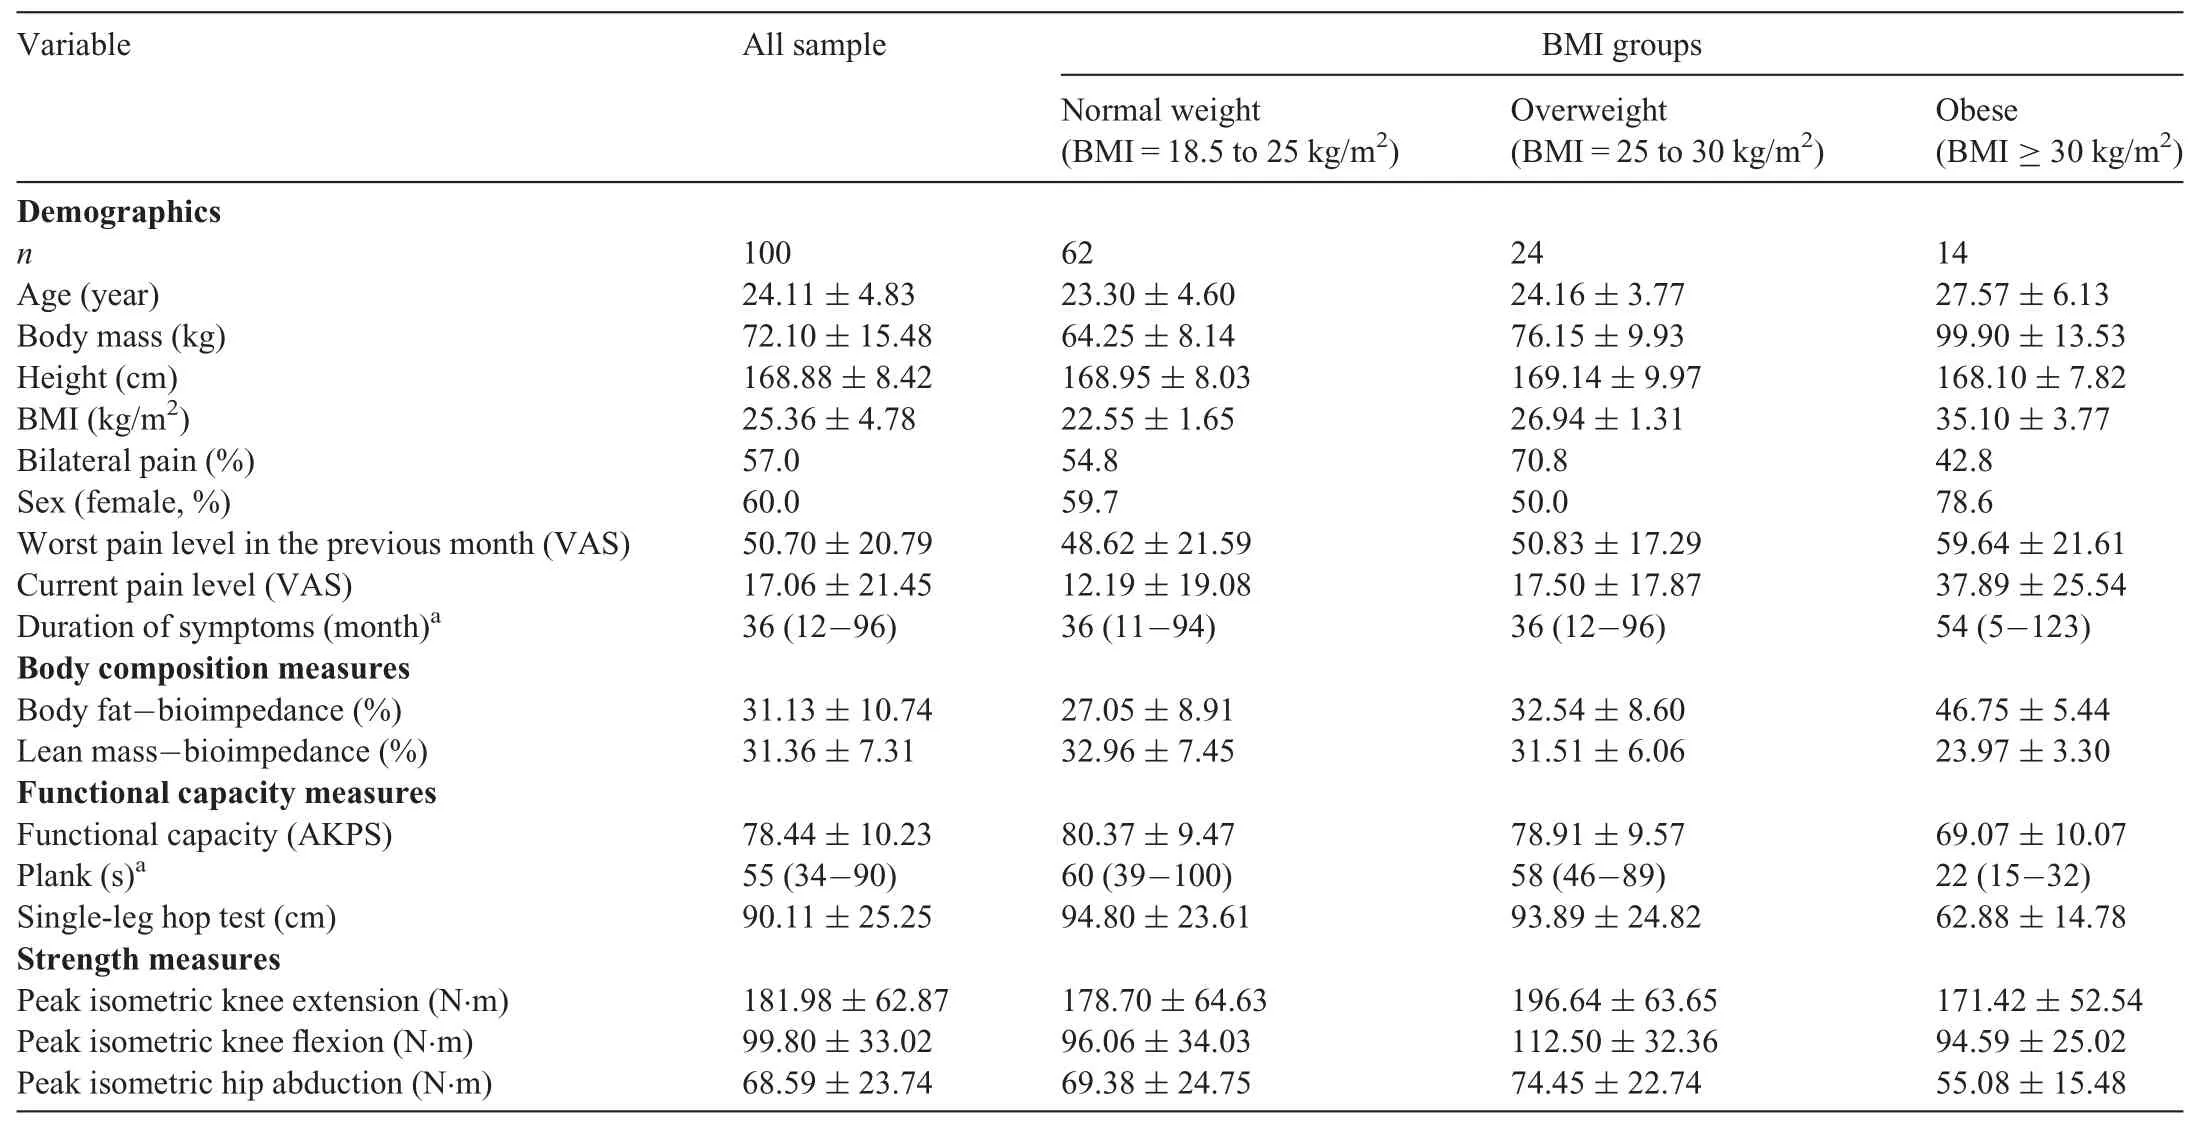
Table 1 Characteristics of study participants.
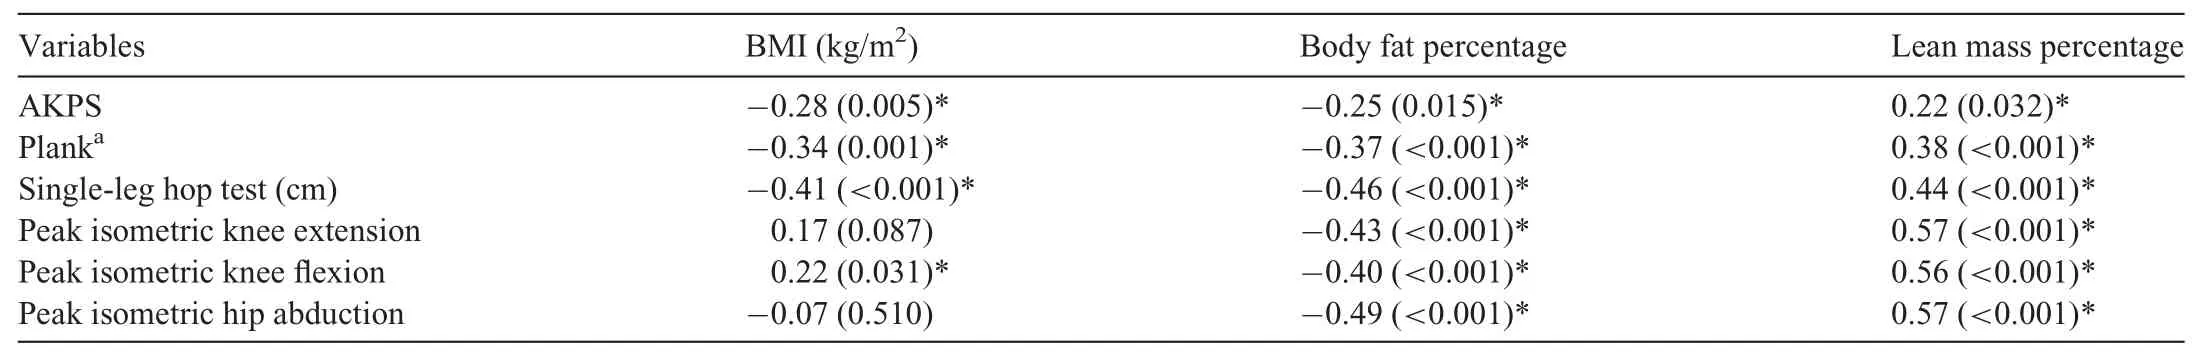
Table 2 Pearson correlation coefficients(r)among BMI,body fat percentage,lean mass percentage,functional capacity,and strength measures.
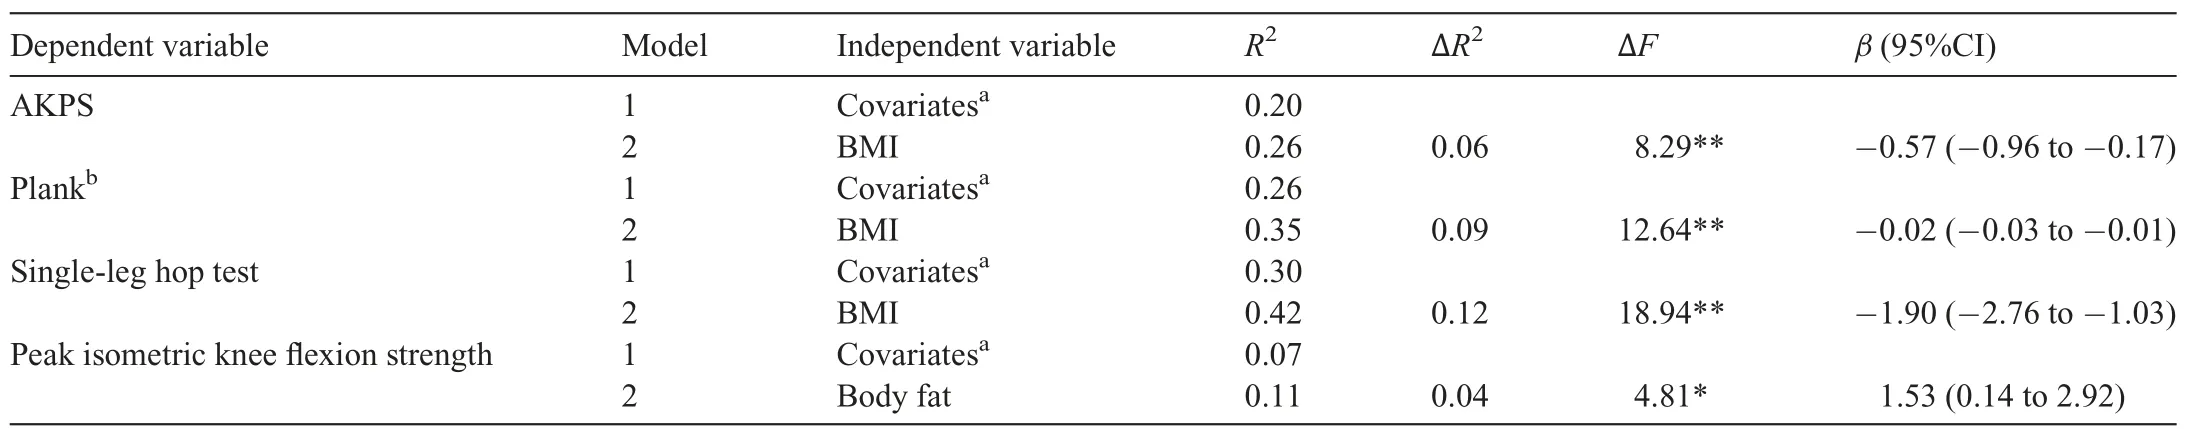
Table 3 Hierarchical linear regression between BMI and functional capacity,and knee flexion strength.
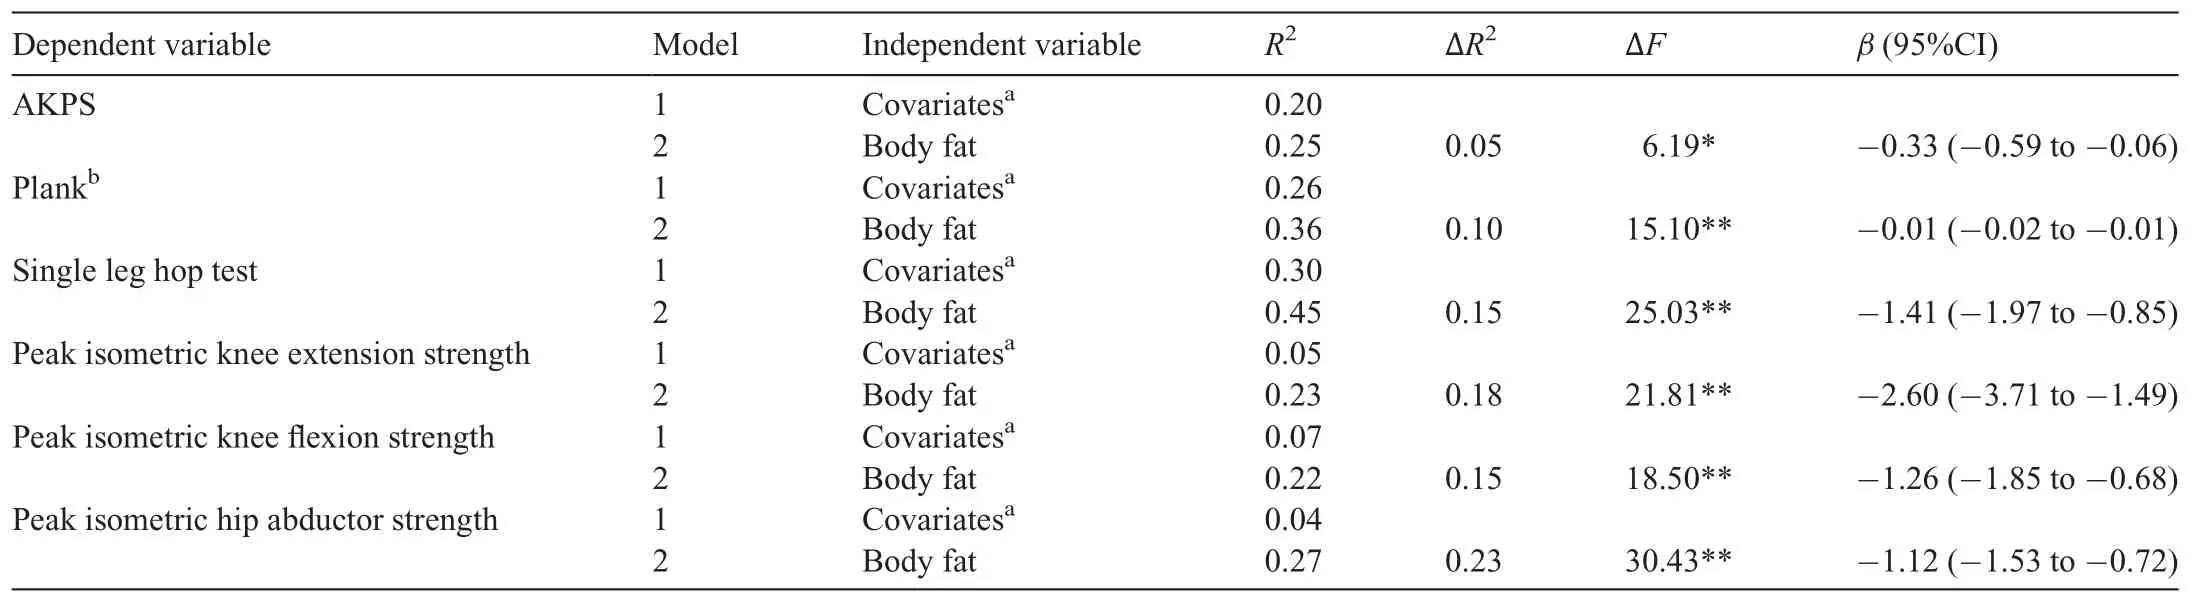
Table 4 Hierarchical linear regression between body fat and functional capacity,and strength measures.
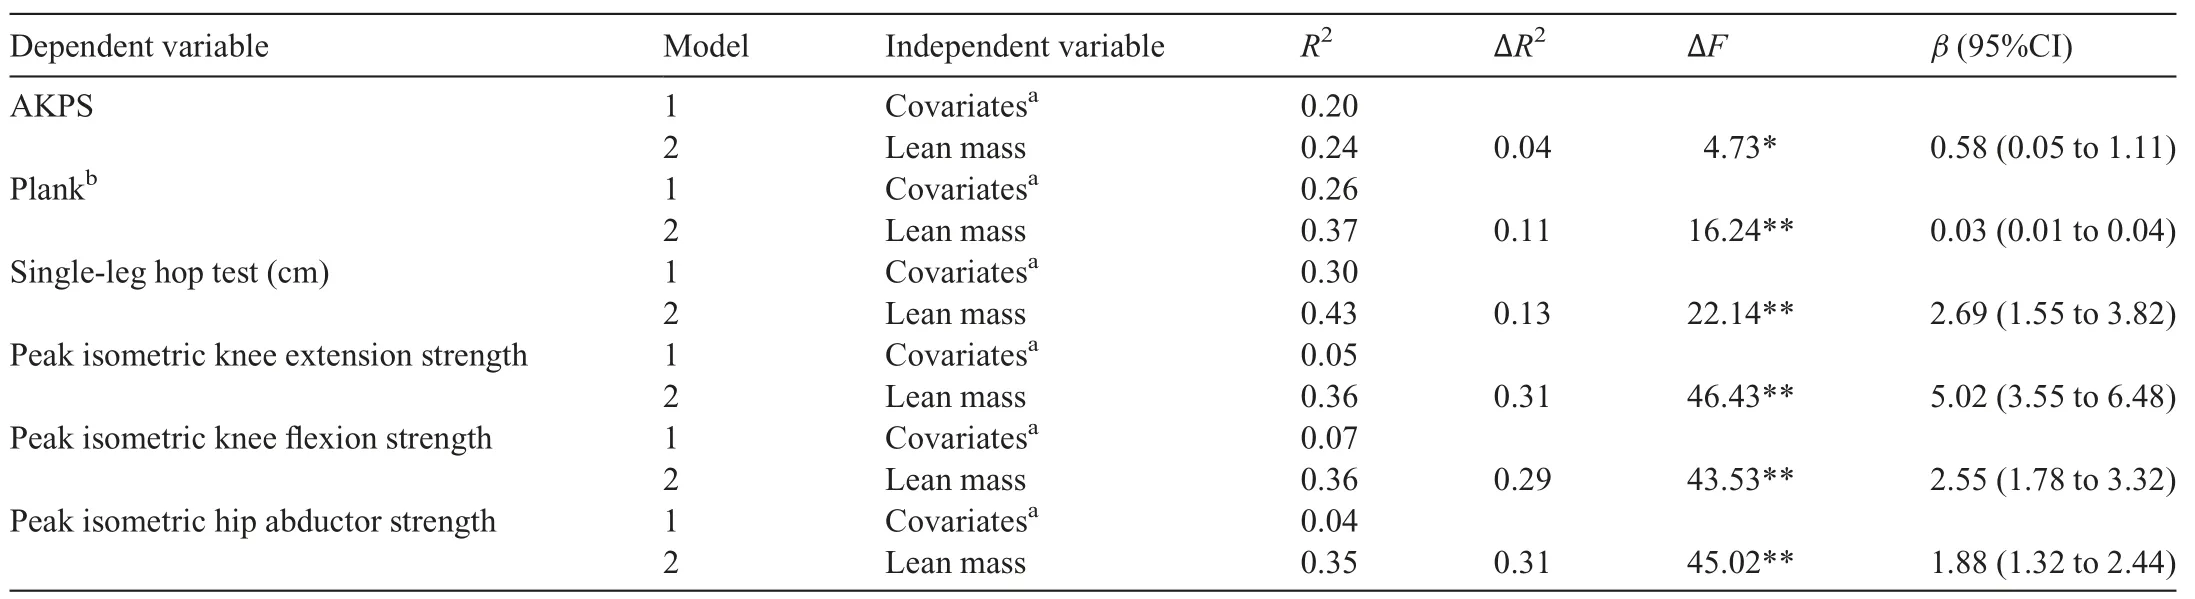
Table 5 Hierarchical linear regression between lean mass and functional capacity,and strength measures.
4. Discussion
A total of 38% of our cohort had their BMI categorized as overweight or obese.Higher BMI and body fat, and lower lean mass, were associated with poor functional capacity,even after adjusting for confounders such as sex, presence of bilateral pain, and current pain level. Additionally, higher body fat and lower lean mass, but not BMI, were associated with reduced knee and hip strength, even after adjusting for confounders. Our study provides novel data related to body fat and lean mass measures in young adults with PFP thatcan be used to further advance assessment and treatment strategies.
As noted,a BMI of ≥25 kg/m2was observed in 38%of our cohort,indicating that overweight and obesity are health problems coexisting with physical impairments5,45in a large proportion of young adults with PFP. This finding is consistent with a previous systematic review of 33 cross-sectional studies, which reported that young adults with PFP have greater BMI compared with pain-free controls.15Interestingly, evidence from 2 systematic reviews of prospective studies suggests that BMI might not be a risk factor for PFP.12,15This indicates that overweight may be a consequence of living with PFP (rather than overweight or obesity predisposing PFP),with PFP known to lead to reduced physical activity levels and psychological impairments.4,10,50However, many of the studies included in these systematic reviews12,15(six of 12 studies)investigated BMI as a risk factor for PFP in military populations. Future prospective studies are needed to confirm if higher BMI values are a risk factor for (or consequence of)PFP in other populations such as young adults, adolescents,and recreational sports population.
Our findings suggest that higher BMI, higher body fat, and lower lean mass are associated with poor subjective and objective functional capacity. Previous research in other musculoskeletal conditions assessing the relationship of BMI,body fat,and lean mass with functional capacity has yielded conflicting findings.18,19,51Davis et al.18reported an association between body fat and lean mass and objective functional capacity in older adults with knee OA.However,BMI was not associated with either subjective or objective functional capacity. Nonetheless, when people with different levels of overweight are compared, those with higher BMI reported poor subjective functional capacity in knee OA19and chronic low back pain.51These findings provide important clinical implications, given that patients with PFP reporting poor functional capacity are most likely to have poor long-term outcomes.13,14Exercise therapy targeting the hip and knee is a key recommendation of international consensus and clinical practice guidelines to improving pain and function in people with PFP.35,52,53However,a prognostic study indicated that more than half of people with PFP report unfavorable outcomes 5-8 years after being enrolled in exercise-based rehabilitation.14This suggests a need for alternative approaches that are more tailored to patient needs.31Our findings suggest that greater BMI, higher body fat,and lower lean mass are predictive of poor functional capacity and reduced knee and hip strength.Therefore,considering management approaches beyond exercise therapy that incorporate weight management may be a potential alternative to enhance long-term outcomes for patients with PFP. This approach has been reported to be successful in people with knee OA, with weight management interventions leading to improvements in pain, functional capacity, and knee strength.27-30
According to our findings, BMI was associated with knee flexion strength but not with knee extension and hip strength.A potential explanation for this finding is that BMI does not take into account specific components of body composition(i.e.,body fat and lean mass);consequently,the relative contribution of these components to muscle strength cannot be determined. Additionally, although we included sex as a covariate during statistical analysis and did not find a significant difference between BMI groups for proportion of males and females(Supplementary Table 1), the inclusion of a non-balanced mixed-sex sample across BMI categories is a limitation of our study. A previous systematic review has indicated larger hip strength deficits for female populations compared to male and mixed-sex populations, which supports the notion that males and females present different deficits and may represent distinct subgroups within PFP.40
Our novel findings indicate that higher body fat and lower lean mass are associated with reduced knee and hip strength. Overweight has been associated with alterations in skeletal muscle, such as increased lipid accumulation between (intermuscular fat) and within skeletal muscle fibers,54,55which in turn seems to affect muscular quality(muscle strength relative to unit of muscle mass) in people with knee OA.54,56,57These physiological changes in the skeletal muscle as a consequence of overweight may negatively influence knee extensor strength and physical function in people with knee OA.56,58Fat infiltration in muscle fibers could not be detected by bioelectrical impedance and therefore is a limitation of our study. Further research is warranted to explore this hypothesis.
4.1. Clinical implications
Our findings suggest that BMI, body fat, and lean mass should be considered in the assessment and management of PFP because,depending on their levels,they may be detrimental to functional capacity and particularly strength. Weight management interventions (diet only or a combination of diet plus exercise)have been reported to be effective to improving pain, functional capacity, and knee strength in people with knee OA.27-30,59Considering that 38% of our cohort were overweight or obese, weight management and advice on a healthier lifestyle60should be considered for young adults with PFP. Additionally, we found that lean mass was the best predictor of strength, explaining 31%, 29%, and 31% of the variance in knee extensor, knee flexor, and hip abductor strength, respectively, while body fat explained 18%, 15%,and 23%,respectively.These findings may suggest that developers of interventions targeting weight loss as a treatment modality for PFP need to consider the impact of the weight loss intervention on lean mass specifically. Therefore, interventions focusing on combined diet and strength training rather than diet only may be the best option for people with PFP, particularly for those categorized as obese,61,62because they seem to have the lowest knee and hip strength (Supplementary Table 1).This hypothesis should be a research priority because there has been no randomized controlled trial in PFP targeting weight loss.31
4.2. Limitations
Due to the first aim of the study (to determine the proportion of overweight/obesity in our sample of young adults with PFP),we did not create equal samples within BMI categories,which could have influenced our results regarding the second aim (to examine associations between body composition and functional capacity and strength). Due to our sample size, we chose to account for sex as a covariate within the regression model rather than stratify the cohort into subgroups. Future studies stratifying the sample based on sex are needed in order to better understand its contribution in the relationship of BMI, body fat, and lean mass with functional capacity and strength in PFP. Although we have attempted to control for some important covariates in our analyses (sex,bilateral pain,and current pain level), caution should be taken when interpreting our findings because the participants’physical activity level was not assessed in our cohort; further inquiry into the influence of physical activity level is warranted to determine whether it may serve as a potential covariate for the observed relationships. Our findings are also limited to individuals 18-35 years old.Adolescents and older populations with PFP may present different distributions of BMI, body fat,and lean mass,15,63and this requires consideration in future research.Last, we only investigated the impact of BMI, body fat, and lean mass on functional capacity and strength measures;future research should explore the impact of overweight and obesity in psychological, biomechanical, and other clinical outcomes in people with PFP.
5. Conclusion
Higher BMI,higher body fat,and lower lean mass are associated with poor functional capacity in young adults with PFP.Higher body fat and lean mass,but not BMI,were also associated with reduced knee and hip strength. These findings indicate that when managing people with PFP, assessment of BMI, body fat, and lean mass is warranted because it has an impact on clinical outcomes.
Acknowledgment
Amanda Schenatto Ferreira is supported by a PhD scholarship from Sao Paulo Research Foundation-FAPESP(scholarship No.2018/17106-0).
Authors’contributions
ASF and DdOS conceived the study’s design and carried out data collection,data analysis and interpretation,and drafting of the manuscript; BFM contributed to statistical analysis and data interpretation and helped revise the manuscript; BT participated in the design of the study and contributed to data collection; MFP participated in the design of the study and helped revise the manuscript;FMdA provided a critical review of the manuscript.All authors have read and approved the final version of the manuscript,and agree with the order of presentation of the authors.
Competing interests
The authors declare that they have no competing interests.
Supplementary materials
Supplementary materials associated with this article can be found,in the online version,at doi:10.1016/j.jshs.2020.12.002.
 Journal of Sport and Health Science2023年2期
- Journal of Sport and Health Science的其它文章
- Exercise training-induced changes in exerkine concentrations may be relevant to the metabolic control of type 2 diabetes mellitus patients:A systematic review and meta-analysis of randomized controlled trials
- Stair climbing,genetic predisposition,and the risk of incident type 2 diabetes:A large population-based prospective cohort study
- Twenty-four-hour movement guidelines during middle adolescence and their association with glucose outcomes and type 2 diabetes mellitus in adulthood
- The effects of a 20-week exercise program on blood-circulating biomarkers related to brain health in overweight or obese children:The ActiveBrains project
- Dose-dependent associations of joint aerobic and muscle-strengthening exercise with obesity:A cross-sectional study of 280,605 adults
- Chronotropic incompetence is more frequent in obese adolescents and relates to systemic inflammation and exercise intolerance