
Analysis of the breakage parameters of railway ballast based on the discrete element method
2023-03-21 08:26GanzhongLIUJiachengDAIPingWANGRongCHENHaoLIUXiankuiWEI
Gan-zhong LIU, Jia-cheng DAI, Ping WANG, Rong CHEN, Hao LIU, Xian-kui WEI
Research Article
Analysis of the breakage parameters of railway ballast based on the discrete element method

1MOE Key Laboratory of High-speed Railway Engineering, Southwest Jiaotong University, Chengdu 610031, China2School of Civil Engineering, Southwest Jiaotong University, Chengdu 610031, China3Amoy Transit Rail (AMTR), Xiamen Metro, Xiamen 361000, China4Railway Engineering Research Institute, China Academy of Railway Sciences Corporation Limited, Beijing 100081, China5Shudao Investment Group Co. Ltd., Chengdu 610031, China
During the service lives of ballasted tracks, the ballast experiences degradation, such as breakage and fragmentation, which reduces the stability of the tracks. Ballast breakage is directly related to the shapes, sizes, and stress states of particles. The key to solving this problem is to determine the breakage parameters of railway ballast. In this study, through uniaxial compression and uniaxial shear tests, the factors associated with ballast breakage for a simple stress state were obtained. Then, a refined discrete element model of railway ballast was established. The Box-Behnken method was used to design a simulation test, and a response surface method was used to obtain the optimal ballast breakage parameters. Lastly, the results of a direct shear test were compared with the simulation results to verify the correctness of the parameters and to study the shear resistance of the ballast aggregates. The results showed that for ballast particles with sizes of 22.4–63.0 mm, the characteristic stresses of compression and shear were not significantly affected by the size of the particles, but were greatly affected by their shape. In particular, long particles were more likely to break. During the direct shear test, the cumulative ballast breakage ratio gradually increased to 13.97%. The optimal breakage parameters of the ballast determined by this approach have high application value in the management of ballasted tracks.
Ballasted track; Breakage parameters; Discrete element method (DEM); Response surface
1 Introduction
Ballasted tracks are widely used in high-speed railways due to their low cost and strong vibration dampening effects, and they have become a hotspot of railway track research in recent years. A ballasted track is composed of discrete gravel particles and has poor structural stability. With the long-term loading of trains, there is repeated friction between gravel particles, causing ballast degradation, such as breakage and fragmentation, which reduces the stability of the tracks. The fragmentation of ballast has become a great challenge for maintenance and repair by railway management departments. Therefore, it is imperative to study the breakage of railway ballast due to the repeated train loads. With the development of computer technology, the discrete element method (DEM) has emerged as a powerful tool for studying the breakage of railway ballast. Lim and McDowell (2005) and Lu and McDowell (2006) established a DEM ballast model by bonding spherical elements to study the wear behavior of ballast under cyclic loading. Hossain et al. (2007) simulated ballast breakage under cyclic loading using 2D DEM in Particle Flow Code (PFC) software. Similarly, Indraratna et al. (2010) used the DEM to carry out triaxial tests of ballast under cyclic loading. Xu et al. (2019) established a refined numerical model of the Los Angeles abrasion test, which was calibrated and verified based on the results of laboratory tests. The results of the above numerical studies were generally consistent with laboratory test results, suggesting that the DEM is able to reflect the characteristics of ballast breakage.
To study ballast breakage using the DEM, three types of basic parameters are generally required: (1) intrinsic parameters, such as the density, Poisson's ratio, Young's modulus, and shear modulus; (2) contact parameters, such as the coefficient of restitution, coefficient of static friction, and coefficient of rolling friction; (3) breakage parameters, such as the normal stiffness (NS), shear stiffness (SS), critical normal strength (CNS), and critical shear strength (CSS) (DEM Solutions Ltd., 2021). The intrinsic parameters are inherent material properties, and can be obtained through basic physical experiments. Contact parameters can be obtained through parameter calibration. In the simulation of ballast breakage, the Hertz-Mindlin constitutive model with bonding (Hertz, 1881; Mindlin, 1949; Mindlin and Deresiewicz, 1953) is often used to describe the contact between ballast particles. Wang et al. (2017) used the constitutive model and proposed a ballast DEM model. The breakage rule of the contact model is controlled by four parameters: NS, SS, CNS, and CSS. The NS and SS characterize the ability of particles to deform under a load (Itasca Consulting Group Inc., 2014). The CNS and CSS characterize the critical strength at breakage (Jaeger, 1967). The accurate measurement of the four breakage parameters is a popular topic in railway ballast research.
Extensive studies have been carried out on the ballast breakage parameters. Ballast is generally composed of basalt and high-quality granite. Due to the effects of factors such as the material and the production process, the breakage parameters vary and are often difficult to obtain directly. This causes great difficulties for the study of the degradation of ballasted beds. Nicot et al. (2013) and de Bono and McDowell (2016) carried out theoretical studies of particle mechanics and found that the average stress of the particles could better describe the ballast breakage state. Lim et al. (2004) and Lim and McDowell (2005) carried out a static compression test and a numerical simulation of ballast with different particle sizes. They calibrated the static breakage parameters of the ballast based on the Weibull probability distribution of the characteristic strength.
In engineering practice, the stress state of ballast varies with the loading conditions and particle morphology. It is difficult to analyze the stress state of the ballast accurately. Therefore, conventional tests are carried out to explore the factors influencing ballast breaking strength, and then a macroscopic analysis of the ballast breakage characteristics is performed. Cho et al. (2006) analyzed the effects of the sizes and shapes of soil particles on packing density, stiffness, and strength. The results suggested that to characterize the mechanical parameters of the particles, the particle shape needed to be properly characterized. Zhao and Zhou (2017) carried out a triaxial compression test and found that particle asphericity enhanced the particle-particle inter-locking, with higher locked-in forces, which improved the shear resistance of ballast aggregates. Jing et al. (2020) compared the influence of the breakage of normal, long, and flat ballast particles on the direct shear properties of railway ballast. The results showed that long and flat ballast particles were prone to breakage during a direct shear test, and the breakage mode was an overall fracture with sharp broken corners. The above studies demonstrated that ballast breakage is related to the shapes and sizes of the ballast particles. Because ballast breakage is dependent on the breakage parameters and the actual stress state, it is necessary to consider the influence of the ballast particle shapes and sizes on the stress state of the ballast when analyzing the discrete element parameters. Kraśkiewicz et al. (2020, 2022) carried out a large amount of research aimed at reducing ballast breakage. The results showed that the use of under-ballast mats (UBM) and under-sleeper pads (USP) effectively reduced ballast breakage. Additionally, the recently emerged intelligent monitoring technology for railway tracks (Gao et al., 2020, 2021; Liu GZ et al., 2021) represents a future direction for slowing down the degradation of a ballast bed.
The response surface method (RSM) was proposed by Box and Wilson (1951). In this method, based on data obtained with a limited number of tests, the optimal parameter combination is obtained by fitting a multiple high-order regression equation. This method is a useful statistical method for solving the problem of ballast parameter selection. Yoon (2007) used the RSM to study the sensitivity of micro-parameters to the uniaxial compression breaking strength, Young's modulus, and Poisson's ratio. The results were consistent with laboratory test results in terms of both the quantitative and qualitative aspects.
Xiao et al. (2019) studied the contact parameters of ballast using the RSM. These parameters could be used in DEM simulations of railway ballast and to provide reference values for the study of the ballast breakage parameters.
In this study, premium-grade ballast particles were screened and subjected to compressive tests to determine the factors influencing ballast breakage. Then, the ballast profiles were obtained with a 3D scanner, and a refined DEM ballast model was established, the effectiveness of which was then verified. Next, the RSM was used to optimize the ballast breakage parameters. Lastly, a direct shear test was carried out to verify the feasibility of the breakage parameters and to analyze the shear properties of the ballast aggregates, thereby providing a reference for the study of the deterioration of ballasted tracks. Given that there were many parameters in this study, to avoid confusion, the parameters and corresponding classifications are listed in Table 1.
2 Laboratory ballast uniaxial breakage test
2.1 Test materials
To determine the influence of particle size and shape on breakage, a ballast sheet gauge tester (NRA, 2018) was used to divide the ballast into three types: normal, long, and flat. Referring to the European Standard (2013) and the Chinese standard for special-grade ballast (NRA, 2018), the particle shapes were classified according to the particle size distribution range (Table 2).
2.2 Test method
Uniaxial compression and shear tests are standard methods for measuring the compressive and shear properties of ballast (Nakata et al., 1999; Masson and Martinez, 2001). In this study, a uniaxial compression and shear test device was designed, as shown in Fig. 1.
In the uniaxial compression test, the ballast was placed on the test platform with the largest surface facing the platform, and jack (1) was used to pressurize the samples uniformly at a speed of 1 mm/s until the ballast was crushed (Fig. 1a). In the uniaxial shear test, the ballast was placed on the platform with the largest surface on the edge of the platform. First, jack (1) was slightly pressurized to clamp the ballast, and then jack (2) was used to apply pressure at 1 mm/s until shear failure occurred (Fig. 1b).
During the uniaxial compression and shear tests, a camera was used to take pictures of the ballast at regular intervals. With the pressure sensor at the top of the jack, the stress of the ballast could be monitored in real time, and thus a pressure-displacement curve was obtained.
2.3 Analysis of test results
Due to many factors affecting the test results, the breaking strength of the ballast could not easily be calculated. To analyze this problem scientifically, the ballast was regarded as an isotropic continuous homogeneous medium.
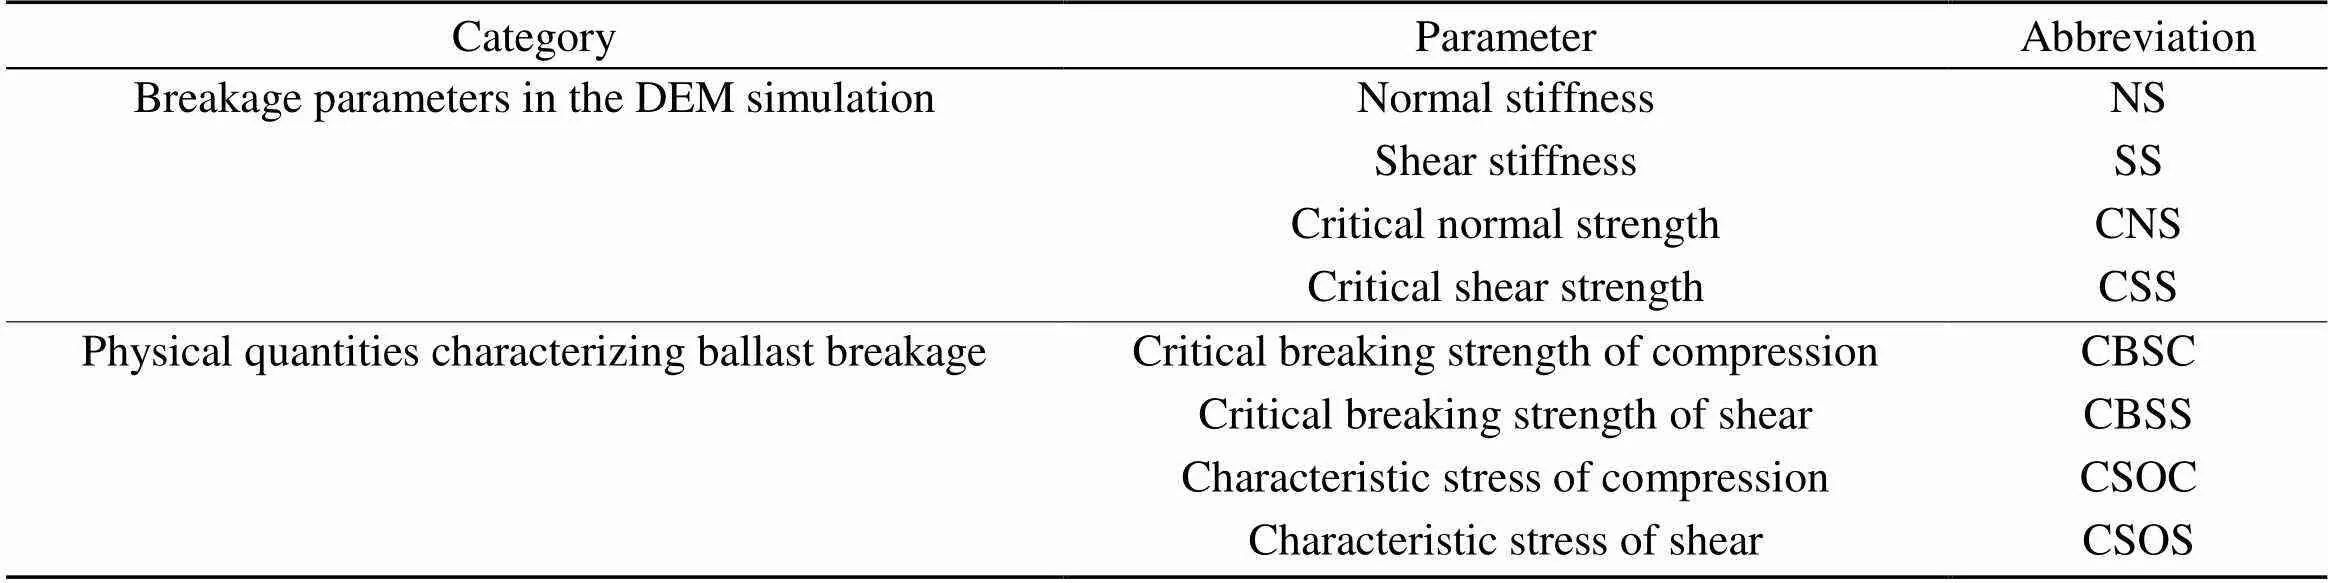
Table 1 Classification of parameters

Table 2 Quantity of ballast particles
Long-shape ballasts refer to ballasts whose length>1.8 times the average particle size; flat-shape ballasts refer to ballasts whose thickness<0.6 times average particle size; normal-shape ballasts refer to ballasts whose shape between long ballast and flat ballast
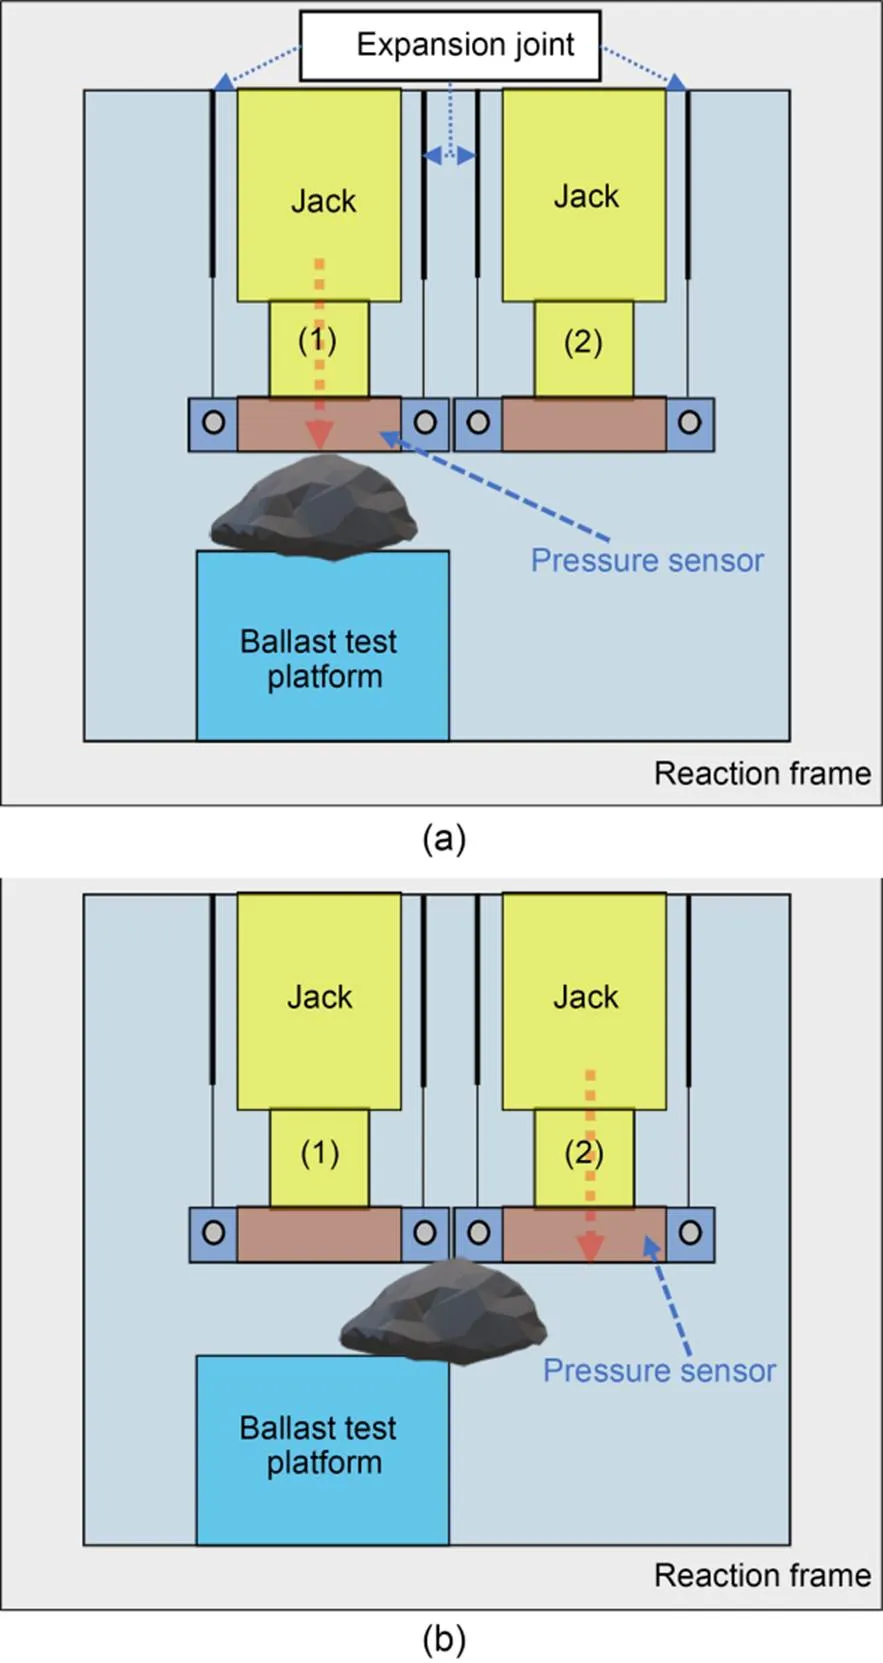
Fig. 1 Schematic diagram of the breakage test: (a) compression test; (b) shear test
According to Hiramatsu and Oka (1966), the breaking strength of an irregular rock particle is approximately expressed as:
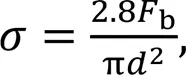
whereis the compression or shear stress when the particle is broken,bis the load at the time of breakage, andis the particle size.
To avoid error caused by the discreteness of the breaking strength of the particles, it is necessary to introduce statistical methods to analyze the relationship between the breaking strength of the ballast and the particle size and shape. Lim et al. (2004) showed that the ballast breaking strength followed a Weibull pro bability distribution. The probabilitysof a particle not being broken is
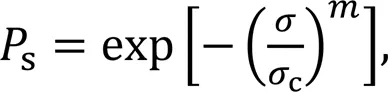
and taking the logarithm of both sides of Eq. (2) yields the following:
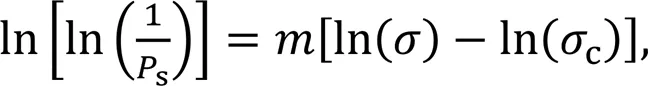
where the slopeis the Weibull distribution coefficient. The larger the range of the particle breaking strength, i.e., the larger the variability, the smaller the value of.cis the CSOC or CSOS, that is, the stress when the probability in Eq. (2) is 37% (Lim et al., 2004).
The test showed that the characteristic stresscchanged with the particle size and shape (Fig. 2).
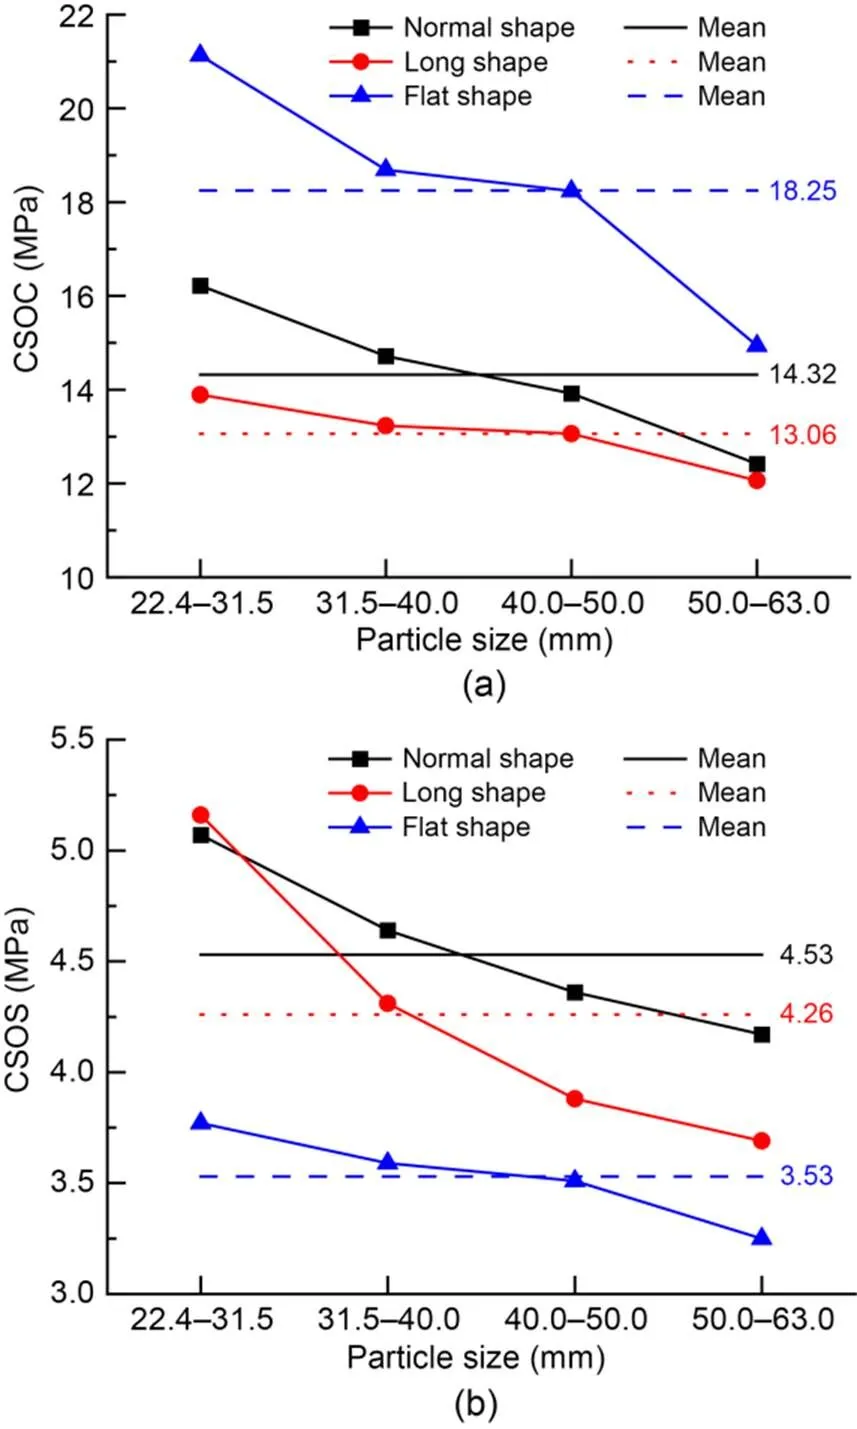
Fig. 2 Weibull characteristic stresses: (a) compression test; (b) shear test
The CSOC and CSOS of the ballast decreased slowly with the increase in particle size. Moreover, the CSOC and CSOS of ballast particles with different shapes were very different. The order of the CSOC values was flat particles>normal particles>long particles. When the particle size range was 22.4–31.5 mm, the order of the CSOS values was long particles>normal particles>flat particles, while in other particle size ranges, the order was normal particles>long particles>flat particles.
The mean values, standard deviations, and relative errors of the characteristic stresses for the ballast particles with different shapes were calculated (Table 3).
The standard deviations of the CSOC and CSOS of the particles with the same shape but different sizes were less than 5 MPa, and the relative errors were less than 8%, suggesting that the CSOC and CSOS were not significantly affected by the particle size. Based on Fig. 2 and Table 3, the characteristic stresses of the particles of different shapes were significantly different.
In summary, for ballast particles with a size range of 22.4–63.0 mm, the CSOC and CSOS were not greatly affected by the particle size, but were greatly affected by their shapes. This conclusion is in line with the assumption that the single ballast was an isotropic continuous homogeneous medium. The mean values of the CSOC and CSOS of normal, long, and flat particles were used to represent the characteristic stresses of each shape.
3 Refined DEM modeling of railway ballast
3.1 DEM constitutive model of railway ballast
In the Hertz-Mindlin contact model with bonding, the discrete spheres that make up the ballast particles are bonded together. When they are subjected to excessive external loads, the bonds are fractured, which is characterized by ballast breakage (Fig. 3).
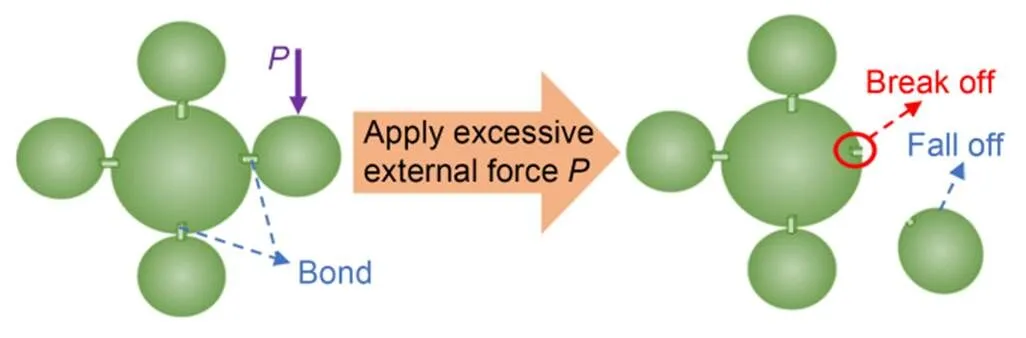
Fig. 3 Schematic diagram of the bond fracture
The mechanical principle of the bond fracture is shown in Fig. 3 and follows the documentation of EDEM software (DEM Solutions Ltd., 2021). After the spheres are bonded,nandt, which represent the normal force and tangential force, respectively, andnandt, which represent the normal moment and tangential moment, respectively, of the spheres are gradually adjusted at each time step:
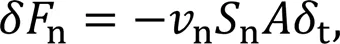
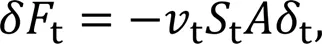
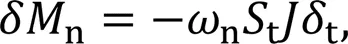
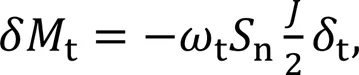
whereis the number of integration steps,nandtare the normal velocity and the shear velocity, respectively;nandtare the NS and the SS, respectively;tis the time step;nandtare the normal and shear angular velocities, respectively;Bis the bond radius.
In the iterative process, if the normal stress (Bond) and the shear stress (Bond) exceed the maximum allowable values (max,max), the bond breaks immediately, i.e.,
According to Eqs. (4)–(11), when the Hertz-Mindlin contact model with bonding is used for ballast breakage simulations, four breakage parameters need to be calibrated, i.e. the NS, SS, CNS, and CSS.

Table 3 Test results
Since the breakage of the ballast particles is characterized by the fracture of the bond, it can be seen from the above analysis that the strength of each bond for the same material must be the same. Therefore, the DEM simulation of ballast breakage still conforms to the assumption that a single ballast is an isotropic continuous homogeneous medium, which is consistent with Section 2.3.
The intrinsic parameters (such as Poisson's ratio, density, and Young's modulus) and contact parameters (such as the coefficient of restitution, coefficient of static friction, and coefficient of rolling friction) required in a DEM simulation can be obtained by referring to a previous study (Xiao et al., 2019).
3.2 Refined DEM modeling of ballast breakage
A binocular 3D scanner was used to obtain the 3D morphology of the ballast, which was then meshed with a tetrahedral mesh, and the coordinates of the nodes were obtained. Then, using the C programming language, the center and the radius of the inscribed sphere of each node were obtained. The number of spheres that filled the profile was determined by the number of mesh elements. Since the ballast had an irre gular profile, the mesh size varied, and the spheres were not the same. Even for the same ballast profile, the number of spheres was different when different algorithms were used. Theoretically, when the number of meshes is greater, that is, when the number of spheres in the cluster is greater, the actual ballast can be simulated more accurately. However, when the number of meshes is too large, the computational efficiency will be greatly reduced. According to Lim and McDowell (2005), when the number of spheres is greater than eight, the DEM model has high accuracy. To fully characterize the morphology and the mechanical properties of the ballast, the number of mesh elements in this study was set to about 20, which was considered sufficient and "wide" enough to embrace a variety of ballast shapes (Liu H et al., 2021). An inscribed sphere was placed at the center point of each node, and the spheres were bonded (Fig. 4).
Next, the effectiveness of the ballast model was verified via a laboratory test and a simulation.
3.3 Verification of ballast DEM model
During the simulation, since the ballast breakage parameters were not calibrated, the NS and SS of the ballast were both set to 125 kN/mm, the CNS was 10 MPa, and the CSS was 1 MPa. The test method described in Section 2.2 was adopted in the DEM simulation. With the ballast compression test of the normal shape as an example, Fig. 5 shows the laboratory test and simulation results.
Fig. 6 shows the force–displacement curves of the compression and shear tests of normal particles.
Fig. 6 shows that the forces of both the laboratory and the simulation tests first fluctuated and increased, reaching their peaks when the displacement was 1.00 mm in the compression test and 0.81 mm in the shear test. At the peak point, the ballast broke, then the stress of the ballast decreased significantly. The curves of the laboratory test and the simulation were highly consistent, yet the values were different, which was mainly because the breakage parameters were not calibrated in the simulation.
The above results indicated that the refined DEM model of the ballast in this study was able to reflect the breakage behavior of the ballast and could be used for engineering calculations after the parameters were calibrated.
4 Analysis of breakage parameters based on RSM
Through the reasonable selection of the test points and iterative strategy, the RSM can ensure that the failure probability of the polynomial function converges to the failure probability of the true implicit limit state function (Khuri and Mukhopadhyay, 2010), thereby effectively solving the incidental error caused by a single test.
Fig. 4 Flow chart of discrete element modeling
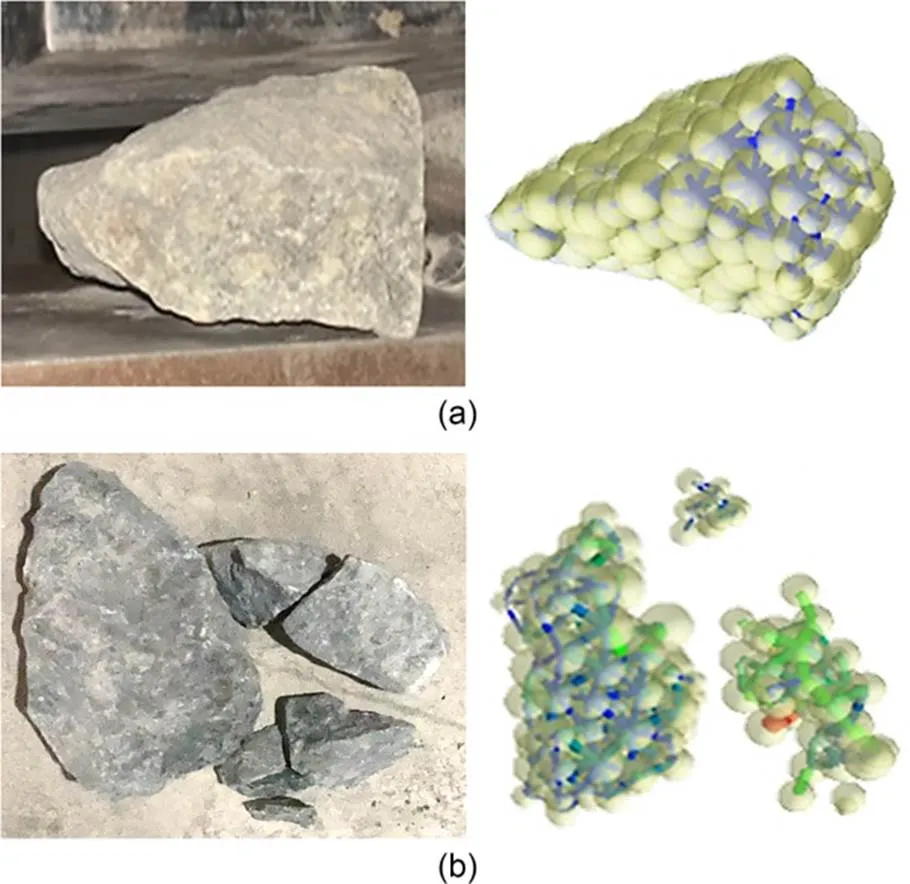
Fig. 5 Laboratory test and simulation test: (a) before compression breakage; (b) after compression breakage
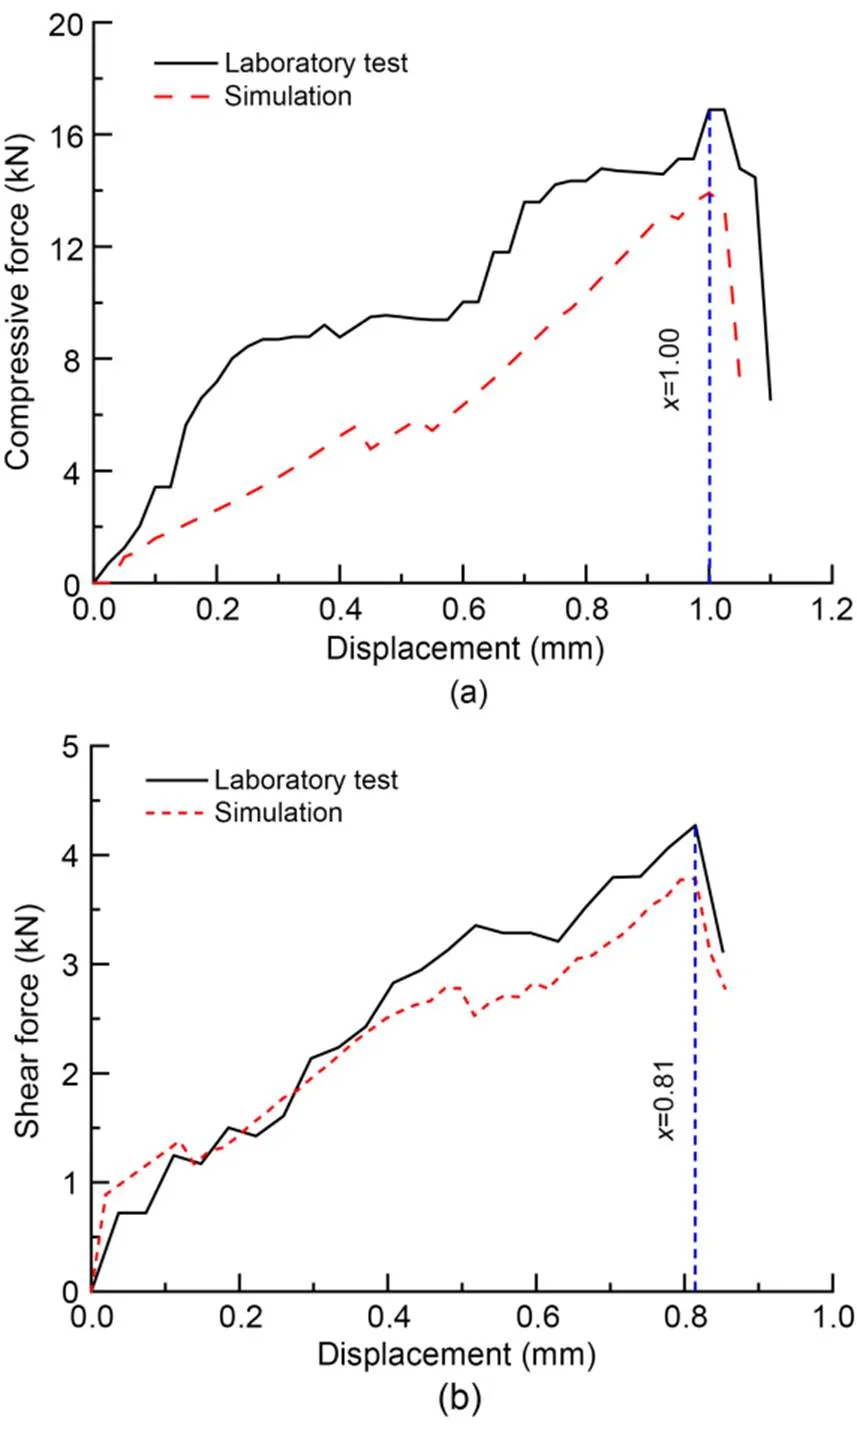
Fig. 6 Results of laboratory and simulation tests: (a) uniaxial compression tests; (b) uniaxial shear tests
The Box-Behnken method is generally used to design the test conditions (Ferreira et al., 2007). In this study, for the Box-Behnken method, rather than placing all the factors in a high-level combination, three levels (high, medium, and low) were used for each parameter, and the method could be used to evalu ate the nonlinear effects of three to seven factors. Because only the central point was used to design the test conditions for the Box-Behnken method, without adding an axial point, the designed conditions were representative. Next, we used this method to study the ballast breakage parameters of the DEM model (Fig. 7).
First, the parameters to be optimized were divided into groups according to the Box-Behnken method and their range. Then, the response value of each group of tests was constructed as a response surface model using a polynomial function. Lastly, the acquired parameters were further optimized based on the laboratory test results.
4.1 Determination of the parameter value range and test conditions
According to previous studies (Goodman, 1995; Luo et al., 2012; You, 2014), the ranges of the CNS, CSS, NS, and SS of the ballast were set as shown in Table 4.
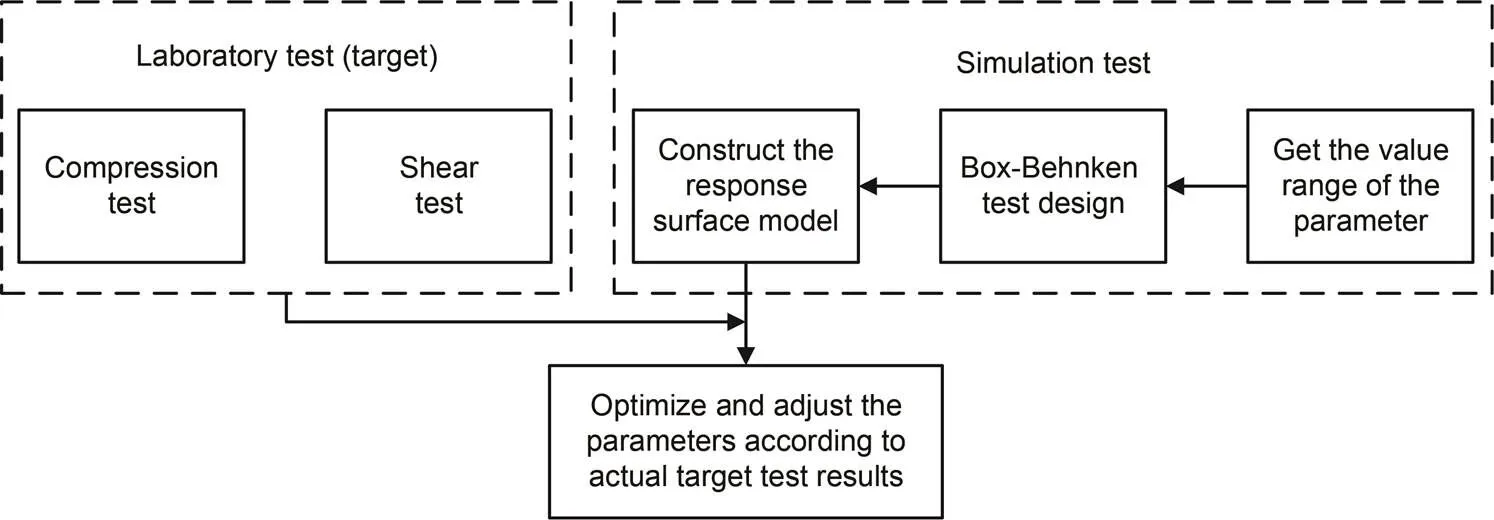
Fig. 7 Flow chart of the RSM
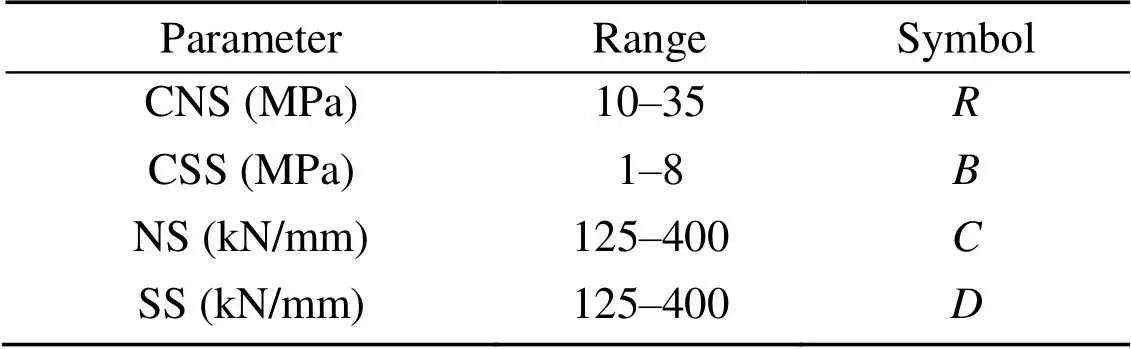
Table 4 Ranges of the ballast breakage parameters
According to the Box-Behnken method, one central point was selected for evaluation. The test conditions of the breakage parameters,,, andat the three levels of high (1), medium (0), and low (-1) are shown in Table 5.
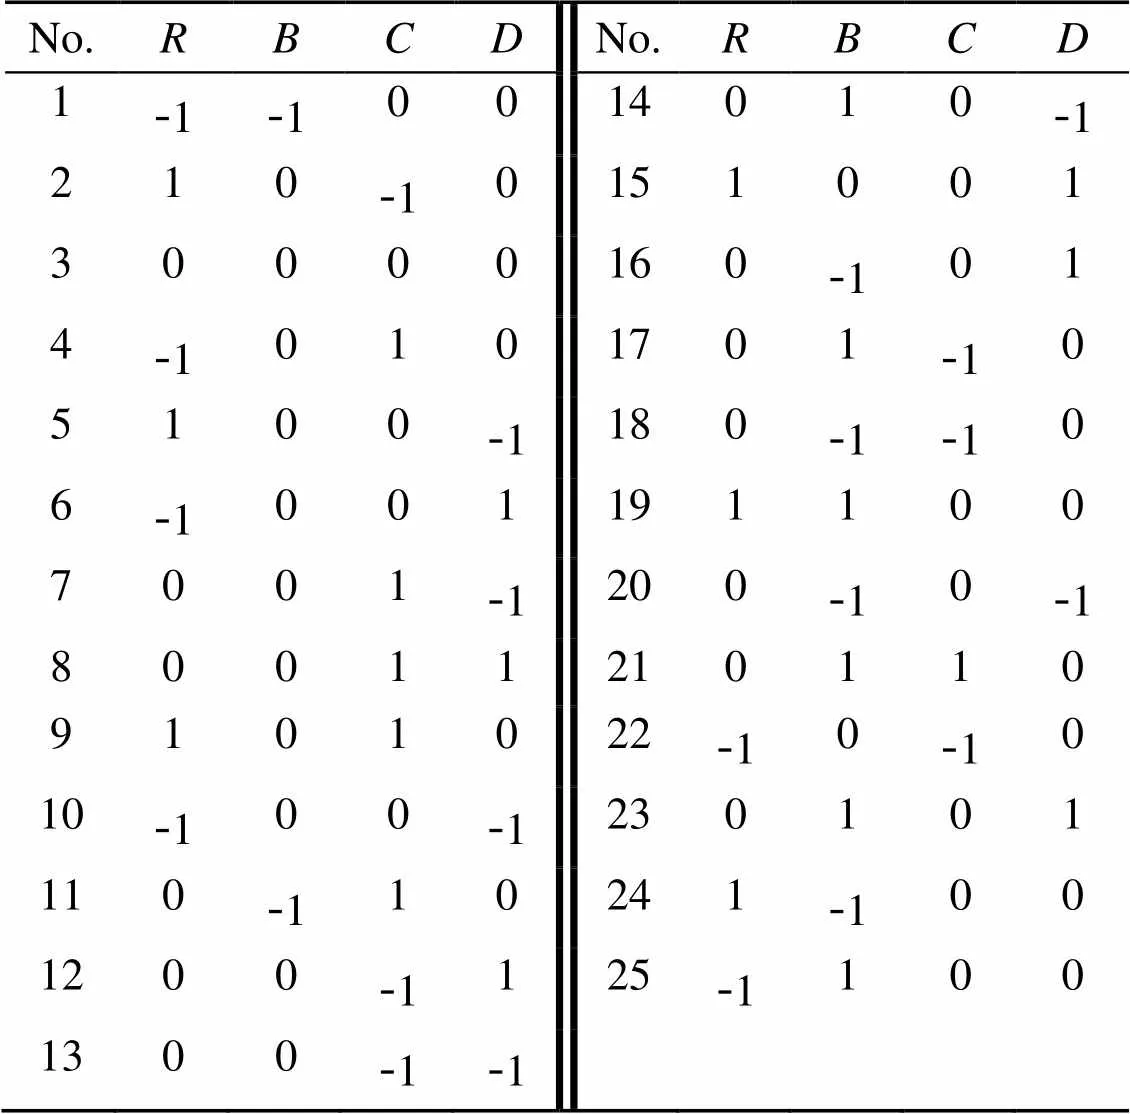
Table 5 Test conditions of the breakage parameters
4.2 Analysis of test results based on RSM
Ballast compression and shear simulations were carried out based on the combination of test conditions shown in Table 5. The results are shown in Fig. 8.
The interquartile range (IQR) of each data is shown in Fig. 8. In the 25 tests for each of the three shapes, the CBSC of the normal particles was mainly between 10.09 and 56.90 MPa, the CBSC of the long particles was between 5.85 and 18.05 MPa, and that of the flat particles was mainly between 17.24 and 73.37 MPa. In terms of the CBSS, the ranges for the normal, long, and flat particles were 5.87–9.49 MPa, 1.67–7.70 MPa, and 4.16–9.83 MPa, respectively. Thus, we concluded that the critical strength was the result of the joint action of multiple parameters, and the influence of a single parameter was limited.
Using the normal particles as an example, the RSM was used to analyze the results. A polynomial was first used to fit the model, and the terms with<0.1 (Chaubey, 1993) were selected.is a parameter used to determine the result of hypothesis test. Then, the least squares method was used to calculate the variance and perform statistical analysis, as shown in Table 6. The polynomial regression equations of the breakage parameters are as follows:
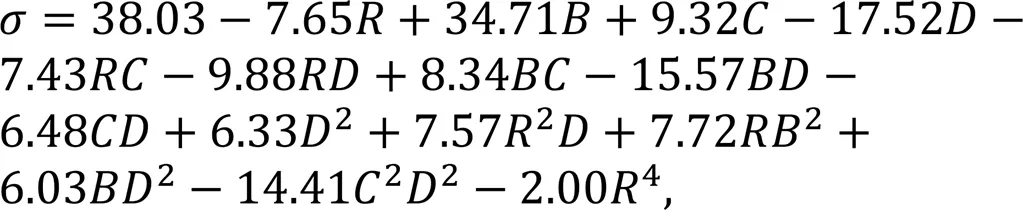
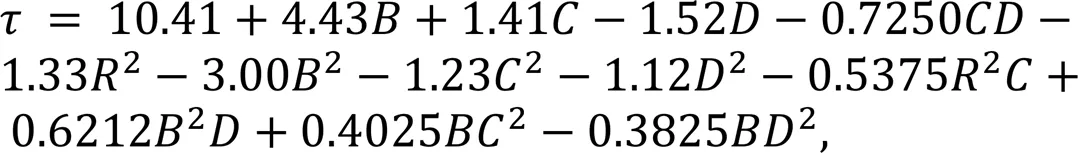
Fig. 8 Simulation results: (a) compression tests; (b) shear tests
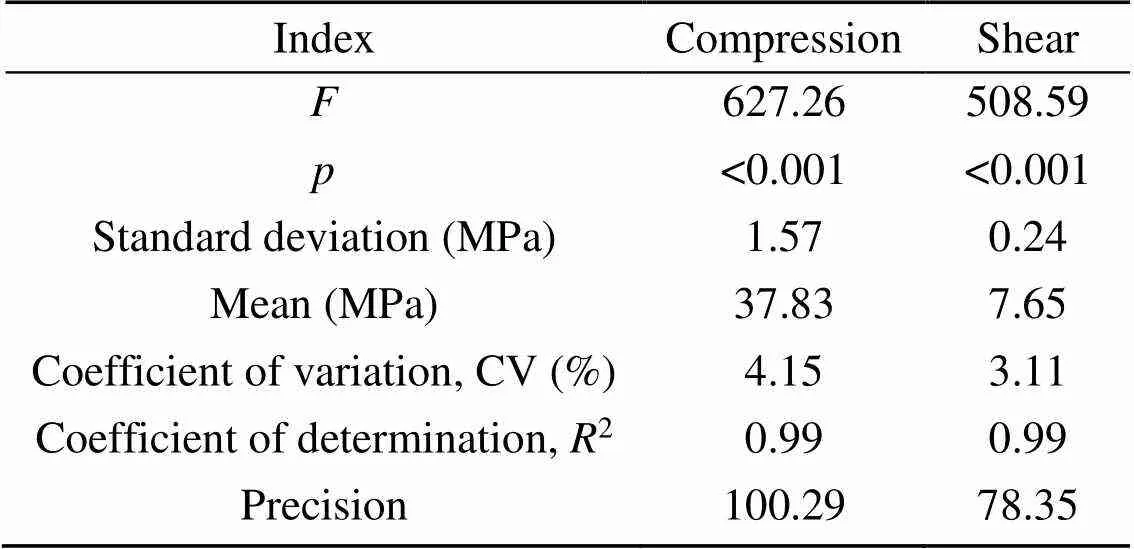
Table 6 Statistical results of the regression model
whereandrepresent the CBSC and CBSS, respectively.
is used to test whether the results of the sample can represent the authenticity of the whole. Based on significance test theory (Hochberg, 1988) and the coefficient of determination (Bar-Gera, 2017), thevalues for the compression test and the shear test were computed, with values of 627.26 and 508.59 (<0.001), respectively, indicating that the regression equation was very effective. The coefficients of variation of the compression test and the shear test were 4.15% and 3.11%, respectively. Both were less than 15%, indicating a good fit for the model. The coefficient of determination2was close to 1, and the precision was greater than 4, suggesting that the coefficients of the model were accurate and had high precision.
Any two first-order parameters in the regression equation were selected as theand-axes, and the remaining two first-order parameters used the values of the medium level. The 3D surfaces of the ballast breakage parameters, CBSC and CBSS, are shown in Fig. 9.
There was a strong non-linear relationship between the significant terms of the ballast breakage parameters. Similarly, the response surfaces of the breakage parameters of the long and flat particles were obtained. The results showed that there was a strong non-linear relationship between the ballast breakage parameters, and the contribution of each parameter to the ballast breaking strength was different. The RSM could better evaluate the relationship between the parameters.
4.3 Determination of optimal breakage parameters of ballasts
With the initial design point of the optimized model as the starting point, the CBSC and CBSS obtained in the physical tests (Table 3) were set as the optimization targets, and the breakage parameters of the three shapes of ballast were optimized. The optimal parameter combinations are shown in Table 7.
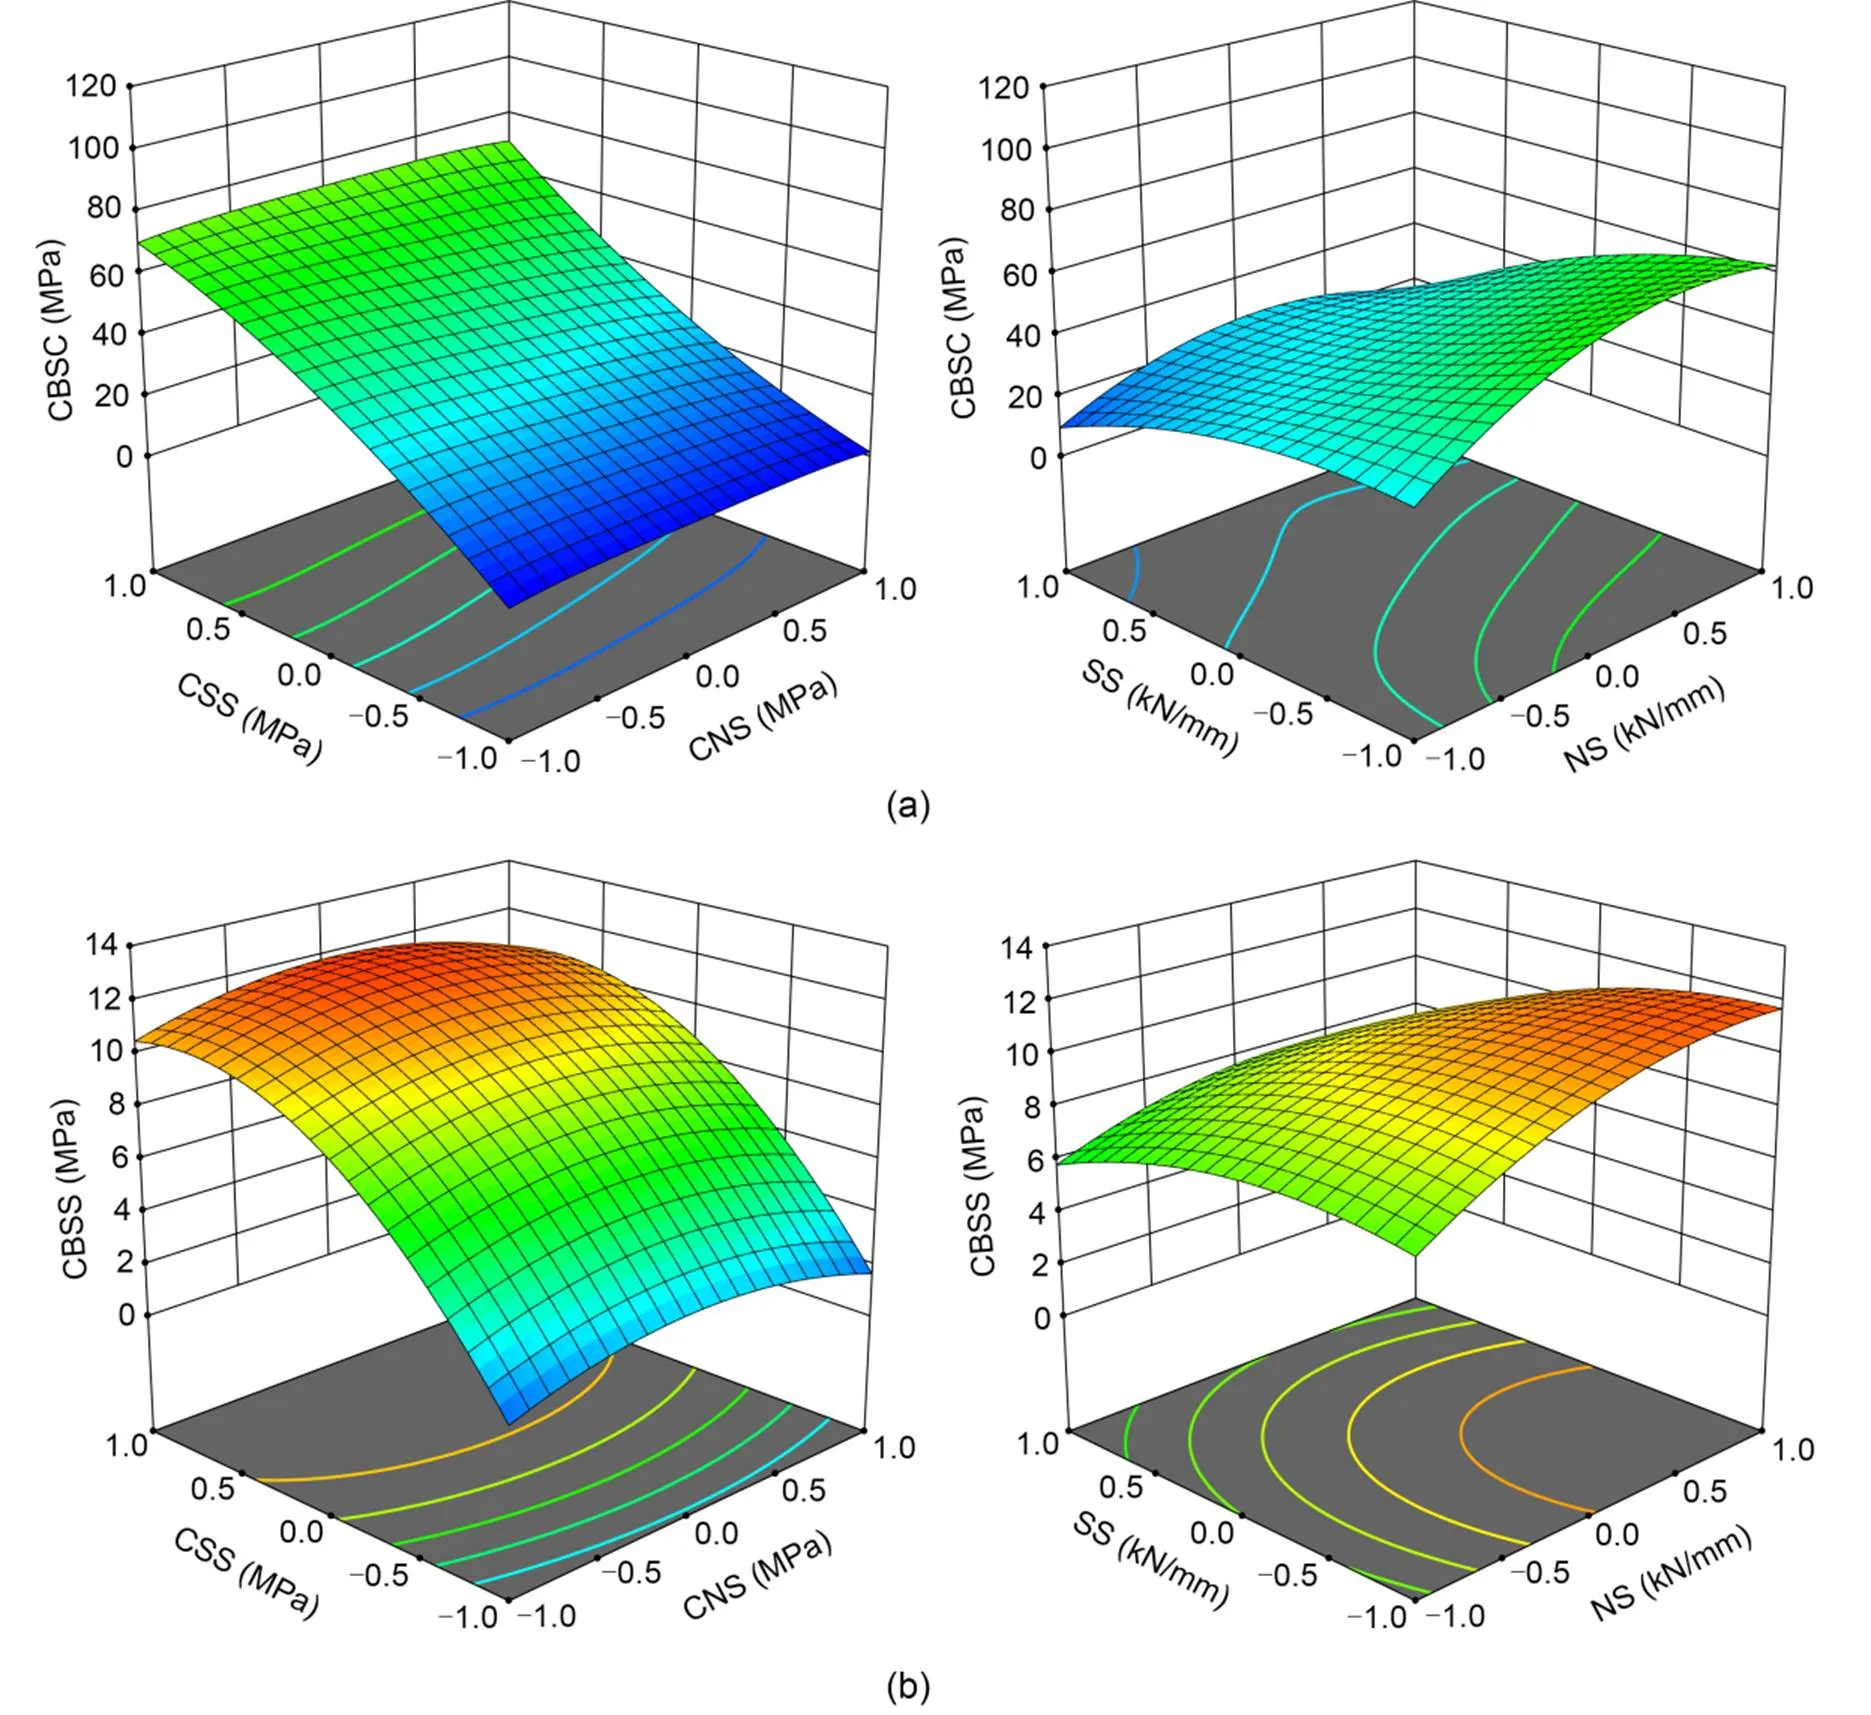
Fig. 9 Response surfaces of the breakage parameters of the normal ballast particles: (a) CBSC; (b) CBSS
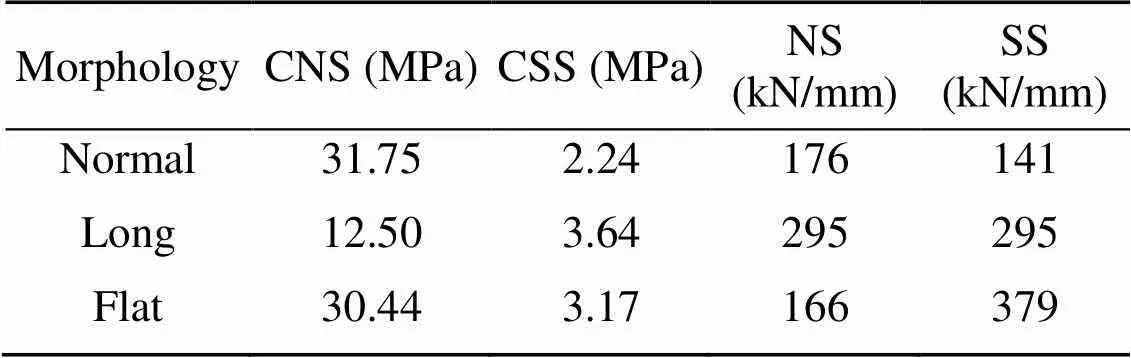
Table 7 Optimal parameter combinations
Using the parameters in Table 7, the compression and shear tests of the three shapes of ballast were simulated again using the method described in Section 4.1, and the breaking strength was obtained (Fig. 10).
The three shapes of ballast particles showed a consistent breakage behavior in the uniaxial compressive laboratory test and the simulation (Fig. 10). A paired-test (two-tailed) was performed on the laboratory test and simulation results, and in all cases the simulation results using the optimal parameters were not significantly different (>0.05) from the test results shown in Table 3 (Ibragimov and Müller, 2010).
5 Direct shear test of ballast based on optimal breakage parameters
In the ballasted bed, the ballast particles were nested with each other, and an occluding and interlocking ballast aggregate was formed through friction, shear, and other mechanical behaviors, thereby providing strong support and ensuring smooth railway operation. The direct shear test is a common method used to obtain the shear resistances of bulk materials, and it can be used to reflect the shear resistance and damage status of ballast (Wang et al., 2015). Thus, a direct shear test was used in this study to verify the correctness of the optimal parameters in Table 7 and to analyze the breakage behavior of the ballast.
5.1 Test method
A direct shear test platform was built in the laboratory. Particles that met the Chinese standard for special-grade ballast were selected, and the required content of long particles was placed into the upper and lower shear boxes. The total content of the long and flat particles was less than 20%. Since the bottom surface of the lower shear box had a sieve hole with a side length of 1 cm, a small amount of the broken ballast generated during the compaction process could be excluded to avoid interference with the test results. Through repeated vibrations, the density of the ballast in the shear box was controlled at 1.7 g/cm3. Because a top pressure of 100 kPa could ensure the continuous and stable performance of the ballast direct shear test (Xu, 2016; Bian et al., 2019), a pressure of 100 kPa was applied to the top of the upper shear box. The lower shear box was pushed laterally at a constant speed of 0.05 mm/s during the test (Fig. 11a).
A 1׃1 DEM model was established for the ballast with the same gradation and content for the long and flat particles. For the post-processing module of the DEM software, a total of 983 particles were used in the simulation. As the test progressed, cracks gradually appeared between the upper and lower shear boxes. Therefore, 10-cm-thick horizontal baffles were arranged along the horizontal plane at the edges of the shear boxes to prevent the ballast from leaking. During the simulation, the breakage parameters of the ballast were taken from Table 7, and the intrinsic and contact parameters were based on an earlier study (Xiao et al., 2019; Liu et al., 2022), as shown in Fig. 11b.
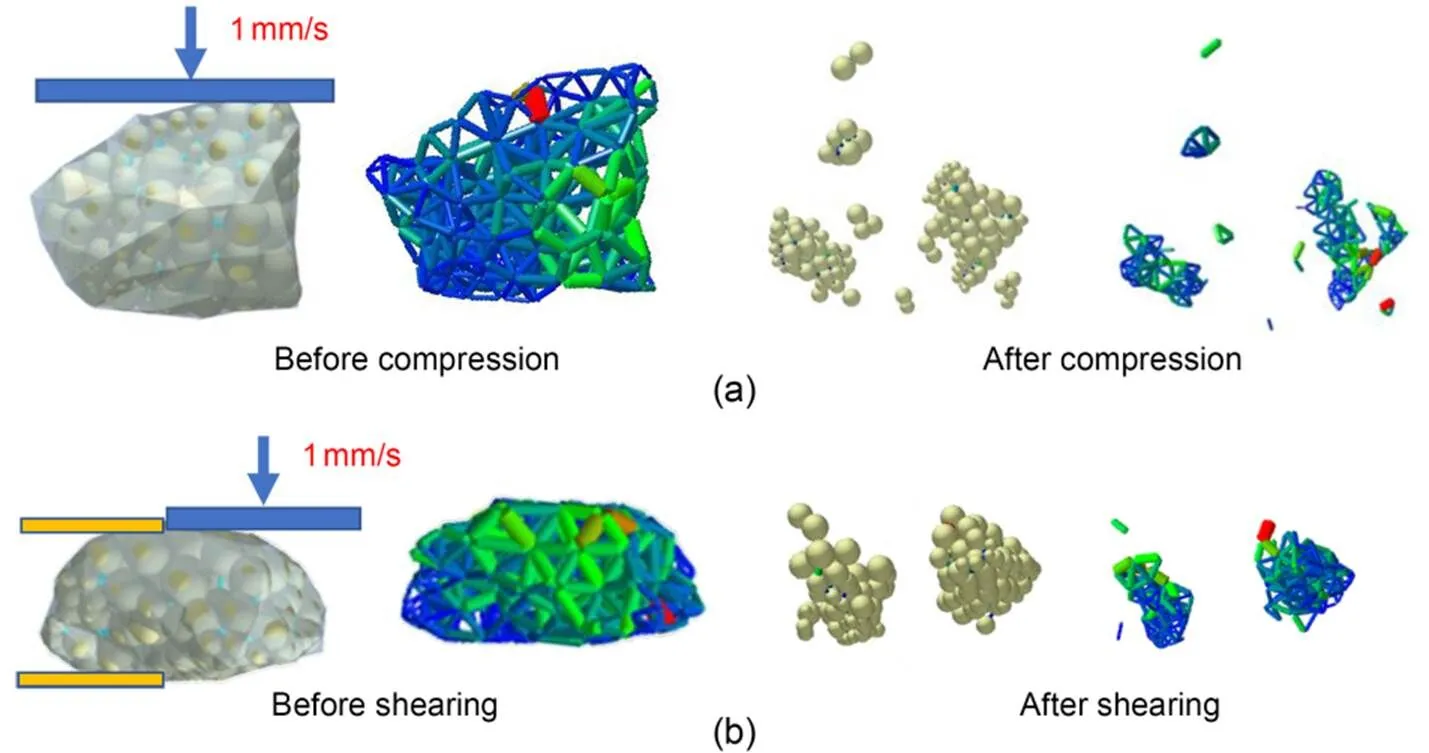
Fig. 10 DEM simulation of ballast breakage: (a) compression test; (b) shear test
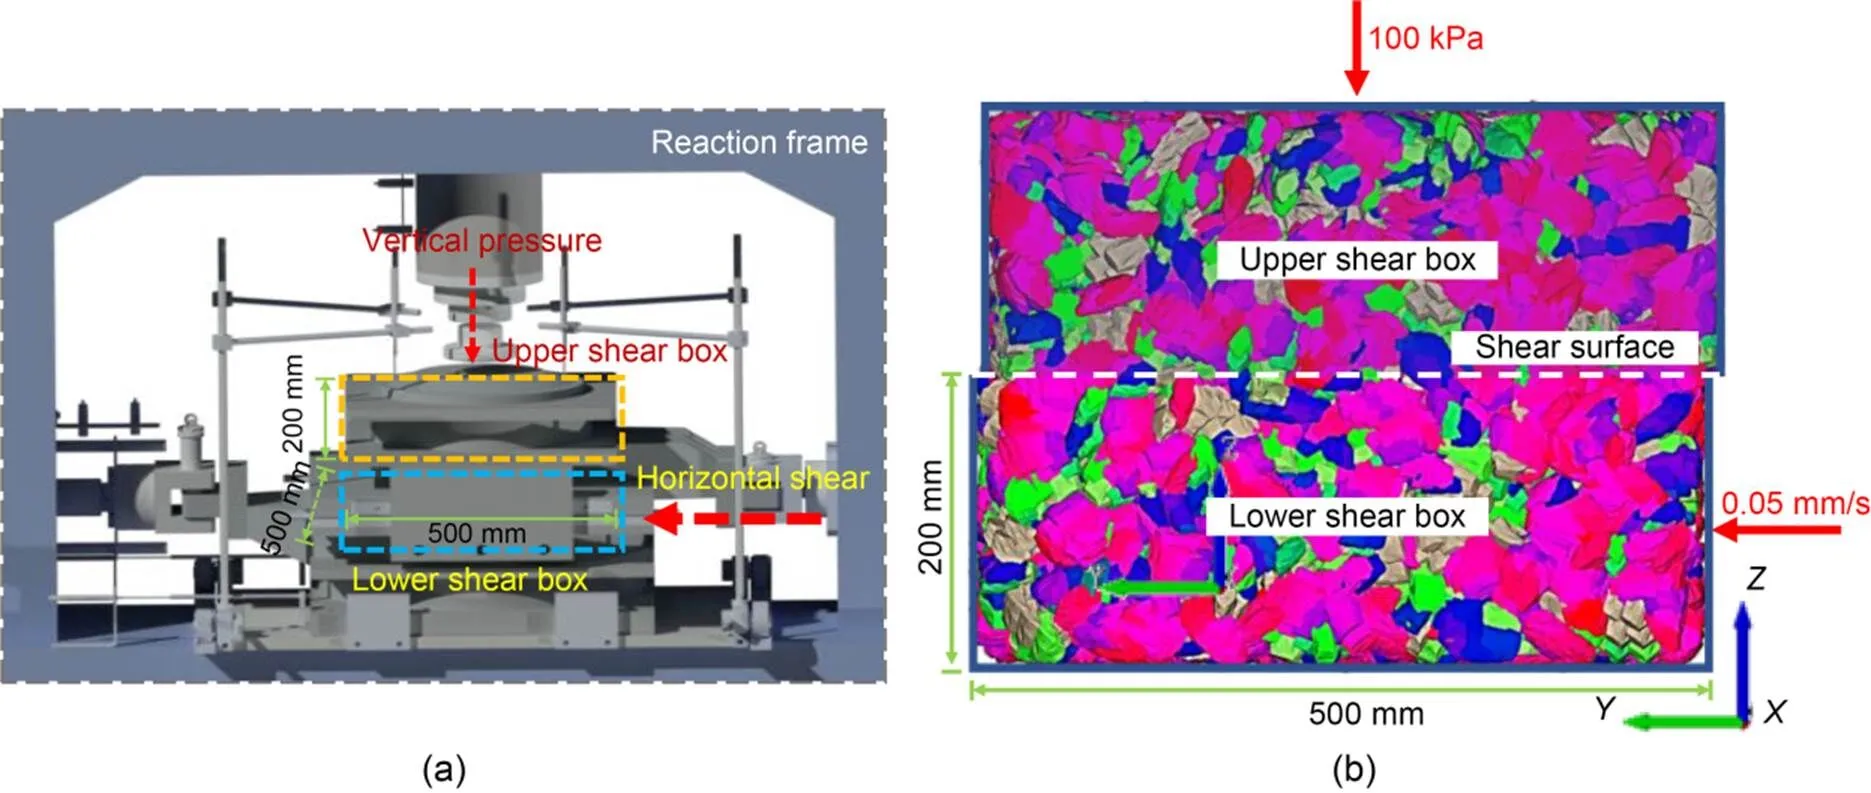
Fig. 11 Direct shear tests: (a) laboratory test; (b) simulation test
5.2 Analysis of test results
After the test, the shear stress–displacement curves of the laboratory test and the simulation were obtained (Fig. 12).
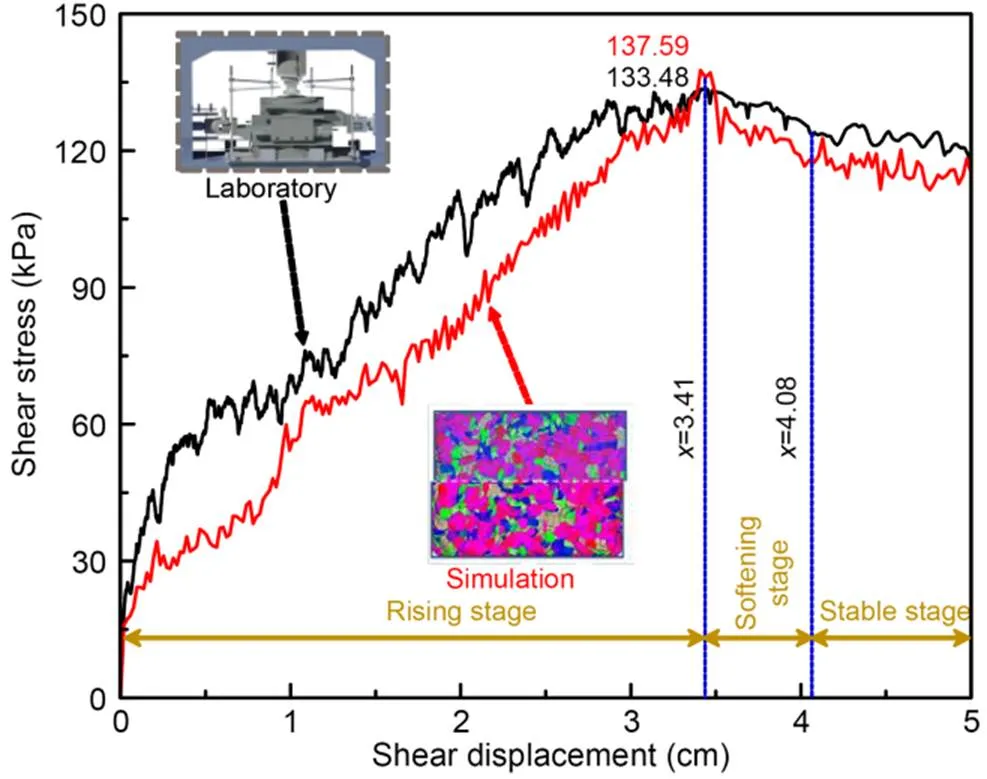
Fig. 12 Results of the direct shear test
The trend of the shear stress–strain curve of the simulation test was consistent with that of the laboratory test. In the initial stage, the shear stress of the DEM simulation was slightly smaller than the laboratory result. This was due to the breakage of ballast particles in the numerical simulation. After breakage, the small particles were redistributed, resulting in a decrease in the shear stress. In the later stage, the particle distribution was stable, and the simulated shear stress was basically the same as the laboratory test value. Thus, the result verified the correctness of the parameters in Table 7.
The direct shear test shown in Fig. 12 was further analyzed. The test process of the direct shear test could be roughly divided into three stages. The first stage was the rising stage. The shear stress gradually increased with the increase of the displacement. In this stage, the ballast particles in the shear box moved rapidly due to external forces and were redistributed, and the inter-particle distances were gradually squee zed. When the friction between the particles was not sufficient to overcome the external force, the ballast particles broke. The second stage was the softening stage. As the shear displacement increased, the shear stress of the ballast aggregate decreased rapidly. As the ballast particles broke and yielded in the previous stage, a balance state was reached at the maximum shear stress. Thus, the upper and lower shear boxes were easy to move in this stage, and the shear stress gradually decreased. The last stage was the stable stage, in which the shear stress fluctuated with the increase of the displacement until the end of the test.
5.3 Analysis of the amount of ballast breakage
The time series data for the simulation test described above were extracted to analyze the breakage behavior of the ballast at different times (Fig. 13).
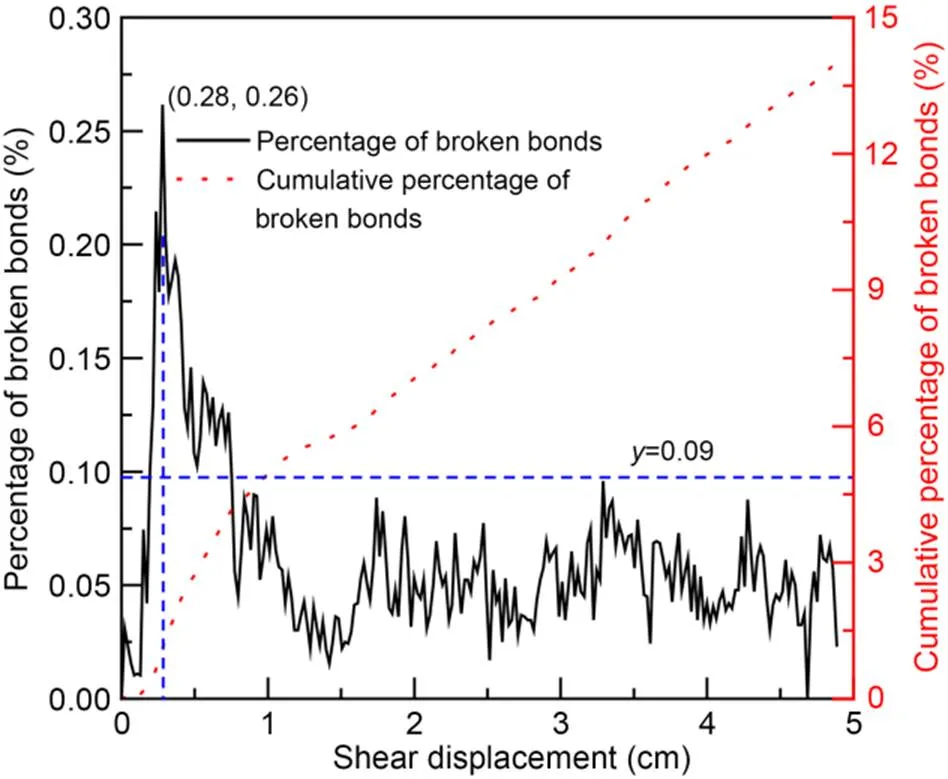
Fig. 13 Ballast breakage ratio
The ballast breakage ratio fluctuated with the change of the shear displacement. When the shear displacement was 0.28 cm, 355 bonds were broken, accounting for 0.26% of the total number of bonds. At the beginning of the test, the ballast aggregate formed a stable structure due to friction and interlocking. To break this equilibrium state, the shear force required a large amount of work, so the ballast breakage amount increased rapidly in the initial state. After the ballast particles were broken and became smooth and easy to move, the stable state of friction and interlocking inside the ballast aggregate was broken, and the interaction force between the ballast was mainly friction. When the shear displacement was greater than 0.28 cm, the number of broken bonds of a single ballast gradually stabilized at around 130 (breakage ratio: 0.09%). The cumulative number of broken bonds gradually increased, reaching 13.97% at the end of the test, which was a relatively low level.
In summary, under the long-term repeated loading of trains, the violent interaction between the wheel and rail (Chen et al., 2017) makes the vibration effect in the railway track gradually accumulate (Sheng et al., 2018; Zhao et al., 2021), so the cumulative breakage ratio of the ballast in a ballasted track would gradually increase. Thus, it is necessary for a railway management department to replace the ballast regularly to ensure the stability of a ballasted bed.
Water and frost as well as cyclical loads can permanently change the static and dynamic properties of elastic elements of a railway superstructure. This may affect the effectiveness of reducing the level of vibrations throughout the lifetime of a railway line (Costa et al., 2012; Indraratna et al., 2014; Kaewunruen et al., 2018). The use of USPs and the UBMs can significantly reduce the value of loads transmitted to the ballast and reduce the phenomenon of grain cracking (Esmaeili et al., 2020). Therefore, USPs or UBMs are now more often used in construction (Indraratna et al., 2021; Kraśkiewicz et al., 2021), which provides a direction for mitigating the degradation of ballasted tracks.
6 Conclusions
In this study, laboratory uniaxial compression and shear tests were carried out, and statistical methods were used to determine the factors influencing ballast breakage for the normal stress state as well as the CBSC and the CBSS. Then, a refined DEM ballast model was established, and the Box-Behnken method was used to design test conditions. A regression analysis was then carried out on the simulation results to obtain the response surface of the breakage parameters. Subsequently, taking the CBSC and the CBSS as the optimization targets, the breakage parameters were optimized. Lastly, simulation and laboratory-measured direct shear test results were compared to verify the effectiveness of the DEM model and to analyze the shear resistance of the ballast aggregate. The results showed the following:
(1) For ballast particles with sizes in the range of 22.4–63.0 mm, the CSOC and CSOS were not significantly affected by the particle size, but were greatly affected by the shape of the ballast. In particular, long ballast particles were greatly impacted.
(2) The direct shear test results of ballast aggregates could be divided into three stages: the ascending stage, softening stage, and stable stage. When the shear displacement was 0.28 cm, the ballast breakage ratio reached a maximum of 0.26%. The cumulative ballast breakage ratio gradually increased to 13.97% at the end of the test.
(3) Under long-term repeated loading of a train, the cumulative breakage ratio of the ballasted bed gradually increased. Thus, it would be necessary to replace the ballast regularly to ensure the stability of the ballasted bed.
(4) The CNS, CSS, NS, and SS of ballast particles with different morphologies and the optimal parameter combination were 31.75 MPa, 2.24 MPa, 176 kN/mm, and 141 kN/mm for the normal shape, 12.5 MPa, 3.64 MPa, 295 kN/mm, and 295 kN/mm for the long shape, and 30.44 MPa, 3.17 MPa, 166 kN/mm, and 379 kN/mm for the flat shape, respectively.
This work is supported by the National Natural Science Foundation of China (No. 52008395).
Gan-zhong LIU and Jia-cheng DAI designed the research and processed the corresponding data. Gan-zhong LIU wrote the first draft of the manuscript. Ping WANG and Rong CHEN helped to organize the manuscript. Hao LIU and Xian-kui WEI revised the final version.
Gan-zhong LIU, Jia-cheng DAI, Ping WANG, Rong CHEN, Hao LIU, and Xian-kui WEI declare that they have no conflict of interest.
Bar-Gera H, 2017. The target parameter of adjusted-squared in fixed-design experiments., 71(2):112-119. https://doi.org/10.1080/00031305.2016.1200489
Bian XC, Li W, Qian Y, et al., 2019. Micromechanical particle interactions in railway ballast through DEM simulations of direct shear tests., 19(5):04019031. https://doi.org/10.1061/(asce)gm.1943-5622.0001403
Box GEP, Wilson KB, 1951. On the experimental attainment of optimum conditions., 13(1):1-38. https://doi.org/10.1111/j.2517-6161.1951.tb00067.x
Chaubey YP, 1993. Resampling-based multiple testing: examples and methods for-value adjustment., 35(4):450-451. https://doi.org/10.1080/00401706.1993.10485360
Chen R, Chen JY, Wang P, et al., 2017. Numerical investigation on wheel-turnout rail dynamic interaction excited by wheel diameter difference in high-speed railway., 18(8):660-676. http://dx.doi.org/10.1631/jzus.A1700134
Cho GC, Dodds J, Santamarina JC, 2006. Particle shape effects on packing density, stiffness, and strength: natural and crushed sands., 132(5):591-602. https://doi.org/10.1061/(asce)1090-0241(2006)132:5(591)
Costa PA, Calçada R, Cardoso AS, 2012. Ballast mats for the reduction of railway traffic vibrations. Numerical study., 42:137-150. https://doi.org/10.1016/j.soildyn.2012.06.014
de Bono J, McDowell G, 2016. Particle breakage criteria in discrete-element modelling., 66(12):1014-1027. https://doi.org/10.1680/jgeot.15.p.280
DEM Solutions Ltd., 2021. EDEM Documentation. DEM Solutions Ltd., UK.
Esmaeili M, Shamohammadi A, Farsi S, 2020. Effect of deconstructed tire under sleeper pad on railway ballast degradation under cyclic loading., 136:106265. https://doi.org/10.1016/j.soildyn.2020.106265
European Standard, 2013. Aggregates for Railway Ballast, BS EN 13450:2013. British Standards Institution.
Ferreira SLC, Bruns RE, Ferreira HS, et al., 2007. Box-Behnken design: an alternative for the optimization of analytical methods., 597(2):179-186. https://doi.org/10.1016/j.aca.2007.07.011
Gao MY, Cong JL, Xiao JL, et al., 2020. Dynamic modeling and experimental investigation of self-powered sensor nodes for freight rail transport., 257:113969. https://doi.org/10.1016/j.apenergy.2019.113969
Gao MY, Wang P, Jiang LL, et al., 2021. Power generation for wearable systems., 14(4):2114-2157. https://doi.org/10.1039/d0ee03911j
Goodman RE, 1995. Block theory and its application., 45(3):383-423. https://doi.org/10.1680/geot.1995.45.3.383
Hertz H, 1881. On the contact of elastic solids., 92:156-171.
Hiramatsu Y, Oka Y, 1966. Determination of the tensile strength of rock by a compression test of an irregular test piece., 3(2):89-90. https://doi.org/10.1016/0148-9062(66)90002-7
Hochberg Y, 1988. A sharper Bonferroni procedure for multiple tests of significance., 75(4):800-802. https://doi.org/10.1093/biomet/75.4.800
Hossain Z, Indraratna B, Darve F, et al., 2007. DEM analysis of angular ballast breakage under cyclic loading., 2(3):175-181. https://doi.org/10.1080/17486020701474962
Ibragimov R, Müller UK, 2010.-statistic based correlation and heterogeneity robust inference., 28(4):453-468. https://doi.org/10.1198/jbes.2009.08046
Indraratna B, Thakur PK, Vinod JS, 2010. Experimental and numerical study of railway ballast behavior under cyclic loading., 10(4):136-144. https://doi.org/10.1061/(asce)gm.1943-5622.0000055
Indraratna B, Nimbalkar S, Navaratnarajah SK, et al., 2014. Use of shock mats for mitigating degradation of railroad ballast., 6(1):32-41.
Indraratna B, Qi YJ, Jayasuriya C, et al., 2021. Use of recycled rubber inclusions with granular waste for enhanced track performance., 6:100093. https://doi.org/10.1016/j.treng.2021.100093
Itasca Consulting Group Inc., 2014. PFC-Particle Flow Code Version 5.0 Users’ Manual. Itasca, Minneapolis, USA.
Jaeger JC, 1967. Failure of rocks under tensile conditions., 4(2):219-227. https://doi.org/10.1016/0148-9062(67)90046-0
Jing GQ, Qiang WL, Chang JX, et al., 2020. Effect of flakiness-elongation index on shear behavior of railway ballast., 55(4):688-694 (in Chinese). https://doi.org/10.3969/j.issn.0258-2724.20180677
Kaewunruen S, Ngamkhanong C, Papaelias M, et al., 2018. Wet/dry influence on behaviors of closed-cell polymeric cross-linked foams under static, dynamic and impact loads., 187:1092-1102. https://doi.org/10.1016/j.conbuildmat.2018.08.052
Khuri AI, Mukhopadhyay S, 2010. Response surface methodology., 2(2):128-149. https://doi.org/10.1002/wics.73
Kraśkiewicz C, Zbiciak A, Al Sabouni-Zawadzka A, et al., 2020. Experimental research on fatigue strength of prototype under sleeper pads used in the ballasted rail track systems., 66(1):241-255. https://doi.org/10.24425/ace.2020.131786
Kraśkiewicz C, Zbiciak A, Al Sabouni-Zawadzka A, et al., 2021. Analysis of the influence of fatigue strength of prototype under ballast mats (UBMs) on the effectiveness of protection against vibration caused by railway traffic., 14(9):2125. https://doi.org/10.3390/ma14092125
Kraśkiewicz C, Zbiciak A, Al Sabouni-Zawadzka A, et al., 2022. Resistance to severe environmental conditions of prototypical recycling-based under ballast mats (UBMs) used as vibration isolators in the ballasted track systems., 319:126075. https://doi.org/10.1016/j.conbuildmat.2021.126075
Lim WL, McDowell GR, 2005. Discrete element modelling of railway ballast., 7(1):19-29. https://doi.org/10.1007/s10035-004-0189-3
Lim WL, McDowell GR, Collop AC, 2004. The application of Weibull statistics to the strength of railway ballast., 6(4):229-237. https://doi.org/10.1007/s10035-004-0180-z
Liu GZ, Li P, Wang P, et al., 2021. Study on structural health monitoring of vertical vibration of ballasted track in high-speed railway., 11(2):451-463. https://doi.org/10.1007/s13349-020-00460-x
Liu GZ, Cong JL, Wang P, et al., 2022. Study on vertical vibration and transmission characteristics of railway ballast using impact hammer test., 316:125898. https://doi.org/10.1016/j.conbuildmat.2021.125898
Liu H, Liu G, Wei XK, et al., 2021. Research on railway ballast with the optimal sphere filling by using discrete element model., 676:012092. https://doi.org/10.1088/1755-1315/676/1/012092
Lu M, McDowell GR, 2006. Discrete element modelling of ballast abrasion., 56(9):651-655. https://doi.org/10.1680/geot.2006.56.9.651
Luo R, Zeng YW, Du X, 2012. Relationship between macroscopic and mesoscopic mechanical parameters of inhomogenous rock material., 34(12):2331-2336 (in Chinese).
Masson S, Martinez J, 2001. Micromechanical analysis of the shear behavior of a granular material., 127(10):1007-1016. https://doi.org/10.1061/(asce)0733-9399(2001)127:10(1007)
Mindlin RD, 1949. Compliance of elastic bodies in contact., 16(3):259-268. https://doi.org/10.1115/1.4009973
Mindlin RD, Deresiewicz H, 1953. Elastic spheres in contact under varying oblique forces., 20(3):327-344. https://doi.org/10.1115/1.4010702
Nakata AFL, Hyde M, Hyodo H, et al., 1999. A probabilistic approach to sand particle crushing in the triaxial test., 49(5):567-583. https://doi.org/10.1680/geot.1999.49.5.567
NRA (National Railway Administration of the People’s Republic of China), 2018. Railway Ballast, TB/T 2140-2018. National Standards of the People’s Republic of China (in Chinese).
Nicot F, Hadda N, Guessasma M, et al., 2013. On the definition of the stress tensor in granular media., 50(14-15):2508-2517. https://doi.org/10.1016/j.ijsolstr.2013.04.001
Sheng X, Zhao CY, Yi Q, et al., 2018. Engineered metabarrier as shield from longitudinal waves: band gap properties and optimization mechanisms., 19(9):663- 675. https://doi.org/10.1631/jzus.A1700192
Wang B, Martin U, Rapp S, 2017. Discrete element modeling of the single-particle crushing test for ballast stones., 88:61-73. https://doi.org/10.1016/j.compgeo.2017.03.007
Wang ZJ, Jing GQ, Yu QF, et al., 2015. Analysis of ballast direct shear tests by discrete element method under different normal stress., 63:17-24. https://doi.org/10.1016/j.measurement.2014.11.012
Xiao JL, Liu GZ, Liu JX, et al., 2019. Parameters of a discrete element ballasted bed model based on a response surface method., 20(9):685-700. https://doi.org/10.1631/jzus.a1900133
Xu Y, 2016. Mechanical Behavior and Deterioration Mechanism Research on Railway Ballast Bed. PhD Thesis, Beijing Jiaotong University, Beijing, China (in Chinese).
Xu Y, Gao L, Yang GT, et al., 2019. Research of wear mechanism of railway ballast based on crushable discrete element., 41(2):124- 129. https://doi.org/10.3969/j.issn.1001-8360.2019.02.017
Yoon J, 2007. Application of experimental design and optimization to PFC model calibration in uniaxial compression simulation., 44(6):871-889. https://doi.org/10.1016/j.ijrmms.2007.01.004
You MQ, 2014. Effect of confining pressure on strength scattering of rock specimen., 33(5):929-937 (in Chinese). https://doi.org/10.13722/j.cnki.jrme.2014.05.008
Zhao SW, Zhou XW, 2017. Effects of particle asphericity on the macro- and micro-mechanical behaviors of granular assemblies., 19(2):38. https://doi.org/10.1007/s10035-017-0725-6
Zhao ZM, Wei K, Ren JJ, et al., 2021. Vibration response analysis of floating slab track supported by nonlinear quasi-zero-stiffness vibration isolators., 22(1):37-52.https://doi.org/10.1631/jzus.A2000040
Rong CHEN,https://orcid.org/0000-0001-8093-6201
Jan. 9, 2022;
Revision accepted Apr. 14, 2022;
Crosschecked Aug. 29, 2022;
Online first Sept. 27, 2022
© Zhejiang University Press 2022
 Journal of Zhejiang University-Science A(Applied Physics & Engineering)2023年3期
- Journal of Zhejiang University-Science A(Applied Physics & Engineering)的其它文章
- High-speed railway transport technology
- Recent advances in traction drive technology for rail transit
- Impact of extreme climate and train traffic loads on the performance of high-speed railway geotechnical infrastructures
- Adaptive cropping shallow attention network for defect detection of bridge girder steel using unmanned aerial vehicle images
- Adaptive fault-tolerant control of high-speed maglev train suspension system with partial actuator failure: design and experiments
- Effect of low operating temperature on the aerodynamic characteristics of a high-speed train