Porous reduced graphene oxide for ultrasensitive detection of nitrogen dioxide
Zengyong Chu,Min Xiao,Qichao Dong,Guochen Li,Tianjiao Hu,Ye Zhang,Zhenhua Jiang
College of Liberal Arts and Science,National University of Defense Technology,Changsha 410073,China
Keywords:Gas sensors Nitrogen dioxide Graphene oxide Photo-fenton reaction Porous reduced graphene oxide
ABSTRACT The defect engineering in graphene plays a significant role for the application of gas sensors.In this work,we proposed an efficient method to prepare ultrasensitive gas sensors based on the porous reduced graphene oxide (PRGO).Photo-Fenton etching was carried out on GO nanosheets in a controlled manner to enrich their vacancy defects.The resulting porous graphene oxide (PGO) was then drop-coated on interdigital electrodes and hydrothermal reduced at 180 °C.Controllable reduction was achieved by varying the water amount.The gas sensor based on PRGO-5 min-6 h exhibited superior sensing and selective performance toward nitrogen dioxide (NO2),with an exceptional high sensitivity up to 12 ppm-1.The theoretical limit of detection is down to 0.66 ppb.The excellent performance could be mainly attributed to the typical vacancy defects of PRGO.Some residue carboxylic groups on the edges could also facilitate the adsorption of polar molecules.The process has a great potential for scalable fabrication of high-performance NO2 gas sensors.
Detection of volatile toxic gas is extremely important for air pollution monitoring and personal safety protection.Nitrogen dioxide (NO2) can be produced by many pathways,such as car exhaust,burning of fossil fuels,and emissions from industrial complexes[1,2].As a volatile gas,NO2can undergo photochemical reactions with other pollutants or water,generating ozone or acid rain [3].In addition,NO2with the concentration higher than 1 ppm is dangerous to the human’s respiration system [4].Furthermore,according to the U.S.Environmental Protection Agency (EPA),the annual threshold limit of NO2is only 53 ppb [5].Thus,high performance sensors with high sensitivity and ultralow limit of detection (LOD)are extremely necessary to detect trace amounts of NO2.
In the past decades,various materials including semiconducting metal oxides [6],conducting polymers [7] and carbon nanomaterials [2] have been developed to promote the performance of chemiresistor-type gas sensors.Especially,graphene and its derivatives had attracted the most attention due to large specific surface area [8],versatile surface chemistry [9].In addition,graphene derivatives such as graphene oxide (GO) and reduced graphene oxide (rGO) could be synthesized on a large scale,which bring the gas sensors to a bright future.
Generally,the charge transfer between adsorbed molecules and graphene governs the sensing mechanism.However,pristine 2D graphene [10] and rGO [11] displays poor gas sensitivity and limited reversibility.Many strategies have been put forward to improve their gas sensing performance.On the one hand,microstructure regulation such as chemical modification [12],porous defects[13],and heteroatom-doping [14] can enhance their sensing performance due to the increased effective adsorption sites.For example,sulfonated rGO and ethylenediamine-modified rGO exhibited 16.4 and 4.3 times enhanced responses respectively [12].In addition,there have been many theoretical calculations based on first principles to study the effects of defects and functional groups on graphene gas sensing [2,15-17].It was found that compared with intrinsic graphene,the defective and the carboxyl-functionalized graphene had higher binding energy and larger charge-transfer with NO2molecules.The porous reduced graphene oxide (PRGO)prepared by solution etching showed a sensitivity of 2.44 ppm-1in NO2detection [13].However,the sensors could seldom detect NO2molecules at concentrations lower than 20 ppb and their sensitivities are rarely above 10 ppm-1.Furthermore,the reagents used for reduction such as hydroquinone [18],NaHSO3[19],EDA[12],H3BO3[14] and hydrazine [13] inevitably caused environmental pollution or serious safety concerns.Reduction using Vitamin C (VC) is environmentally friendly,but the sensitivity of the VCreduced hydrogel was only 0.03 ppm-1[20].

Fig.1.Schematic illustration of the fabrication process.
In this work,we report a simple method for the efficient introduction of vacancy defects and the controllable reduction of functional groups.We firstly prepared porous graphene oxide (PGO)viathe photo-Fenton reaction,which is widely used for treating organic waste waters [21,22].The process was much faster than the solution etching using hydrogen peroxide at 100 °C [13].Large vacancy defects could be efficiently introduced by the photo-Fenton etching.The obtained PGO dispersion was then drop-coated onto the interdigital electrode (IE) and hydrothermal reduced at 180 °C[23].Some carboxylic groups could be retained after the hydrothermal reduction.The combination of vacancy defects and carboxylic groups boosts the gas sensing performance to an exceptional sensitivity and selectivity toward NO2.
Fig.1 illustrates the fabrication process of PRGO.Aqueous GO dispersion was treated under UV light in the presence of Fenton reagents (Fe2+/H2O2) [21].For a typical photo-Fenton etching process,GO aqueous dispersion,H2O2solution,FeSO4solution and deionized water were added dropwise into a quartz tube.The mixed solution was irradiated under a UV lamp (365 nm,200 W)at room temperature.The product was dialyzed in the ultra-pure water to remove impurities.PGO dispersion was obtained and labeled as PGO-t1,wheret1is the reaction time.PGO-t1solution was transferred onto an IE surface with a microsyringe,dried and suspended in a 50 mL stainless steel autoclave containing a small amount of deionized water at the bottom.The material was hydrothermal reduced at 180°C.Reduction to PRGO was carried out in an on-chip manner.The final product was labeled as PRGO-t1-t2,wheret2is the reduction time.All the gas sensing tests were performed on a commercial testing platform.The detailed experimental procedures can be found in Supporting information.
The response of the gas sensor was derived from the relative conductance change (ΔG/G0).
whereG0is the original conductivity in N2,andGis the changing conductivity during exposure to NO2.
Compared with the solution etching method using hydrogen peroxide at 100 °C [13],the etchingviaphoto-Fenton reaction is much faster.As shown in Fig.2a,the aqueous GO solution is becoming more and more transparent within 20 min.The dispersion became fully transparent after UV irradiation for 60 min,as the GO nanosheets could be completely degraded to CO2[22].The process of the photo-Fenton etching can be monitored by AFM.Figs.2b-f show the AFM images of the PGO-t1.After irradiation for 5 min,several small holes could be observed.As the etching time increases,more and more holes appear on the surface of the nanosheets,and the size of the holes is also becoming larger.Being etched for 25 min,the nanosheets could transform to graphene quantum dots (GQDs) (Fig.S1 in Supporting information).This is consistent with the results reported by Zhouet al.[21].
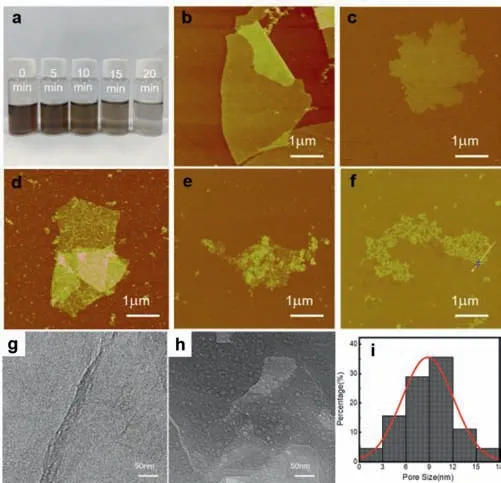
Fig.2.Morphologies of PGO-t1.(a) Optical image of GO dispersions with different photo-Fenton reacting times.AFM images of (b) GO (PGO-0 min),(c) PGO-5 min,(d) PGO-10 min,(e) PGO-15 min and (f) PGO-20 min.SEM images of (g) GO and (h)PGO-5 min.(i) Pore size distribution of PGO-5 min.
The degradation mechanism of GO to GQDsviathe photo-Fenton reaction has ever been released by Baiet al.[24].The abundant oxygen-containing groups make GO well dispersed in water.Under the photo-assisted catalysis of Fe3+/Fe2+,H2O2can be decomposed into hydroxyl radicals (·OH),which has a high redox potential (E0(HO·/H2O)=2.73 V) [22].Hydroxyl radicals will further oxidize GOviaboth the conversion of oxygen moieties to higher oxidation states and the electrophilic addition to unsaturated bonds.So the etching is going on along the oxygencontaining groups and makes the GO nanosheets holey and/or tiny.
Figs.2g and h present the SEM images of GO and PGO-5 min and Fig.2i is the pore size distribution of PGO-5 min.Discrete circular pores could be obviously observed from the SEM image,which has a distribution range from 1 nm to 18 nm.The average pore size is about 8.9 nm.
As shown in Fig.3,chemical analysis of PGO-t1was performed using XPS,FTIR and Raman.Fig.3a are the XPS full-scan profiles of GO and PGO-t1,in which only C and O peaks are observed.Fe signals are absent,indicating a fully removal during the dialysis process.Figs.3b-f show the C 1s spectra of GO and PGO-t1.There are four peaks observed for GO located at 284.8,286.4,287.2 and 288.5 eV,corresponding to C=C/C–C in aromatic rings,C–O(epoxy and alkoxy),C=O (carbonyl) and COOH (carboxyl) groups respectively [21].As the etching goes on,the intensity of the peaks corresponding to alkoxy,epoxy,and the carbonyl groups rapidly decreased,but the intensity of the peak corresponding to carboxyl groups remained relatively stable.It indicates that the etching is violent and could convert the alkoxy,epoxy,and the carbonyl groups into carboxyl groups,and further oxidize the carboxyl groups to CO2[24].The amount of carboxyl groups could remain stable at a proper stage.
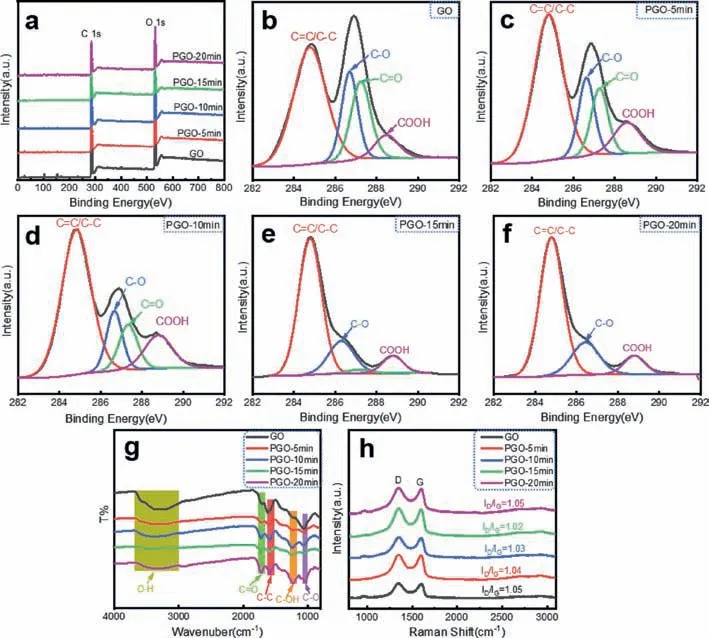
Fig.3.Chemical analysis of PGO-t1.(a) XPS full profiles.High-resolution C 1s spectra of (b) GO,(c) PGO-5 min,(d) PGO-10 min,(e) PGO-15 min and (f) PGO-20 min.(g)Raman spectra.(h) FT-IR spectra.
Fig.3g shows the FT-IR spectra of GO and PGO-t1.Compared with the peak corresponding to C–O stretching (1058 cm-1),the peaks related to carboxyl groups including C=O stretching (1726 cm-1) and C–OH stretching (1228 cm-1) gradually increase with the progress of photo-Fenton etching,which also indicates the conversion of alkoxy groups and epoxy groups to carboxyl groups.Furthermore,Fig.3h shows the Raman spectra of GO and PGO-t1.The G peak (~1580 cm-1) is related to the E2gvibrational mode and the D peak (~1350 cm-1) is activated by the presence of defects.The values ofID/IGof PGO-t1were calculated in the range of 1.02 to 1.05,which is relatively stable and hard to get useful information [25].
Hydrothermal could convert GO to RGO.Fig.4 shows the chemical analysis of PRGO-t1-t2using Raman and XPS.Fig.4a is a field emission SEM image of a typical sensor assembled from PRGO-5 min-6 h supported on an IE.The 2D layer of PRGO-5 min-6 h bridges the strip of the IE.Fig.4b shows the Raman spectra of RGO-1 h and PRGO-t1–1 h.The values ofID/IGwere calculated to be in the range of 1.03 to 1.14,slightly higher than the values of PGOt1illustrated in Fig.3h,indicating a slight recovery of sp2clusters upon 1 h reduction [12].
Fig.4c shows the conductance responses of RGO-1 h and PRGOt1–1 h toward 5 ppm NO2.NO2gas sensing of graphene and its derivatives is mainly due to the change of carrier density caused by the adsorption of gas molecules [10,11].The residual carboxyl group in PRGO generates holes in the conduction band.NO2molecules (p-type dopants) will increase the hole concentration and significantly improve the conductance value [26].In Fig.4c,the response value of PRGO-5 min-1 h is the highest,up to 318%,34 times higher than that of RGO-1 h.As the etching time increases,the response increased sharply from the bottom value of RGO-1 h to the peak value of PRGO-5 min-1 h,then varied slowly.
The above trend can be explained by the density change of vacancy defects.The increase in vacancy defect density and the carboxyl groups on the edge can enhance the adsorption of NO2molecules,which has been proved by theoretical simulation calculations [2,15-17].The amount of the sensing layer strongly affects the performance of the PRGO-based gas sensor.The thinner of the PRGO layers,the better is the sensing performance (Fig.S2 in Supporting information),which is consistent with the simulation results [27].In thicker samples,holes are effectively confined near the surface.In addition,the response of PRGO is also related to the reduction degree.Figs.4d-i are the XPS full scan profile and C 1s spectra of PRGO-5 min-t2.The alkoxy and epoxy groups were rapidly reduced during the reduction process.However,the strength of the peak corresponding to carboxyl groups did not change so significantly,indicating a slower reduction than those of the alkoxy and epoxy groups [28].In addition,during the process of hydrothermal reduction (Figs.S3a-d in Supporting information),the degree of reduction increases with the increased amount of deionized water [23].The higher of the reduction,the higher is the sensing performance (Fig.S4 in Supporting information).
Fig.5 illustrates the typical gas sensing performance of PRGO.Fig.5a shows the response of the gas sensor based on PRGO-5 mint2toward 5 ppm NO2.As the reduction time increases,the response first increased and then decreased,reaching a peak at the reduction time of 6 h.This result is related to the combined effect of the amount of residue carboxyl groups and electrical conductivity.Figs.4d-i have shown that some weaker alkoxy and epoxy groups could be reduced to increase overall conductance; while more stable carboxyl groups were reduced at a slower speed.They ultimately lead to a peak response at the reduction time of 6 h.Namely,the highest response,up to 1170%,was obtained in the sample of PRGO-5 min-6 h.
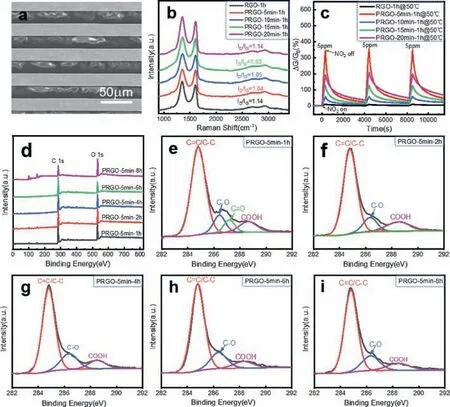
Fig.4.Chemical analysis of PRGO-t1-t2.(a) SEM image of IE-supporting PRGO-5 min-6 h.(b) Raman spectra of RGO-1 h and PRGO-t1–1 h.(c) Comparison of the responses of RGO-1 h and PRGO-t1–1 h toward 5 ppm NO2.(d) XPS full profiles of PRGO-5 min-t2.High-resolution C 1s spectra of (e) PRGO-5 min-1 h,(f) PRGO-5 min-2 h,(g) PRGO-5 min-4 h,(h) PRGO-5 min-6 h and (i) PRGO-5 min-8 h.
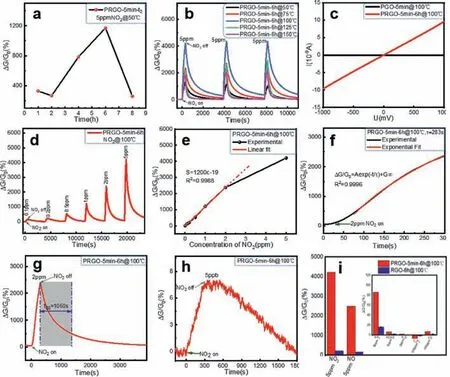
Fig.5.Gas sensing performance of PRGO-t1-t2.(a) Responses of PRGO-5 min-t2 versus reduction time.(b) Responses of PRGO-5 min-6 h at different temperatures.(c) I-V curves of PGO-5 min and PRGO-5 min-6 h in pure N2.(d) Cyclic responses of PRGO-5 min-6 h upon exposure to NO2.(e) Responses of PRGO-5 min-6 h versus NO2 concentrations.(f) Exponential fitting of the responses of PRGO-5 min-6 h toward 2 ppm NO2 (τ =283 s).(g) Analyses of recovery time of PRGO-5 min-6 h (t80=1060 s); (h) Response of PRGO-5 min-6 h toward 5 ppb NO2.(i) Responses of PRGO-5 min-6 h toward other gasses.All the feeding time of the target gas was 300 s.

Table 1 Performance comparison of the NO2 sensors based on different types of graphene materials.a
The response of PRGO is also related to the testing temperature.Theoretically,an appropriate increase in temperature can accelerate the electron transfer process from PRGO to NO2.For example,when the temperature increases from 25 °C to 100 °C,the resistance of the gas sensor based on PRGO-5 min-6 h decreased by 5.5 times (Fig.S5 in Supporting information).Fig.5b shows the effect of the testing temperature on the response of PRGO-5 min-6 h toward 5 ppm NO2.With the increase of temperature,the response increases firstly and then decreases.Especially,the response increases from 1170% to 4300% as the testing temperature increased from 50°C to 100°C,an enhancement of about 2.7 times.However,when the temperature is higher than 100°C,the desorption of NO2gas molecules dominates,and the response decreases [20].Fig.5b indicates a good repeatability of the gas sensor.The reduction degree will definitely affect the stability of the gas sensor at an elevated temperatures,namely,PRGO-5 min-6 h will be much more stable than PRGO-5 min-1 h.When tested at the temperature of 100 °C,the conductance of PRGO-5min-1 h increases slowly (Fig.S6 in Supporting information).It is due to that its limited reduction was further progressed.The conductance of PRGO-5 min-6 h is much higher than that of its un-reduced state,PGO-5 min (Fig.5c).
Fig.5d shows the response of PRGO-5 min-6 h toward NO2gas with a concentration ranging from 100 ppb to 5 ppm.The testing temperature is 100°C.The response of the sensor toward 100 ppb and 5 ppm NO2is 126% and 4300% respectively.As shown in Fig.5e,the sensor exhibits good linearity in the concentration range of 5 ppb–2 ppm.The slope of the linear fitting curve is defined as the sensitivity of the gas sensor.Table 1 lists the comparison of different types of graphene materials in recent years [12,14,20,29-35].We found that they could seldom detect NO2at the concentrations lower than 20 ppb and their sensitivity are rarely above 10 ppm-1.Fig.5e shows that our gas sensor has an exceptionally high sensitivity,climbing to 12 ppm-1(a response of 2400%to 2 ppm NO2at 100°C),which is,to our knowledge,the highest value of the RGO-based NO2gas sensors.Moreover,when tested toward NO2with randomly varying concentrations,the sensor still exhibits excellent performance (Fig.S7 in Supporting information).In terms of LOD,the signal value needs to be at least three times the noise,so as to distinguish the signal clearly.According to this rule,the theoretical LOD of PRGO-5 min-6 h was calculated using a sensitivity of 12 ppm-1and the root-mean-square (RMS) noise(LOD=3RMS/sensitivity).The theoretical LOD of PRGO-5 min-6 h is as low as 0.66 ppb (Table 1,Fig.S8 and Table S1 in Supporting information),which is lower than most of the current graphenebased NO2sensors.
whereτandG∞are the time constant and steady-state conductivity value respectively.
The fitting results are shown in Fig.5f,which indicates that the time constant of the (PRGO-5 min-6 h)-based sensor isτ=283 s(toward 2 ppm NO2).The recovery time is another index to evaluate the recovery speed of the sensor.Here we uset80to define the recovery time,which is the time required for the signal change approaching to 80% of the total response during the recovery process.As shown in Fig.5g,thet80recovery time is 1060 s.We also found thatτandt80were dependent on the concentration of NO2,for example,when sensing toward a higher concentration of 5 ppm NO2,τandt80were calculated as 189 and 1275 s (Figs.S9b and d in Supporting information),respectively,indicating a faster response speed and a slower recovery speed.It can be explained by the kinetics of the adsorption and desorption process.Higher concentrations can accelerate the adsorption speed,but it takes longer time to be desorbed.As a comparison,a sensor based on RGO-6 h was also tested toward 5 ppm NO2,whoseτandt80are 236 and 1828 s (Figs.S9a and c in Supporting information) respectively.Both are longer than PRGO-5 min-6 h.It indicates that both the response and recovery process are accelerated after the photo-Fenton etching and water-vapor reduction.
Compared with PRGO-5 min-6 h,hydrothermal reduced at 180°C for 6 h,whose recovery time is 1275 s (Fig.S9d),the recovery times of PRGO-5 min-12 h (hydrothermal reduced at 180°C for 12 h) and PRGO-5 min-6 h/200 °C (hydrothermal reduced at 200°C for 6 h) are 288 s and 196 s (Figs.S9e and f in Supporting information),respectively.The recovery speed is increased by 3.42 and 5.5 times,respectively.That is to say,extending the reduction time or increasing the reduction temperature can effectively improve the recovery speed due to the further reduction of the carboxyl groups[23].However,the peak response of the sensors based on PRGO-5min-12 h and PRGO-5 min-6 h/200 °C drop to 1900% and 740%,respectively.So the existence of carboxyl groups also plays a great role in increasing the sensitivity of the sensors.
Since the theoretical LOD of PRGO-5 min-6 h is as low as 0.66 ppb,we put the sensor to an atmosphere with the experimentallyultralow concentration of 5 ppb NO2.As shown in Fig.5h,the sensor exhibits a clearly distinguishable signal corresponding to a value change of 6.8%,which experimentally proves the excellent detecting ability of the gas sensor to trace amount of NO2.
The selectivity of a gas sensor is its relatively much higher sensitivity to one target gas than to the other gasses.As shown in Fig.5i,the selectivity of the gas sensor based on PRGO-5 min-6 h was comparatively studied toward 5 ppm NO2(4300%),5 ppm NO(2500%),5 ppm NH3(80%),5 ppm HCHO (6.5%),5 ppm H2S (<1%),100 ppm C2H2(-6.52%),and 100 ppm CO (6.8%).At ppm or higher levels,the sensor is dominantly sensitive to NO2than to the other common gasses like NH3,HCHO,C2H2,CO.It is nearly inert to H2S.The relatively high sensitivity toward NO is because NO is very similar to NO2from the aspects of the polar structures and the molecular properties.
The response to 100 ppm C2H2is negative in the opposite direction,while the response to 5 ppm NH3is positive in the same direction with NO2.This is somewhat different to the reported results of other graphene- or RGO-based gas sensors [29].We tested the response of RGO which was water-vapor reduced from GO in the same way as PRGO-5 min-6 h,as well as the response of a graphene synthesized by mechanical exfoliation.The former is also positive but the latter is negative (Fig.S10 in Supporting information).This means that the poorly reduced state of GO (i.e.,the defects of graphene) make the response behavior reverse.Theoretical calculations have shown that,compared with NH3,the adsorption energy between NO2molecular and graphene vacancy is much stronger [15,36,37].So,the vacancy defects of PRGO,as well the residue functional groups like carboxyl,selectively enhance their interaction with NO2molecules,through enhanced induced forces or hydrogen bonds (Fig.S11 in Supporting information).
In a summary,we have fabricated a high-performance NO2gas sensor based on defective PRGO through a fast and controllable way.The photo-Fenton reaction was selected for fast etching vacancy defects and the hydrothermal reduction was used to tune the functional groups.PRGO-5min-6 h exhibits superior sensing performance toward NO2,with an exceptional sensitivity up to 12 ppm-1.The theoretical LOD is as low as 0.66 ppb and the measured sensitivity is 6.8% toward 5 ppb NO2.The good sensing performance is mainly due to the vacancy defects and carboxyl groups.The sensor also exhibits excellent properties such as good selectivity,good linearity,and wide linear range.This work not only provides a new method to fabricate high-performance gas sensors,but also presents a new view to optimize the gas sensing properties of RGO with chemical modification and defects regulation.
Declaration of competing interest
The authors declare that they have no known competing financial interests or personal relationships that could have appeared to influence the work reported in this paper.
Acknowledgment
The research was financially supported by National Natural Science Foundation of China (No.52073302).
Supplementary materials
Supplementary material associated with this article can be found,in the online version,at doi:10.1016/j.cclet.2022.02.003.
 Chinese Chemical Letters2023年1期
- Chinese Chemical Letters的其它文章
- Diabetic wound healing activated by supramolecular cascade reaction
- MBenes: Two-dimensional transition-metal borides with ordered metal vacancies
- Wet-adhesive materials of oral and maxillofacial region: From design to application
- Diverse catalytic systems for nitrogen-heterocycle formation from O-acyl ketoximes
- Fluorine-containing drugs approved by the FDA in 2021
- The development and application of dual-comb spectroscopy in analytical chemistry
