The development and application of dual-comb spectroscopy in analytical chemistry
Ziheng Wei,Xinyi Ren,Ming Yn,Hulie Zeng,*
a Department of Pharmaceutical Analysis,School of Pharmacy,Fudan University,Shanghai 201203,China
b State Key Laboratory of Precision Spectroscopy,East China Normal University,Shanghai 200062,China
Keywords:Dual-comb spectroscopy Infrared spectrum Raman spectrum Spectral analysis Gas detection
ABSTRACT Analytical chemistry plays an important role in the qualitive and quantitative analysis for molecules in the various circumstances,especially for the high-resolution analysis.The dual-comb spectroscopy (DCS)technology with the characteristics of high resolution,high sensitivity and instantaneous sampling exhibited a great potential in high-resolution in-situ spectral methods and has been active in the fields of spatial ranging,air composition analysis,reaction monitoring and so on.In this review,we will summarize the principle of DCS according to the different wavelength coverage and overview the applications of DCS in analytical chemistry.
1.Introduction
The ultrashort pulse laser provides a new technical means for precision spectroscopy with the great progress of laser science.At the latter half of 20thcentury,the femtosecond pulse laser with ultrahigh time resolution makes it possible to explore ultrafast physical regularities to obtain the characteristic information of atoms and molecules and to inspect the energy transfer between the molecules.The optical frequency comb (OFC),an evenly spaced ultrashort laser pulse sequence in the time domain or a continuous and equal spaced spectral line with the same interval in the frequency domain,was conceived to directly detect the frequencies such as acting as the optical atomic clocks,carrying out the precision laser spectroscopy and performing the ultra-precision ranging.Based on the foundation of the above OFC,the dual-comb spectroscopy (DCS) utilized two OFCs with a tiny difference in frequency was well developed in recent decades,it possesses the unparalleled advantages such as wide spectral coverage,high detection sensitivity,high resolution and fast measurement.The above characters of DCS made it a promising technology with impressive comprehensive performance and was acted as a predominant optical frequency measurement tool like the instantaneous highresolution spectrum.
2.Dual-comb spectroscopy (DCS)
2.1.The principle of optical frequency comb
OFC was identified as an evenly spaced ultrashort laser pulse sequence in the time domain or a continuous and equal spaced spectral lines with the same interval whose value is equal to the repetition frequency of the pulse sequence in the frequency domain [1].In this way,OFC could be considered as a ruler with a large number of equally spaced and wide-range spectral lines which serve as the natural "scale" for spectral analysis.Hence,OFC was also called the optical frequency ruler while its narrow line width can be used to obtain a high resolution and to act as the foundation of precise spectral analysis.
The basic principle of OFC is shown in Fig.1.A continuous,evenly spaced ultrashort pulse sequence was generated from a femtosecond laser.The period of the pulse (Tτ) was the time for a round trip in the pulse cavity.Each individual pulse duration contained the carrier signal of multiple optical periods and their propagation speed were slightly different.The transmission speed of the overall pulse envelope was identified tovgand the transmission speed of the carrier signal was set tovp.In this case,the difference in speed led to a phase difference (Δφ) between the carrier signal and the overall envelope,which was also called the carrier envelope phase.
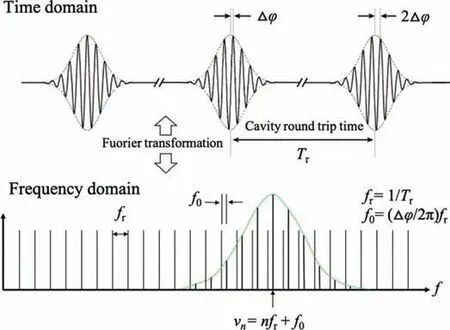
Fig.1.The principle of OFC.
According to the Fourier transform,the periodic pulse sequence in the time domain could be converted into a comb-shaped frequency scale in the frequency domain.The repetition frequency (fr)could be reciprocated to the round-trip time (1/Tτ),while the frequency of the carrier envelope phase could set as the carrier envelope phase offset frequency (f0),which was caused by the overall offset of the comb teeth.If the precise control offrandf0can be realized,the zero scale and unit length of the ruler would be precisely controlled.By this way,OFC could act as an ideal tool for precise measurement of optical frequency [2].
There were three main methods to generate optical comb: (1)Directly utilizing the femtosecond mode-locked laser to generate the optical comb [3]; (2) Adopting the narrow linewidth continuous laser modulation to produce the optical comb [4]; (3) Using the continuous laser microcavity oscillation to generate the optical comb [5].Among the above three methods,the femtosecond mode-locked laser was mostly the mainstream optical comb generation method.The super high stability and measurement accuracy could be achieved for the reducing of the influence of environmental noise through the optical comb locking process.For their outstanding contributions in this research,J.L.Hall [6] and T.W.Hansch [7],two main funders of OFC,were awarded the 2005 Nobel Prize in Physics.
The remarkable traits of broadband,narrow linewidth and high stability of OFC have drawn great attention for the main opportunities to develop the precise laser spectroscopy.Several new spectral techniques were developed on the base of OFC in the past ten years.For instance,OFC can be used as the coherent light source of the Fourier transform spectrometer to improve the performance of detection [8,9].The sensitivity of the spectrum generated by the cavity ring-down spectroscopy (CRDS) can be greatly improved by coupling OFC with the optical cavity [10].Actually,resolving each individual comb tooth is still challengeable to fully comprehend the information provided by the OFC structure.Although coupling the comb light into conventional spectrometers has already been realized,the comb teeth is still spaced so fine that almost spectrometers can only receive the signal as a bright collimated light source and lost the highly resolution of highaccuracy OFC.So far,several high-resolution spectrometers have been developed,such as virtually imaged phase array (VIPA) spectrometers [9,11,12],comb-cavity Vernier spectrometers [10,13] and high-resolution FTIR spectrometers [8,14-17].Within,DCS could be counted as the most representative spectral technology for its high efficiency and simple structure with the character of easy-toimplement [18].
2.2.The principle of DCS
At present,Fourier transform spectroscopy (FTS) is the most common technology in the field of spectrum detection.The traditional spectrum could be achieved by the interferograms of two coherent beams of Michelson interference after the Fourier transformation,those were respectively the moving arm and the static arm [19].With the development of OFC,the pulse sequence of OFC output was divided into two beams by a half mirror to act as the light source of FTS.Within,these two beams were reflected by the moving mirror and the static mirror respectively and modulated into the moving arm and the static arm to get the interferogram.In the case of DCS,the two OFC beams with slightly different repetition frequencies were utilized to replace the moving arm pulse and the static arm pulse of coherent beams as shown in Fig.2 [20].The pulse signals of the two OFC would “cross through each other”in the time domain due to the difference in repetition frequency to obtain interrelated interferograms [21].
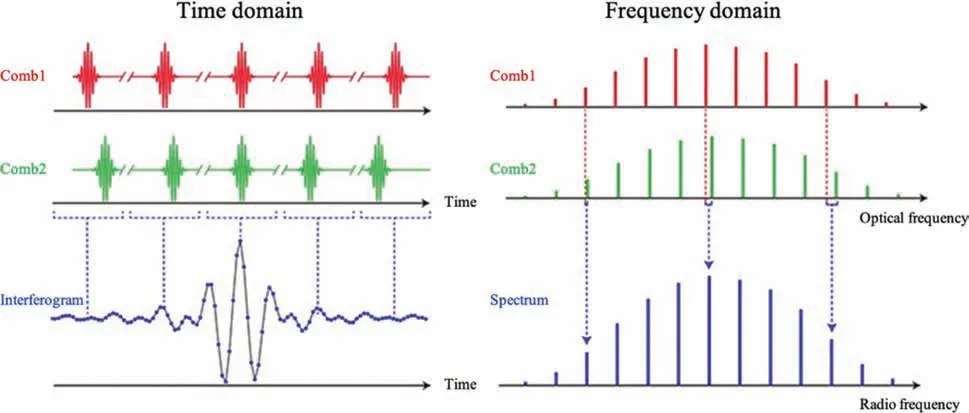
Fig.2.The pulses from the two combs generated interferometric signal in the time domain and in the frequency domain.Copied with permission [20].Copyright 2022,Takuro Ideguchi.
Generally,DCS can be cataloged into two types according to the difference of the detection light.The first type of DCS can directly beat the pulses of the two OFC to detect the sample whose signal was symmetrical and only the amplitude response can be obtained after Fourier transformation [20].The other type DCS let one OFC pass through the sample as the probe light to beat with the other reference OFC to obtain the amplitude response and the phase spectrum of the sample after the Fourier transformation.In this case,the probe light carried the fingerprint information of the sample [22].Usually,the latter DCS system was more adopted in practice.
2.3.The development of DCS
DCS has drawn great attention for its ultrashort acquisition time,impressive signal-to-noise (SNR),high resolution and accuracy recently [23–26],but the realization of high- repetition and high-precision DCS is still challengeable for the difficulty in realization of two OFCs with extremely high correlation.The reason was that the carrier signal cycle was as short as in femtoseconds,which meant that a tiny timing pulse jitter or phase fluctuation between the two OFCs would cause the distortion of the interferogram.And this kind of distortion could hardly be eliminated through subsequent data processing [22].This further made the entire system difficult to improve the signal-to-noise ratio through coherent averaging.Although the concept of optical comb was proposed by researchers very early,it was not experimentally verified for the first time until 2004 [24].
Actually,three representative methods have been explored so far: (1) A high degree of mutual interference could be realized to achieve coherent averaging by improving the absolute coherence of the two OFCs to act as the coherent DCS [27–29]; (2) The postprocessing to eliminate interference pattern distortion by real-time monitoring of the pulse fluctuation and phase shift of the system to settle as the adaptive DCS [30–33]; (3) The DCS system was constructed by the natural mutual interference by dividing the light source of the same OFC into two pulse sequences with small differences in frequency,which was also known as single optical comb DCS [34–39].In order to achieve the absolute coherence of the two OFCs,the adaptive DCS system was demanded to be tracked and monitored the optical comb in real time,and corrected it through a subsequent processing with the support of the highperformance circuit and algorithm.In contrast,the single optical comb DCS only consisted of a simple structure with a low cost to obtain two highly interrelated pulse sequences,which had become the main method used in current DCS research.How to construct a stable and compact mode-locked laser and generate the required two pulse sequences became the main research direction to have the practical DCS spectrum.
3.Traditional infrared spectroscopy
Infrared light refers to a kind of electromagnetic radiation whose wavelength is greater than visible light and the wavelength ranges from 760 nm to 106nm.Generally,infrared region is divided into three parts according to the wavelength:the near-infrared region with a wavelength of 0.75~2.5 μm,the mid-infrared region with a wavelength of 2.5~25 μm,and the far-infrared region with a wavelength of 25~1000 μm.The two most common spectra,infrared absorption spectroscopy and Raman spectroscopy,were developed among mid-infrared and nearinfrared range since 1800.
3.1.Principle and applications of infrared absorption spectroscopy
An energy level transition of the molecule from low level to high level would occur when the energy of electromagnetic radiation is close to the vibration or rotational energy of molecule and the electromagnetic radiation at certain wavelength would be absorbed to have its absorbance spectrum.Actually,not all molecular vibrations have the mid-infrared and near-infrared absorption unless the following two factors: (1) The radiation energy exactly matches molecular vibration or rotational energy; (2) The movement of the molecular dipole exits during the molecular vibrations.In general,the near-infrared spectrum mostly indicates the combined frequency peaks or the double frequency peaks of target molecule; the mid-infrared spectrum mostly shows the fundamental frequency vibration peak of molecules; the far-infrared spectrum mostly exhibits the rotational spectrum and the vibration spectrum of specific groups of target molecule.Since the fundamental frequency absorption bands of most organic and inorganic substances are in the mid-infrared region,the technology and application of mid-infrared spectroscopy are the most mature,while the infrared spectrum usually refers to the mid-infrared spectrum.It is remarkable that the near-infrared spectroscopy had been received increasing attention and was widely adopted in agriculture,medicine and other fields for its noninvasive and on-site detection with the accumulation of data treatment in recent years.No matter near-infrared or mid-infrared spectroscopy,most Fourier transform infrared spectroscopy was developed on the foundation of Michelson interference as shown in the above.
3.2.Principle and applications of Raman spectroscopy
When a beam of light passes through the transparent medium,its most part will be scattered as the same frequency as its original frequencyv0and the small part will be changed to the other frequencies.The former is called Rayleigh scattering and the latter is called Raman scattering.The collected Raman scattering of the molecule was nominated as the molecular Raman spectrum,which are symmetrically distributed on both sides ofv0.Usually,the smaller frequency side is called Stokes line,and the larger frequency side is called anti-Stokes line.In the other way,the Stokes line would be formed when the absorbed energy by the molecule is greater than the energy it released,while the anti-Stokes line would be formed when the energy absorbed by the molecule is less than the energy it released.Since the number of molecules at high levels is often less than that at low levels,the intensity of the Stokes line is usually much higher than that of the anti-Stokes line[40].In addition,the Raman absorption near the two sides of the Rayleigh scattering line are small Raman spectra,and the spectra far from the two sides are large Raman spectra.The former is generated by the rotational energy level of the molecule,and the latter is induced by the vibration-rotation energy level of the molecule.It is worthy to notice that Raman scattering occurs only when the molecular polarizability changes with the molecular vibration,the molecules with nonpolar fully symmetric vibrations usually having strong Raman activity.In this way,Raman spectroscopy and ordinary infrared spectroscopy are complementary.Infrared spectroscopy is usually used to study the asymmetric vibration of polar groups,while Raman spectroscopy is often used to study the symmetric vibration of non-polar groups.
4.Potential of DCS in real-time and high-resolution molecular spectroscopy
FTS has been widely adopted for its high resolution and high signal-to-noise ratio (SNR),however,the delay of data acquisitiondue to the long acquisition time seriously affects its applications in the real-time detections.

Table 1 Citations in this review categorized by spectral coverage.
The DCS system was utilized to replace the traditional mechanical motion scanning with the development of OFC technology recently.The stability of the spectroscopy system was greatly improved and the interferogram could be continuously updated automatically,which directly overcame the shortcomings of the traditional FTS adopted mechanical arms.Its acquisition time in microseconds could basically support the real-time refresh,and the real-time sampling in theory [10].In traditional FTS system,the system noise was positively correlated to the reciprocal of the frequency so that the SNR could be obtained in the high frequency in the measurement of beat signal.The Doppler effect introduced by the moving arm in the traditional FTS made the two beams of pulses separated by the semi-transparent mirror just could have the difference in the repetition frequency at low frequency level,which also led to a beat signal at low frequency band.In contrast,the DCS system governed OFC could finally obtain an extremely high repetition frequency than that of FTS.This led to a significant progress in SNR of DCS,which could be evaluated by the quality factorFSNR.The larger theFSNRis,the higher the SNR of the spectrum is [41].Actually,more than 103times of theoretical signal to noise ratio of DCS could be obtained comparing with that of the traditional FTS [42],which could greatly enhance the spectral resolution of DCS to 100 MHz [27].The resolution of DCS could even reach hundreds of kHz through pulse phase modulation method[43] and spectral interleaving method [44–47].
4.1.Development of DCS on high-resolution real-time detection
Researches around DCS systems have taken place in different bonds in Table 1,such as near-infrared and mid-infrared bands,ultraviolet and deep ultraviolet bands [48],visible light band [49,50]and THz DCS [51–53].Among these,most studies about DCS are focused on the near-infrared and mid-infrared spectrum since the molecular absorptive bands contain a lot of molecular vibration information including ‘molecular fingerprint region’in recent years[54].
4.1.1.Application of DCS near-infrared absorption spectroscopy
The spectral absorptive bands in the near-infrared region involve the differential and doubling frequency peaks of molecular fundamental absorption of groups in the mid-infrared region such as C-H,O-H and N-H [55].However,only the DCS of gas molecules with good transmittance,strong absorption peak and narrow absorption peak width in the near infrared region have been investigated for shortcoming of currently technical limitations.Primarily,a stabilized DCS system was established with a detection range from 1495 nm to 1620 nm and with the frequency intervals of 155,000 Hz,the rotational-vibrational band of H13C14N was measured spanning 192-197 THz with 120 of SNR for the absorption peaks in Fig.3.The time-domain response of target molecule could be characterized in high resolution and high SNR using the developed DCS system [27].The basic SNR equation of this DCS system was derived to guide the design of DCS system in the future [41].The absorption spectrum of CH4molecule was then measured with a high resolution less than 10 kHz [56],which was 10 times higher than that of the traditional FTS.Subsequently,the bandwidth of DCS was further broadened to 9 THz to detect the C-H overtone stretch vibration in HCN with a super high SNR of 0.5×10⁶in Fig.4 [57].Through the cavity-enhanced DCS,the limit of detection could be improved,even as low as 10-12magnitude [58].
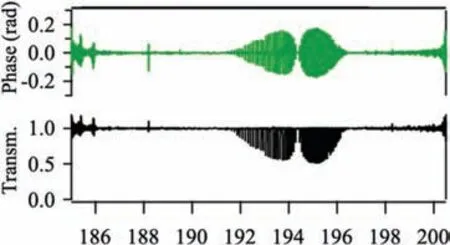
Fig.3.Measured transmission (black) and phase [gray (green)] spectrum for HCN spanning 15.5 THz of optical spectrum (from 1495 nm to 1620 nm).Copied with permission [27].Copyright 2022,APS.
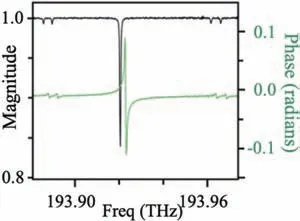
Fig.4.The corresponding frequency-domain response magnitude (black) and phase(green,offset for clarity) of a single H13C14N molecular line,demonstrating the high SNR and flat baseline.Copied with permission [57].Copyright 2022,Optica Publishing Group.
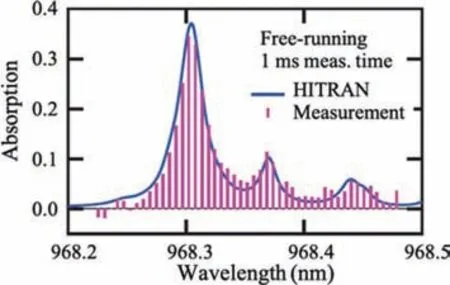
Fig.5.The absorption measurement of water vapor acquired by the DCS system and comparison with the HITRAN database.Copied with permission [60].Copyright 2022,The American Association for the Advancement of Science.
Furthermore,the DCS system was designed to realize the composition analysis of greenhouse gases in the open-air in 2014.Around 60 nm of spectral width was obtained for CH4and CO2capture,which successfully confirmed the complex multicomponent analysis ability of DCS.This exhibited the potential of DCS in portable detection to get rid of the constriction in laboratory [59].In addition,the fine characteristic spectrum of water vapor also was obtained through the DCS system in Fig.5 [60].
In addition,The DCS can be adopted to characterize the complex optical properties of solid samples,too.The fine real and imaginary parts of the refractive-index spectra due to the Er3+dopant was clearly obtained with a high resolution in GHz in the near-infrared region,and the refractive index and the thickness of the silicon semiconductor wafer was successfully determined [61].
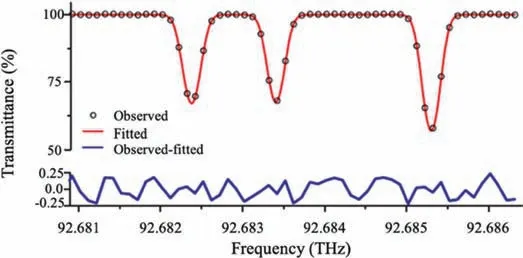
Fig.6.The transmittance spectrum of 12C2H4 acquired by the DCS system.Copied with permission [63].
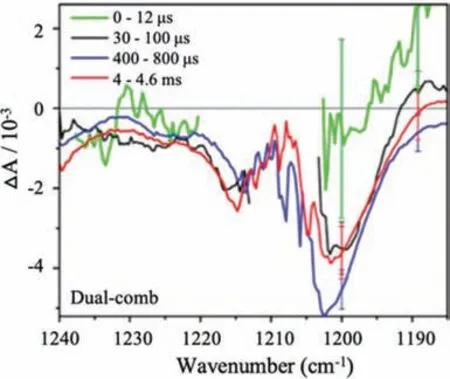
Fig.7.Spectra from single-shot experiment with dual-comb spectroscopy at 8 cm-1.The standard deviation of difference absorbance over 50 shots is shown as error bars at 1200 and 1189 cm-1.Copied with permission [65].Copyright 2022,ACS.
4.1.2.Application of DCS in mid-infrared absorption spectroscopy
The molecular absorption in mid-infrared region can be counted to the strongest spectral information for the vibration absorption of nearly all kinds of molecules,which is around 1-2 orders of magnitude higher than that in the near-infrared range.The high sensitivity was more suitable for material detection including gas molecules [11],therefore,many near-infrared DCS technologies were successfully transferred into the mid-infrared region[24] with the help of the difference frequency generation (DFG)techniques.The spectral range of DCS was broadened to nearly 3 μm by electro-optic modulation and was utilized to measure the characteristic spectrum of CH4with a resolution of 115 MHz in a standard deviation as low as 0.7% in 2017 [62].The spectral resolution was further improved to 100 MHz and the C-H stretching vibration absorption spectra of C2H2and C2H4were successfully achieved as shown in Fig.6 [63].Furthermore,the rapid detection of mid-infrared DCS has been developed to measure the molecular fingerprints spectrum of N2O,in which the multiple isotope substitutes could successfully distinguished [64],which setup a solid foundation for the rapid analysis of precision spectroscopy through DCS system.
In addition,the ultrashort measurement time makes DCS possible to realize real time monitoring of chemical and biochemical reactions.The spectra and transients of the bacteriorhodopsin photocycle were simultaneously recorded by the mid-infrared DCS system with a time resolution of 320 ns and a lowest detection volume of 200 nL in the range of 1185-1240 cm–1in Fig.7 [55].
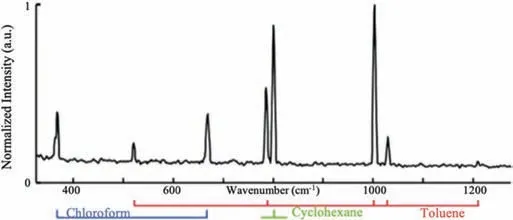
Fig.8.Dual-comb CARS spectrum of toluene,chloroform and cyclohexane with a mixing ratio of 1:1:1.Copied with permission [69].Copyright 2022,Optica Publishing Group.
However,the single measurement can barely acquire satisfying result for the instability of DCS system,the multiple coherent averaging is still required to improve the overall SNR and eliminate errors in most DCS spectroscopical systems.With the development of emerging technologies such as 3D tissue modeling[66] and organoid chips,increasingly high demands of noninvasive monitoring are raised for metabolomics and tumor microenvironment analysis.More stable DCS with ability of single measurement could been a trend in the near future.
4.1.3.Raman spectroscopic application of DCS
The dual-comb Raman spectroscopy has been developed after the infrared absorption spectroscopy.The DCS Raman spectroscopy technology based on multi-heterodyne femtosecond laser was first reported in 2012,and was successfully used to detect the C-H plane stretching vibration of cyanobenzene with a high sensitivity of 10-6,a resolution of 6.7 cm-1and a long measurement time of 350 μs [67].To shorten the measurement time of DCS Raman spectroscopy,a DCS broadband Raman spectroscopy technology was developed to realize the detection of xylene and cyanobenzene with a band range of 2950-3150 cm-1and the resolution of 6.7 cm-1just in a single spectrum measurement time of 2.99 μs [68].Consequently,the DCS Raman spectroscopy has been utilized to investigate the spectra of complicated mixture benzene,chloroform and cyclohexane with the improved resolution of 6 cm-1as shown in Fig.8 [69].In this case,the data acquisition of DCS Raman spectroscopy can be refreshed at a frequency of 2 kHz,which basically reach the requirement of real-time detection.
Sequentially,nonlinear DCS Raman spectroscopy with much high resolution,dual-comb coherent anti-Stokes Raman spectroscopy,was successfully established in 2017 and was used to monitor the retinoic acid [70].In this case,the resolution of nonlinear DCS Raman spectroscopy was improved to cm-1level and the measurement time was cut to around 400 ns.Coincidentally,the high resolution Raman spectroscopy detection of low density molecules has been realized with a resolution of 8 cm-1and a single measurement time of 32.8 μs [71].Furthermore,the dual-comb coherent anti-Stokes Raman spectroscopy was developed to monitor the label-free particle flow on the integrated chip,and more than 1000 particles could be detected per second [72].
Considering the complementarity of the infrared absorption spectroscopy and the Raman scattering spectroscopy,the complementary vibrational spectroscopy has been established to simultaneously realize the Raman detection and the DFG mid-infrared absorptive detection using two beams split from the same light source adopted dual-modal Fourier-transform spectroscopy and adopted to detect toluene [73].On the basis of the above DCS Raman spectroscopy,it is promising to realize DCS complementary vibrational spectroscopy in the near future.
4.2.Perspective of DCS spectroscopy
Current DCS technologies are still conducted in the nearinfrared range,and are mainly for gas detection.Regarding the application of DCS spectroscopy in analytical chemistry,the infrared spectroscopy acts as the method to the qualitative and quantitative analysis in the past years,and the Fourier transform infrared spectroscopy was the most widely utilized in the analytical chemistry.Specially,the near infrared spectroscopy that is capable of the good tissue penetration and the noninvasive detection exhibited a great potentialin vivodetection,even in the real-time detectionin vivolike exploring the drug metabolism in lives.In this case,the highresolution DCS have dominated the ability to identify the stereo isomers in the quality monitoring of drugs.By means of Lambert beer’s law,quantitative analysis can be practicable as well.However,further improvement in the resolution,sensitivity and stability to realize the real time detection is still challengeable.And the detections for the liquid and solid samples are also under development.It can be expected that the continuous development of DCS system will have a profound impact on the field of analytical chemistry.
Declaration of competing interest
The authors declare that they have no known competing financial interests or personal relationships that could have appeared to influence the work reported in this paper.
Acknowledgments
This work was financially supported by National Natural Science Foundation of China (No.21974030) and Medical Engineering Fund of Fudan University (No.XM03211184).
 Chinese Chemical Letters2023年1期
- Chinese Chemical Letters的其它文章
- Diabetic wound healing activated by supramolecular cascade reaction
- MBenes: Two-dimensional transition-metal borides with ordered metal vacancies
- Wet-adhesive materials of oral and maxillofacial region: From design to application
- Diverse catalytic systems for nitrogen-heterocycle formation from O-acyl ketoximes
- Fluorine-containing drugs approved by the FDA in 2021
- Boron: A key functional component for designing high-performance heterogeneous catalysts
