
Retinal neurodegeneration in metabolic syndrome: a spectral optical coherence tomography study
2023-03-04 10:00EvrimPolatEkremCelikMesutTogacAfsunSahin
Evrim Polat, Ekrem Celik, Mesut Togac, Afsun Sahin
1Department of Ophthalmology, Tekirdag City Hospital,Tekirdag 59100, Turkey
2Department of Ophthalmology, Tekirdag Namik Kemal University, Faculty of Medicine, Tekirdag 59100, Turkey
3Department of Ophthalmology, Koc University Medical School, Istanbul 34010, Turkey
4Research Center for Translational Medicine, Koc University,Istanbul 34450, Turkey
Abstract
● KEYWORDS: metabolic syndrome; retinal neurodegeneration;hypertension; diabetes mellitus; dyslipidemia; optical coherence tomography
INTRODUCTION
Metabolic syndrome (MetS) is a co-occurrence of several cardiovascular risk factors that are interrelated and share common pathophysiological pathways[1]. After the World Health Organization (WHO) first developed its definition in 1998 several definitions have been proposed which incorporate the main features of hyperglycemia, insulin resistance(IR), visceral obesity (VO), atherogenic dyslipidemia, and hypertension (HT). It is a worldwide epidemic with a high prevalence of 20%-25% in the adult population and the presence of more components of MetS was associated with an increased rate of subclinical atherosclerosis and incident coronary heart disease[2].
Retina is a neural tissue consists of cells with highly specialized neural function. A decrease in thickness of retina quantified by optical coherence tomography (OCT) is an indicative of retinal neurodegeneration. IR and VO, two major components of MetS, are found to be related to retinal neurodegeneration[3].The MetS cause high lipid and glucose levels, leading to the deterioration of homeostasis, increased lipid peroxidation,and oxidative stress. Visceral fat secretes pro-inflammatory cytokines such as interleukin-6 (IL-6) and tumor necrosis factor α (TNF-α) that are relevant to chronic inflammatory state and IR. Besides neuroinflamation, apoptosis driven by retinal glial cell reactivation plays a role in neurodegeneration.Moreover, retinal thickness is widely used as a biomarker in neurodegenerative diseases (NDDs) as a predictive value for diagnosis and prognosis. Patients’ cognitive status was thought to be associated with retinal neurodegeneration, and peripapillary retinal nerve fiber layer (pRNFL) and macular ganglion cell layer (mGCL) thickness was found decreased[4-5].Retinal neurodegeneration may have deteriorating effect on visual functions. It has been demonstrated that color vision and contrast sensitivity are reduced in patients with reduced inner retinal thickness[6-7]. Several studies confirmed that RNFL and GCL thickness reduction precede functional deficits[8-9].There is no proven treatment for retinal neurodegeneration but ongoing studies are aiming to provide evidence for treatment and neuroprotection[10-11].
There are many studies on the effects of MetS criteria such as HT, diabetes mellitus (DM), VO, and dyslipidemia on the retina[3,12-14]. There are few studies of neurodegeneration in MetS and only one study evaluating both macular and pRNFL thickness[15-17]. To our knowledge, this is the first study to evaluate the effect of MetS on pRNFL, macular thickness, and the association of increased MetS component count on retinal neurodegeneration.
SUBJECTS AND METHODS
Ethical ApprovalThe study was reviewed and approved by the Namık Kemal University Ethics Committee (2020.109.05.10),and after detailed information was given. The study was conducted following the tenets of the Declaration of Helsinki.Written informed consent was obtained from all subjects.
This was a single-center, cross-sectional observational study conducted at Tekirdağ City Hospital Ophthalmology Department between May 2020 and June 2021. All participants were recruited from the internal medicine department. MetS diagnosis was based on the revised National Cholesterol Education Program (NCEP) Adult Treatment Panel III guideline[18]. According to this definition, subjects who met at least 3 of 5 following criteria was diagnosed as MetS: fasting plasma glucose ≥100 mg/dL or treatment for previously diagnosed type 2 DM, VO (waist circumference ≥102 cm in males, ≥82 cm in females), systemic blood pressure≥130/85 mm Hg or treatment for previously diagnosed HT,high-density lipoprotein (HDL) cholesterol <40 mg/dL in males, <50 mg/dL in females or specific treatment for this,triglycerides (TG) ≥150 mg/dL or specific treatment for this.All subjects’ 24-hour fasting blood tests within 3mo were checked.
After the subjects rested for 10min in a sitting position,systemic blood pressure was measured with a mercury manometer (Erka, Germany) twice with half an hour interval.To measure waist circumference, the arms were opened in a relaxed position, and at the end of normal expiration, the midpoint between the iliac crest and the lowest point of the thorax was measured with a tape measure adjacent to the first centimeter. The study group was diagnosed as MetS by an internal specialist and subjects with any systemic disease other than DM, HT, VO, dyslipidemia, and smokers were excluded.The control group (CG) consisted of healthy, non-smoking, and lean subjects after MetS was excluded by an internal specialist.The MetS group was divided into 3 subgroups according to the number of MetS components, including HT, DM, low HDL,high TG, and VO findings; MetS3 with 3 components, MetS4 with 4 components, and MetS5 with all components.
Ophthalmologic ExaminationAll subjects underwent full ophthalmologic examination including best-corrected visual acuity (BCVA), intraocular pressure (IOP; Goldmann applanation tonometry), central corneal thickness (CCT;Ultrasonic Pachymetry, Pacscan, 300P, Sonomed, Inc.),adjusted IOP, slit-lamp biomicroscopy and dilated fundus examination. Exclusion criteria were a pre-existing ocular disease, refractive error ≥±4 diopter, BCVA less than 20/25 according to Snellen chart, cup/disc (C/D) ratio ≥0.7, C/D asymmetry ≥0.2, diabetic retinopathy (DRP), hypertensive retinopathy (HTRP), macular degeneration, glaucoma, cataract,pseudoexfoliation, and history of previous ocular surgery.After the anterior segment examination with biomicroscopy,the pupil was dilated and fundus examination was performed.OCT images were acquired with Topcon 3D-OCT-2000(compatible IMAGEnet R4Software Version.4.13.002.02,Topcon Medical Systems, Paramus, New Jersey, USA).Image quality was ≥45 and all scans were free of image artifacts. Macular thickness measurement was acquired by 3 dimensional (3D) macular scan protocol 6×6 mm2512×128(128 horizontal scan lines comprised of 512 A-scans). Nine macular subfields of Early Treatment of Diabetic Retinopathy Study (ETDRS) circle were recorded as foveal thickness (C1)within the innermost central 1 mm ring, inferior (I3), superior(S3) nasal (N3), temporal thickness (T3) within 3 mm ring,inferior (I6), superior (S6), nasal (N6), temporal thickness(T6) within 6 mm ring (Figure 1). Total macular volume(TMV) defined as the sum of all volumes of all 9 subfields was recorded. pRNFL thickness measurements were acquired by 3D disc 6×6 mm2512×128 scan protocol. Peripapillary fourquadrant retinal nerve fiber layer thicknesses were recorded as inferior (InfRNFL), superior (SupRNFL), nasal (NasRNFL),temporal (TempRNFL), and average (AvgRNFL). The inner retinal layer measurements composed of macular RNFL thickness (mRNFL), ganglion cell layer with inner plexiform layer thickness (GCL+), ganglion cell complex (GCC)thickness including all three inner retinal layers, were acquired by 3D macula scan protocol (scan pattern consists of 128×512 pixels taken in 7×7 mm2area). Superior half, inferior half,and total thickness measurements as superior macular retinal nerve fiber layer (SupmRNFL), inferior macular retinal nerve fiber layer (InfmRNFL), total macular retinal nerve fiber layer(TmRNFL), superior ganglion cell layer with inner plexiform layer (SupGCL+), inferior ganglion cell layer with inner plexiform layer (infGCL+), total ganglion cell layer with inner plexiform layer (TGCL+), superior ganglion cell complex(SupGCC), inferior ganglion cell complex (InfGCC), total ganglion cell complex (TGCC) were recorded. All assessments were done by analyzing the participants’ right eye.
Statistical AnalysisSPSS for Windows software (version 27.0 SPSS. Inc. IBM Corp, Armonk, NY, USA) was used for statistical analysis. Descriptive statistics, compare means,and mean±standard deviation scales were used to compare values. Chi-square test was used for qualitative independent categorical variations, while independent samplest-test,Kruskal-Wallis test, and Mann-WhitneyUtest were used for independent quantitative variables. APvalue less than 0.05 was accepted as statistical significance.
RESULTS
In the current study, 58 eyes of 58 patients were included in the MetS group and 63 eyes of 63 age and sex-matched healthy subjects were included in the CG. In the MetS group,55 subjects had VO (94.8%), 55 subjects (94.8%) had type 2 DM and receiving either insulin or oral anti-diabetic treatment,53 subjects (91.4%) had HT and receiving anti-hypertensive treatment, 34 subjects (58.6%) had hypertriglyceridemia (hyper TG) and were not receiving treatment for it, 28 subjects (48.3%)had low HDL and were not receiving treatment for it whereas control subjects did not have VO, HT, DM, dyslipidemia and any systemic disease. Characteristics of MetS groups according to the number of MetS components were summarized in Table 1.
Mean age was 57.2±7.1y (range 41-71y) in MetS group and 56.38±6.8y (range 41-72y) in the CG (P=0.92). The male ratio was lower in groups formed consecutively (male 13.8%in MetS groupvs15.9% in CGP=0.748). Although the mean IOP measured by the Goldmann applanation tonometer was significantly higher in the MetS group (P=0.004), there was no significant difference in terms of adjusted IOP (P=0.190).There was no statistically significant difference in CCT between the MetS and CG (552.2±30.8 µmvs545±27.8 µm,respectively,P=0.149). The mean C1, which is the central 1 mm ring of the ETDRS circle, and the mean I3, S3, N3, T3 thickness in the 3 mm ring of ETDRS circle were significantly lower in the MetS group (P<0.015). There was no statistically significant difference in the mean I6, S6, N6, T6 thickness in the 6 mm ring of ETDRS circle, TMV, InfRNFL, SupRNFL,NasRNFL, TempRNFL, and AvgRNFL thickness (P>0.05).InfmRNFL, SupmRNFL, TmRNFL, InfGCL+, SupGCL+,TGCL+, InfGCC, SupGCC, and TGCC thickness were similar in both groups (P>0.05; Table 2).In the analysis made between MetS3, MetS4, and MetS5 groups there was no statistically significant difference concerning C1, I3, S3, N3, T3, I6, S6, N6, T6, TMV, InfRNFL,SupRNFL, NasRNFL, TempRNFL, AvgRNFL, InfmRNFL,SupmRNFL and TmRNFL (P>0.05). While there was no statistically significant difference concerning InfGCL+,TGCL+, and InfGCC thickness between 3 groups (P>0.05),there was a statistically significant difference in SupGCL+,SupGCC, and TGCC thickness (P<0.05; Table 3). While SupGCL+ thickness was found significantly higher in the MetS5 than the MetS3 group (P<0.05), SupGCL+ thickness in the MetS4 group was not significantly different from the MetS3 and MetS5 groups (P>0.05; Table 3).
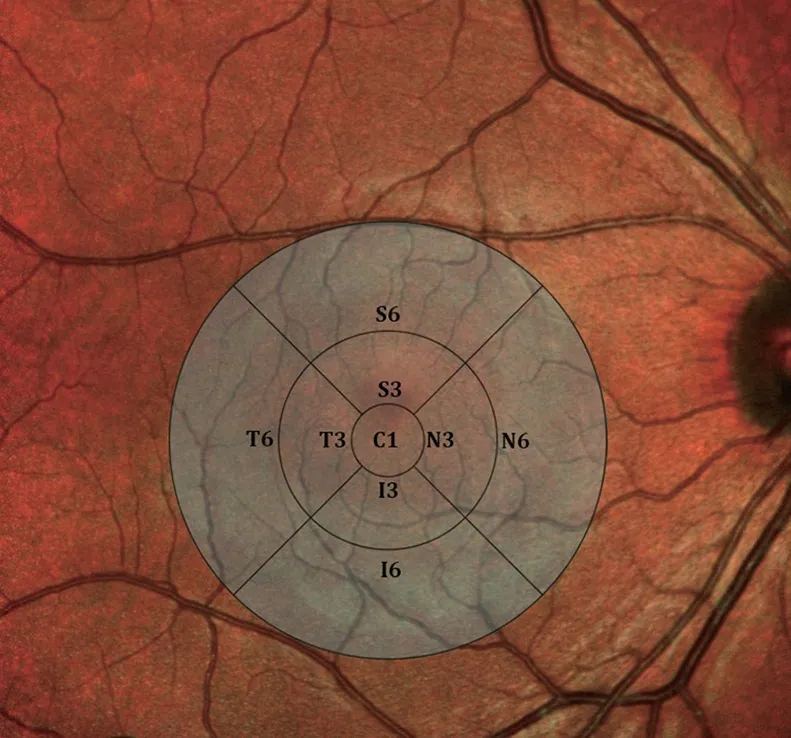
Figure 1 The ETDRS circle centered at the fovea illustrating nine macular subfields C1: Foveal thickness within 1 mm central ring; I3:Inferior thickness within 3 mm ring; N3: Nasal thickness within 3 mm ring; S3: Superior thickness within 3 mm ring; T3: Temporal thickness within 3 mm ring; I6: Inferior thickness within 6 mm ring; N6: Nasal thickness within 6 mm ring; S6: Superior thickness within 6 mm ring; T6:Temporal thickness within 6 mm ring.
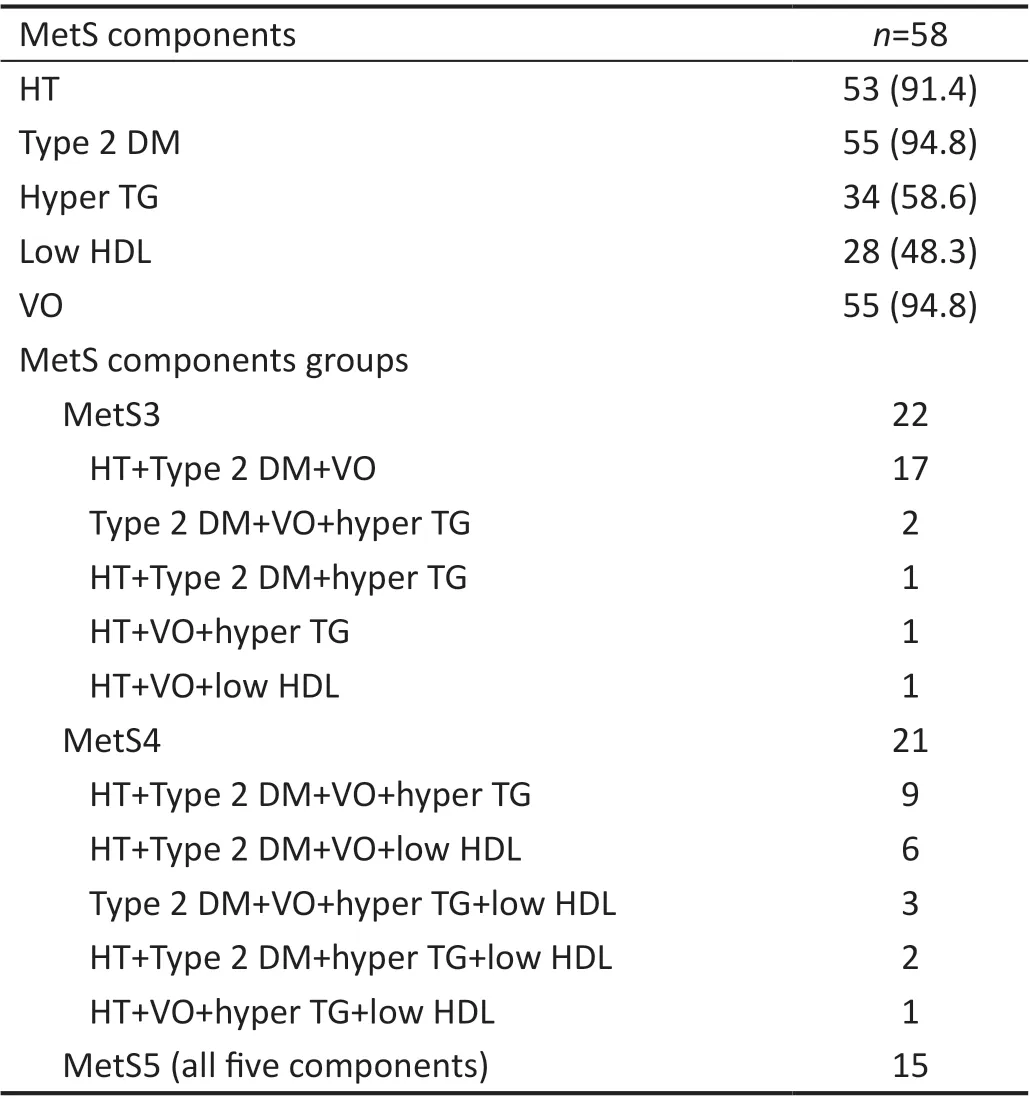
Table 1 Metabolic syndrome diagnostic criteria n (%)
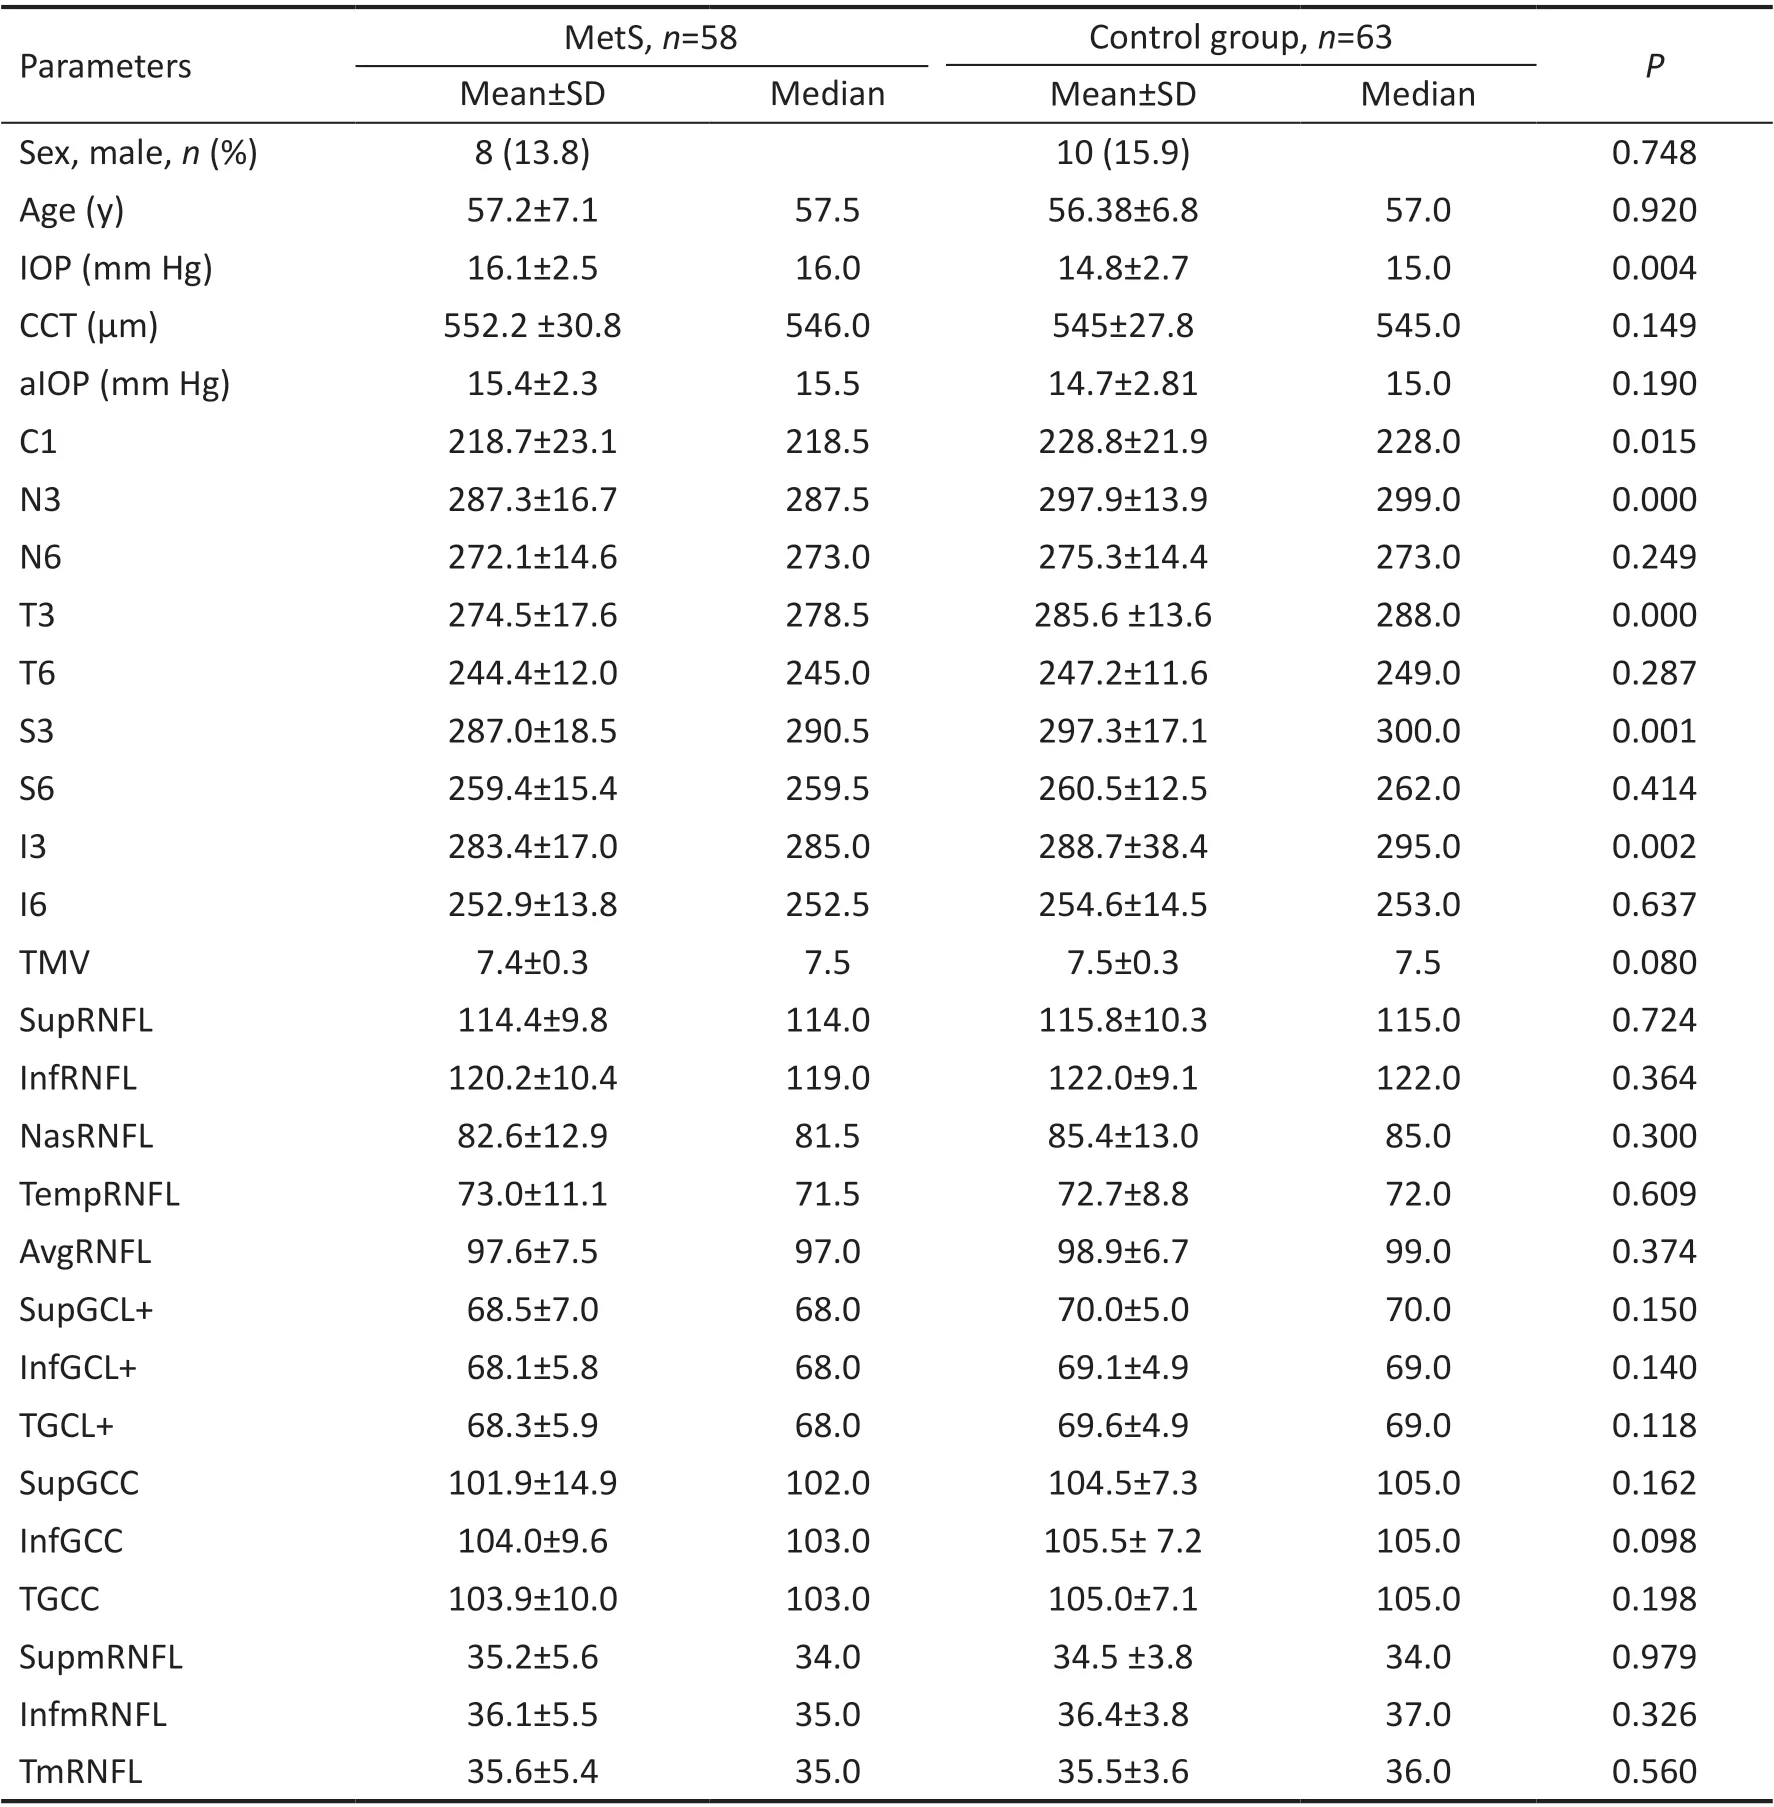
Table 2 The subject characteristics
DISCUSSION
IR and VO play a major role in MetS pathophysiology. In IR,skeletal muscle, fat, and liver do not respond to the action ofinsulin, resulting in hyperinsulinemia to induce euglycemia.Eventually, the beta cells of the pancreas cannot compensate and insulin secretion decreases, resulting in type 2 DM.Visceral fat deposition is associated with high IR causing increased lipolysis in adipocytes, resulting in the increased portal circulation of free fatty acids, a substrate for TG synthesis in the liver. The hepatic output of apolipoprotein B containing TG-rich very-low-density lipoprotein (VLDL) is increased due to increased free fatty acid flux and also VLDL clearance is decreased due to decreased lipoprotein lipase activity. Exchange of TG from VLDL for cholesterol esters from HDL by cholesterol ester transfer protein results in increased fractional removal of HDL. VLDL is metabolized to remnant lipoproteins and small dense low-density lipoprotein(LDL) which is more atherogenic than larger LDL and as a result, atherogenic dyslipidemia occurs with increased TG,small dense LDL, and decreased HDL levels[1-2].

Table 3 Comparison in groups formed according to the number of metabolic syndrome diagnostic criteria
Adipose tissue secretes adipokines such as leptin, resistin,TNF-α, IL-6, visfatin, plasminogen activating factor 1, and adiponectin. In the presence of obesity TNF-α, IL-6, and leptin secretion increase. TNF-α and IL-6 are proinflammatory mediators which play a role in IR. Adiponectin is a protective anti-inflammatory adipokine and it increases insulin sensitivity. The increase in adipose tissue mass causes a decrease in adiponectin, which leads to inflammation[19]. It has been claimed that this pathogenesis leading to obesity also causes retinal neurodegeneration. Doganet al[13]evaluated pRNFL, central macular thickness, and retinal ganglion cell(RGC) thickness in morbid obesity [body mass ındex (BMI)≥40 kg/m2]. While pRNFL and RGC thicknesses were found to be significantly lower in the obese group compared to the CG, central macular thickness was also found to be lower, but the difference was not statistically significant.
The MetS is also characterized by cellular oxidative stress,a condition in which an imbalance results between the production and inactivation of reactive oxygen species.Reactive oxygen species induces metabolic dysregulation,altered cellular functions, and inflammation and also contribute to IR and obesity[20]. Lipid peroxidation is significantly higher in individuals with MetS and it causes chronic inflammatory states. Montgomeryet al[12]evaluated the retinal neurodegeneration caused by cellular oxidative stress due to lipids in a mouse model of chemically induced dyslipidemia in which blood glucose and insulin levels are not affected. They found TG levels showed a negative, strong very significant correlation with b/a wave ratio and a positive moderate,and significant correlation with mixed rod and cone a-wave amplitude in electroretinogram. They concluded that it can be explained by Müller cell dysfunction due to oxidative stress.Müller cell damage and impaired cell function have been associated with neurodegeneration. Müller cells by covering the entire thickness of the retina it supports the structure and by interacting neuronal cells it regulates the neuronal function of the retina and reduces the neurotoxicity by removing metabolic waste products. Astrocytes like Müller cells, protect, and support neuronal function and defend the retina in response to severe tissue damage by reactive gliosis by undergoing complex remodeling of their structure and function. But this defense mechanism may also contribute to neurodegeneration.Astrocytes also possess anti-oxidant mechanisms which protect neurons from oxidative damage. Microglia, the principal resident immune cell in the retina arrange neuroinflammatory response to achieve neuroregenerative processes and tissue homeostasis. If the pathological insult persists, microglial behavior is altered and could exacerbate the disease process.Ramírezet al[21]showed Müller cell hypertrophy, loss of astrocytes, axonal degeneration, photoreceptor, and retina pigment epithelium disruption in hypercholesterolemic rabbit eye model. In this study, loss of astrocytes was shown to explain the neural damage that occurs when its protective effect disappears. Bruch membrane and basal membrane of retinal vessels were found thickened leading to an ischemic state which plays a role in cell damage. In contrast, Pazet al[22]showed changes in astrocyte integrity without any Müller cell reactivationvia in vivoanimal model of MetS. They also demonstrated an increased rate of apoptosis in the GCL and inner nuclear layer.
Studies have revealed that retinal neurodegeneration may precede microvascular changes of DRP[14,23-24]. mGCL,mRNFL, and pRNFL thickness reduction are indicators of diabetic retinal neurodegeneration in individuals with type 2 DM without DRP. Retinal thickness reduction was observed also in individuals with diabetic peripheral neuropathy[25].Neurodegeneration in DM has been found to be associated with retinal glial cells. Neuroglial alterations, glial reactivity,and increase in the number of microglial cells are demonstrated in animal models of early onset of DM. Hammoumet al[26]demonstrated Müller cell reactivity in a patchy pattern throughout the retina, deterioration of the outer retinal structure, a significant decrease in retinal thickness, and loss of ganglion cells in hyperglycemic type 2 DM induced animal model. Énzsölyet al[27]found that the outer retinal layers are involved in early diabetic neurodegeneration before apoptotic photoreceptor loss. Systemic HT, which is thought to be one of the causes of neurodegeneration in MetS, primarily causes vasoconstriction, prolonged disruption of the internal bloodretina barrier, and arteriosclerosis. Penget al[28]concluded that retinal vessel density was significantly reduced in essential HT patients with or without hypertensive retinopathy, but pRNFL and GCL+ thinning were only detected in patients with hypertensive retinopathy, and retinal hypoperfusion preceded neural damage. Some studies[28-29]suggest that RNFL thinning may be an indicator of hypertensive retinopathy, but more studies are needed to elicit the mechanisms of HT on retinal degeneration.
Although there are many different studies on the MetS components, there are a few clinical studies on MetS-specific retinal neurodegeneration. Karacaet al[15]evaluated macular thickness in 9 ETDRS subfields by multilayer segmentation analysis and found that the MetS group had significantly thinner GCL in two; inner plexiform layer in three; photoreceptor layer in seven subfields and concluded that IR and adipose tissue-derived chronic inflammation is responsible for this neurodegeneration. They included hyperglycemic, non-diabetic patients in their study to assess the retinal degenerative effects of the associated systemic changes beyond diabetic level hyperglycemia[15]. We considered overt type 2 DM patients treated with insulin or oral antidiabetics. Differ from their study we did not perform multilayer segmentation. We evaluated total thickness in every 9 ETDRS subfields, macular superior,inferior and total mRNFL, and mGCL+ thickness, and also pRNFL thickness. We did not detect a significant difference in mRNFL and mGCL+ thickness.
In the study in which Zareiet al[16]assessed pRNFL thickness,they found pRNFL is reduced in two temporal superior and nasal superior sectors in the MetS group. The number of MetS components was conversely associated with RNFL thickness.Differ from our study, the median age was younger (37vs56.77±6.97) and there was a male predominance (83%vs14.9%). In our study, there was no statistically significant difference in pRNFL thickness between MetS and CG and also there was no difference in retinal thicknesses between MetS3, MetS4, and MetS5 groups except for the SupGCL+,SupGCC, and TGCC thickness (P>0.05). This may be due to the high co-existence rate of obesity, type 2 DM, and hyper TG in MetS3 and MetS4 groups. Newet al[17]found that pRNFL thickness was significantly lower globally and in the inferior, superior, and temporal sectors. They concluded that pRNFL is more susceptible to neurodegeneration compared to the macula. The number of components of MetS was found to be an independent risk factor for retinal thinning. These findings partially contradict our study. In contrast, we found a significantly lower central macular thickness in the MetS group and did not find a significant difference in pRNFL thickness.The fact that their study included a younger population (30-50yvs41-72y) may contribute to this difference.
Some studies report that patients with MetS have an increased risk of developing NDDs[30]. IR is related to the development of NDDs such as Alzheimer’s disease, Parkinson’s disease, and multiple sclerosis[31-32]. Retinal neurodegeneration demonstrates a correlation with the state of the brain and retinal thickness is used as a biomarker in assessing risk and disease progression.Obesity, as mentioned before, induces a chronic inflammatory state and it is claimed that some inflammatory cytokines can cross the blood-brain barrier and trigger neuroinflammation.Some studies confirmed that another possible mechanism is, MetS induced mitochondrial dysfunction in neurons and consequent neurodegeneration[33]. Because MetS and NDDs share common pathological mechanisms, their relationship to retinal neurodegeneration is comparable. Uchidaet al[34]used macular volumetric measurements and exhibited a correlation between outer retinal layer volumes and total brain volume in normal aging, Alzheimer’s disease and Parkinson’s disease. They concluded that neurodegenerative changes are also associated with outer retinal loss and the outer retinal layer may also be a biomarker for NDDs. In our study, we observed a statistically significant reduction in the 1 mm central ring in which only outer retinal layers are present and in all 3 mm ETDRS subfields. There was no statistically significant difference in pRNFL, GCL+, GCC thickness, and TMV. The thickness reduction in the 3 mm inner ring may be due to reduced outer retinal layer thickness. The fact that the fovea is devoid of astrocytes and lacks the protective effect of astrocytes may explain the neurodegeneration in the central 1 mm region.
The current study has several limitations. We did not perform multilayer segmentation of macular OCT scans, we could not put forward the exact thickness changes at the layer level.We did not evaluate the effect of individual components on neurodegeneration instead we assessed the cumulative effect of MetS components. In study design we recruited participants with visual acuity ≥20/25. We did not evaluate influence of MetS on eyesight. Since oxidative stress and inflammation are involved in the pathophysiology of Mets, the effect of anti-inflammatory and antioxidant therapy on MetS induced neurodegeneration is worth investigating. We did not take into account the disease duration and control of patients with type 2 DM and HT in the MetS group. Unregulated DM or unregulated blood pressure may have a negative effect on neurodegeneration. Type 2 DM patients showed heterogeneity in terms of insulin and oral antidiabetic treatment. No one in the MetS group was taking anti-hyperlipidemic medication.Clinical studies revealed that low doses of statins, metformin,a drug of the biguanide family, and insulin can prevent neurodegeneration[35-36]. The effect of treatment agents in MetS on neurodegeneration may be the subject of further studies.
In conclusion, we detected a significant reduction in central 1 and 3 mm macular region thickness in the MetS group. We conclude that MetS causes neurodegeneration and these regions are more susceptible to MetS induced neurodegeneration than pRNFL.We did not detect more pronounced neurodegeneration with the increased number of MetS components. The high cooccurrence rate of DM, VO, and hyper TG within groups may be the reason for this result.
ACKNOWLEDGEMENTS
Authors’ contributions:Polat E was responsible for designing the study protocol, supervision the study, conducting the search, screening potentially eligible studies, data collection,updating reference lists, and creating all tables. Celik E was responsible for designing the study protocol, contributed to writing the report, extracting and analyzing data, interpreting results, and creating all tables. Togac M was responsible for writing the protocol and report, contributed to data extraction,and provided feedback on the report. Sahin A was responsible for writing the literature review, data collection.
Conflicts of Interest:Polat E,None;Celik E,None;Togac M,None;Sahin A,None.
 International Journal of Ophthalmology2023年2期
- International Journal of Ophthalmology的其它文章
- Perspectives and clinical practices of optometrists in Saudi Arabia concerning myopia in children
- Progression of myopia among undergraduate students in central China
- Flipped classroom approach to global outreach: crosscultural teaching of horizontal strabismus to Chinese ophthalmology residents
- Topical ketotifen treatment for allergic conjunctivitis: a systematic review and Meta-analysis
- Pseudomembranous conjunctivitis in a patient with DRESS syndrome
- Two cases of persistent shallow anterior chamber after cataract surgery combined with goniosynechialysis