
Synchronously scrambled diffuse image encryption method based on a new cosine chaotic map
2022-08-31 09:54:56XiaopengYan闫晓鹏XingyuanWang王兴元andYongjinXian咸永锦
Chinese Physics B 2022年8期
关键词:兴元
Xiaopeng Yan(闫晓鹏) Xingyuan Wang(王兴元) and Yongjin Xian(咸永锦)
1School of Information Science and Technology,Dalian Maritime University,Dalian 116026,China
2Guangxi Key Laboratory of Multi-source Information Mining&Security,Guangxi Normal University,Guilin 541004,China
Keywords: chaos mapping,cosine mapping,cyclic information wave,doppler effect,image encryption
1. Introduction
Nowadays,the explosive development of the information age has led to a lot of security problems. No matter whether it is information itself or the process of information transmission, there are many security risks. As a kind of widely used information carriers,digital image plays a decisive role in the process of the modern information transmission.In a network,there are a large number of images per second by transmission,processing and sharing. Therefore, digital image information security problem is also gradually attractive. In order to protect the privacy and the safety of materials and non-public information, image security has become an important information security problem.
In the traditional information transmission, most of the information is text information, so the traditional encryption algorithm is mainly used to encrypt the text information. The volume of this algorithm is large, and the correlation of the algorithm itself is strong. Therefore, in the direction of image encryption, this type of algorithm is unsuitable.[1–3]In order to develop algorithms suitable for image encryption,many researchers began to develop corresponding encryption algorithms based on the characteristics of digital images. Among them, chaotic system encryption,[4–7]biological DNA simulation coding,[8,9]transformation method based on optical characteristics,[10–12]quantum cryptography[13–15]and other methods have been gradually applied in image encryption. In image hiding,[16–18]information security,[19–21]watermarking,[22–24]digital image security,[25–28]and other aspects, these basic theories have played an important role.Among them, chaotic systems gradually attracted more and more attention because of their good characteristics. Due to their pseudo-randomness, unpredictability, ergodic property and initial value sensitivity,chaotic systems have good applications in the field of encryption,so many encryption methods based on chaotic systems began to be proposed.
Because of its adaptability to the encryption field,chaotic mapping is widely used in encryption algorithms. We classified the systems according to the number of system parameters, and we did this for both high-dimensional chaotic systems and low-dimensional chaotic systems. Low-dimensional chaotic systems have relatively simple structures and use very little resources,However,its chaotic behavior only exists in a limited range,so it can be predicted.[29–31]High-dimensional systems, on the other hand, exhibit excellent chaotic behavior and unpredictability. As a result,their structures are more intricate, consume more resources, and take longer to operate. It is challenging to put many high-dimensional systems into practice. Finding a chaotic system with good chaos and a straightforward structure is now a crucial step in developing encryption techniques.[32]
Many researchers have also proposed numerous stronger chaotic systems, such as one-dimensional chaotic systems based on the design of sine and inverse sine functions. Although it is still easier to predict than other systems, its encryption efficiency has greatly improved over other systems in recent years. Many classical chaotic systems were used as a base structure to encrypt algorithms. Hua and Zhou[33]put forth a brand-new two-dimensional chaotic system that effectively fixed the two-dimensional chaotic system’s flaws. To create a new chaotic system and incorporate it into an encryption algorithm,some researchers suggested combining the conventional sinusoidal mapping with logistic mapping.[34–37]A custom color image encryption technique based on various types of coupling mapping was proposed by Wanget al.[38]Although the algorithm has strong security, it encrypts data slowly.
A new low-dimensional chaotic mapping relying on cosine function with good chaos effect is proposed in this paper because of the limitations of the low-dimensional chaotic system and the complexity of the high-dimensional chaotic system,and it is named as the one-dimensional cosine system(CLS).The new chaotic mapping is put to the test using the conventional theoretical analysis method, and it is demonstrated to have excellent chaotic performance in the scope of infinite real parameters. Additionally,we use the C-LS system in the domain of encryption to further strengthen the security of the encryption algorithm due to its excellent characteristics.Thus,we suggest a fresh encryption scheme. In this algorithm, the scrambling and diffusion of the image are realized by simulating the information wave model based on cosine chaos mapping, generating the cyclic information wave, and using the information wave diffusion model. The circular information wave has a doppler-like effect that simultaneously diffuses and scrambles the image matrix.Additionally,the secondary XOR diffusion is used to deepen the encryption effect in order to further ensure it. Following a thorough experimental analysis of the algorithm’s experimental results, we demonstrate that the algorithm can effectively withstand common attack types and that it has good security on its own.
2. Basic theory of algorithm
2.1. Chaotic system
2.1.1. Logistic chaotic maps
The chaos map has excellent initial value sensitivity,and the initial value and control parameters can be slightly modified to obtain two completely different results. Therefore,the chaotic system is very suitable for applications in encryption.Among the existing few nonlinear systems,the logistic map is a well-known 1-D chaotic system that is used in cryptography.According to mathematics,they can be defined as follows:

2.1.2. Sine chaotic map
The sine chaotic system is based on sinusoidal function.As a result, the input angle is converted to the output angle within the range of [0,1/π]. In terms of mathematics, sine mapping is defined as follows:

wheretrepresents the control parameter,andQ(xi)stands for the sine mapping.
2.2. Cosine chaotic mapping
The cosine chaotic maps take the structure shown in Fig.1.

Fig.1. Cosine chaotic mapping construction.
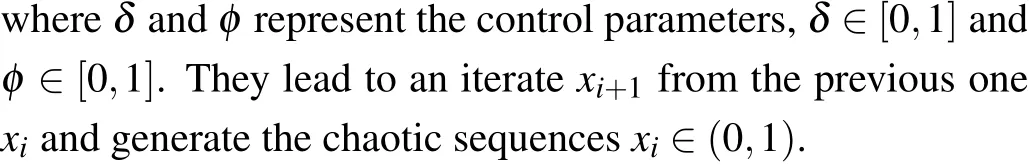
HereL(a,xi)andS(a,xi)represent chaotic mapping models with control parameters,L(a,xi)andS(a,xi)are improved and combined.Using the weighted model,a new chaotic mapping model is constructed using a nonlinear cosine transform.As a result of the Logistic chaotic mapping model and the sine chaotic mapping model,we construct a new one-dimensional cosine chaotic mapping model as follows:

Here,rrepresents the control parameter of chaotic mapping,iis the length of the mapping information wave,andTis the period of the cosine mapping.
In the system mapping,we takeras the control parameter. Based on the cosine function,the new chaotic map can be derived by ignoring the negative value of the parameterµ.
2.2.1. Chaos trajectory
The C-LS chaotic system exhibits a very high chaotic state within the parameter range and has a very wide range of chaos.The positive real number space is covered by its chaotic area because it is based on the cosine function. For cryptography,a system with sufficient key space,sufficient complexity,and unpredictability can better meet the needs of encryption.Later, we test the new cosine chaotic system using the corresponding dynamic analysis techniques.
When parameters in a dynamic system change, the output value range is described using a system trajectory bifurcation diagram. It can be an important tool for understanding the causes of instability and chaos as well as how different states of the system relate to one another and change over time. The relationship between bifurcation and the system’s structural stability is very close. The bifurcation graph produced by logistic mapping,sine mapping,and C-LS mapping with a change in control parameters is shown in Figs.2 and 3.

Fig.2. Chaotic map bifurcation graph: (a)logistic mapping,(b)sine mapping.

Fig.3. Bifurcation graph of C-LS mapping in different parameter ranges: (a)bifurcation diagram with control parameters between(0,1),(b)bifurcation diagram with control parameters between(0,5).
As seen in Fig.3,the C-LS mapping’s bifurcation graphs are evenly and randomly distributed within the parameter’s norm, covering the entire region. This shows that the newly generated chaotic mapping exhibits robust chaotic behavior across the entire parameter range.
2.2.2. Lyapunov exponent
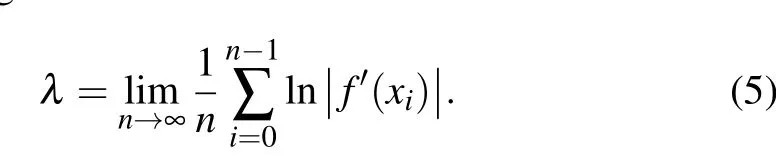
The initial state sensitivity and unpredictability of one chaotic mapping are its most prominent dynamical characteristics, and these characteristics can be measured using the Lyapunov exponent (LE). The average exponent rate of convergence or divergence for two orbits of a chaotic mapping that are close to each other in the phase plane can be described by the LE using the formula[39]
Their chaos phenomenon gradually becomes worse as the LE increases. If the LE is positive, it means that regardless of how close or far apart the two trajectories are from each other,they will exhibit completely different incremental states over time. Therefore,the system is in a chaotic state when the LE is positive. The LE maximum can be used to assess the predictability of a high-dimensional system, which typically has two or more LE values. As a result,the system is in a chaotic state when its maximal LE is greater than 0. The hyperchaotic phenomenon is identified when the system has more than one positive LE and its orbits diverge in multiple directions. A larger LE indicates that the MD displays better hyperchaotic behaviors,which are much more complex and difficult to predict.
Comparatively and elaborately using the Lyapunov exponent can make the issue more obvious. We use the Lyapunov exponent as the benchmark value to evaluate whether the system exhibits chaotic properties. Using the LE maximum, we can determine if the system exhibits chaotic behavior.

Fig.4. The Lyapunov exponent of chaotic maps: (a)Lyapunov exponent of C-LS mapping, (b) Lyapunov exponent of logistic mapping, (c)Lyapunov exponent of sine mapping.
2.2.3. Initial state sensitivity
One of the most crucial characteristics of chaotic systems is their sensitivity to initial values. It symbolizes the sensitivity of an orbit whose initial values are almost infinitesimal and diverge exponentially following a set number of iterations.We create two tracks with initial value differences of 10−15,as shown in Fig.5(a),and control parameter differences of 10−15,as shown in Fig.5(b),to further analyze the sensitivity of the map (b). The orbits diverge after five to six iterations, as depicted in the figure, as a result of the system’s highly chaotic behavior.
Fig.5. Chaotic mapping initial value sensitivity: (a)initial value sensitivity,(b)control parameter sensitivity.
2.3. Cosines map circular information waves
The term “cyclic information wave” describes a model of ripples with a set frequency of occurrence and an ongoing diffusion cycle. Doppler effect and water surface ripple are included in the traditional model.
The Doppler effect is a frequent occurrence in nature that affects almost all types of waves, including sound, light, and electric ones. When the wave source and the observation position move together, a Doppler wave occurs, and when this happens,the signal state that the observation position receives will differ in frequency characteristics,depending on how the wave source and observation position move. The frequency of the received signal from the moral wave source will be higher and the wavelength will shorten as the observation position moves closer to the position of the wave source, indicating that the information wave is compressed. On the other hand,the wavelength lengthens as the frequency rises. The effect increases with increasing source velocity. The Doppler wave model can be described mathematically as follows:if the wave source’s frequency isF,its motion speed isV,the sound speed in air isU,and the distance between the stationary observerPand the wave source’s motion direction isL,then the frequency model that the observer receives is expressed as

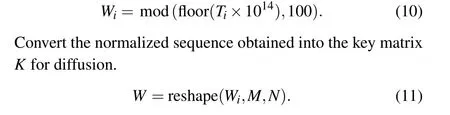
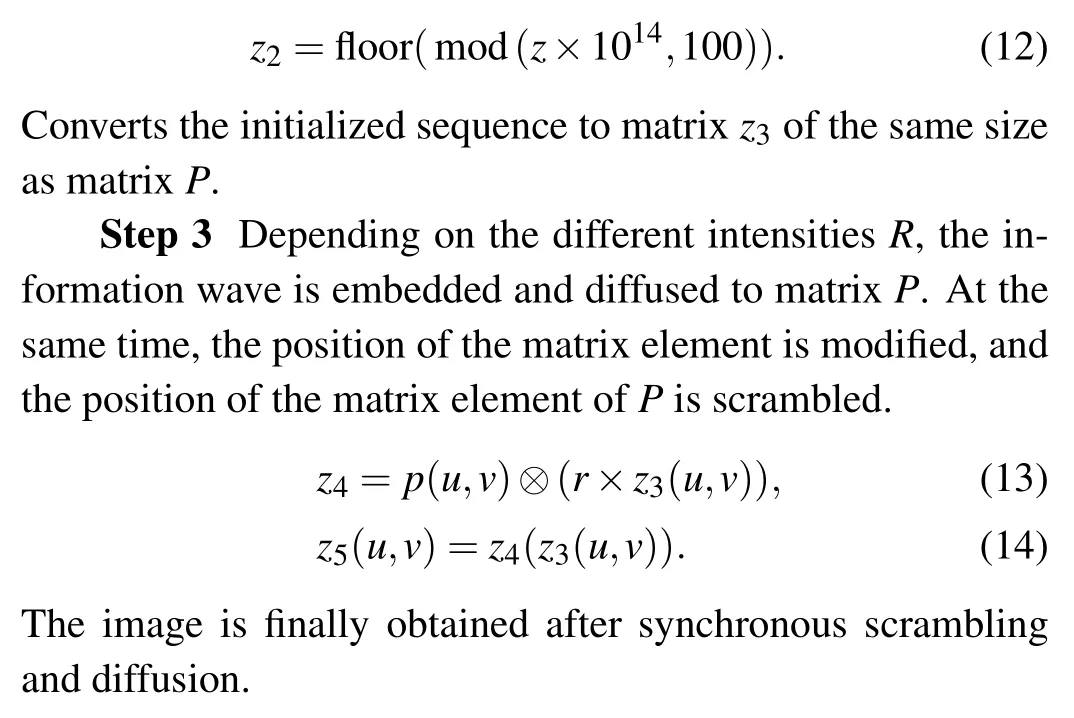
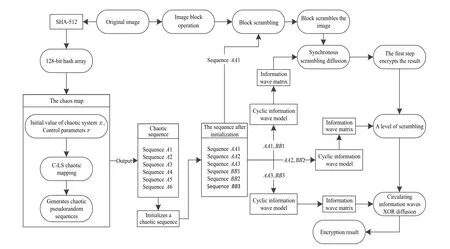
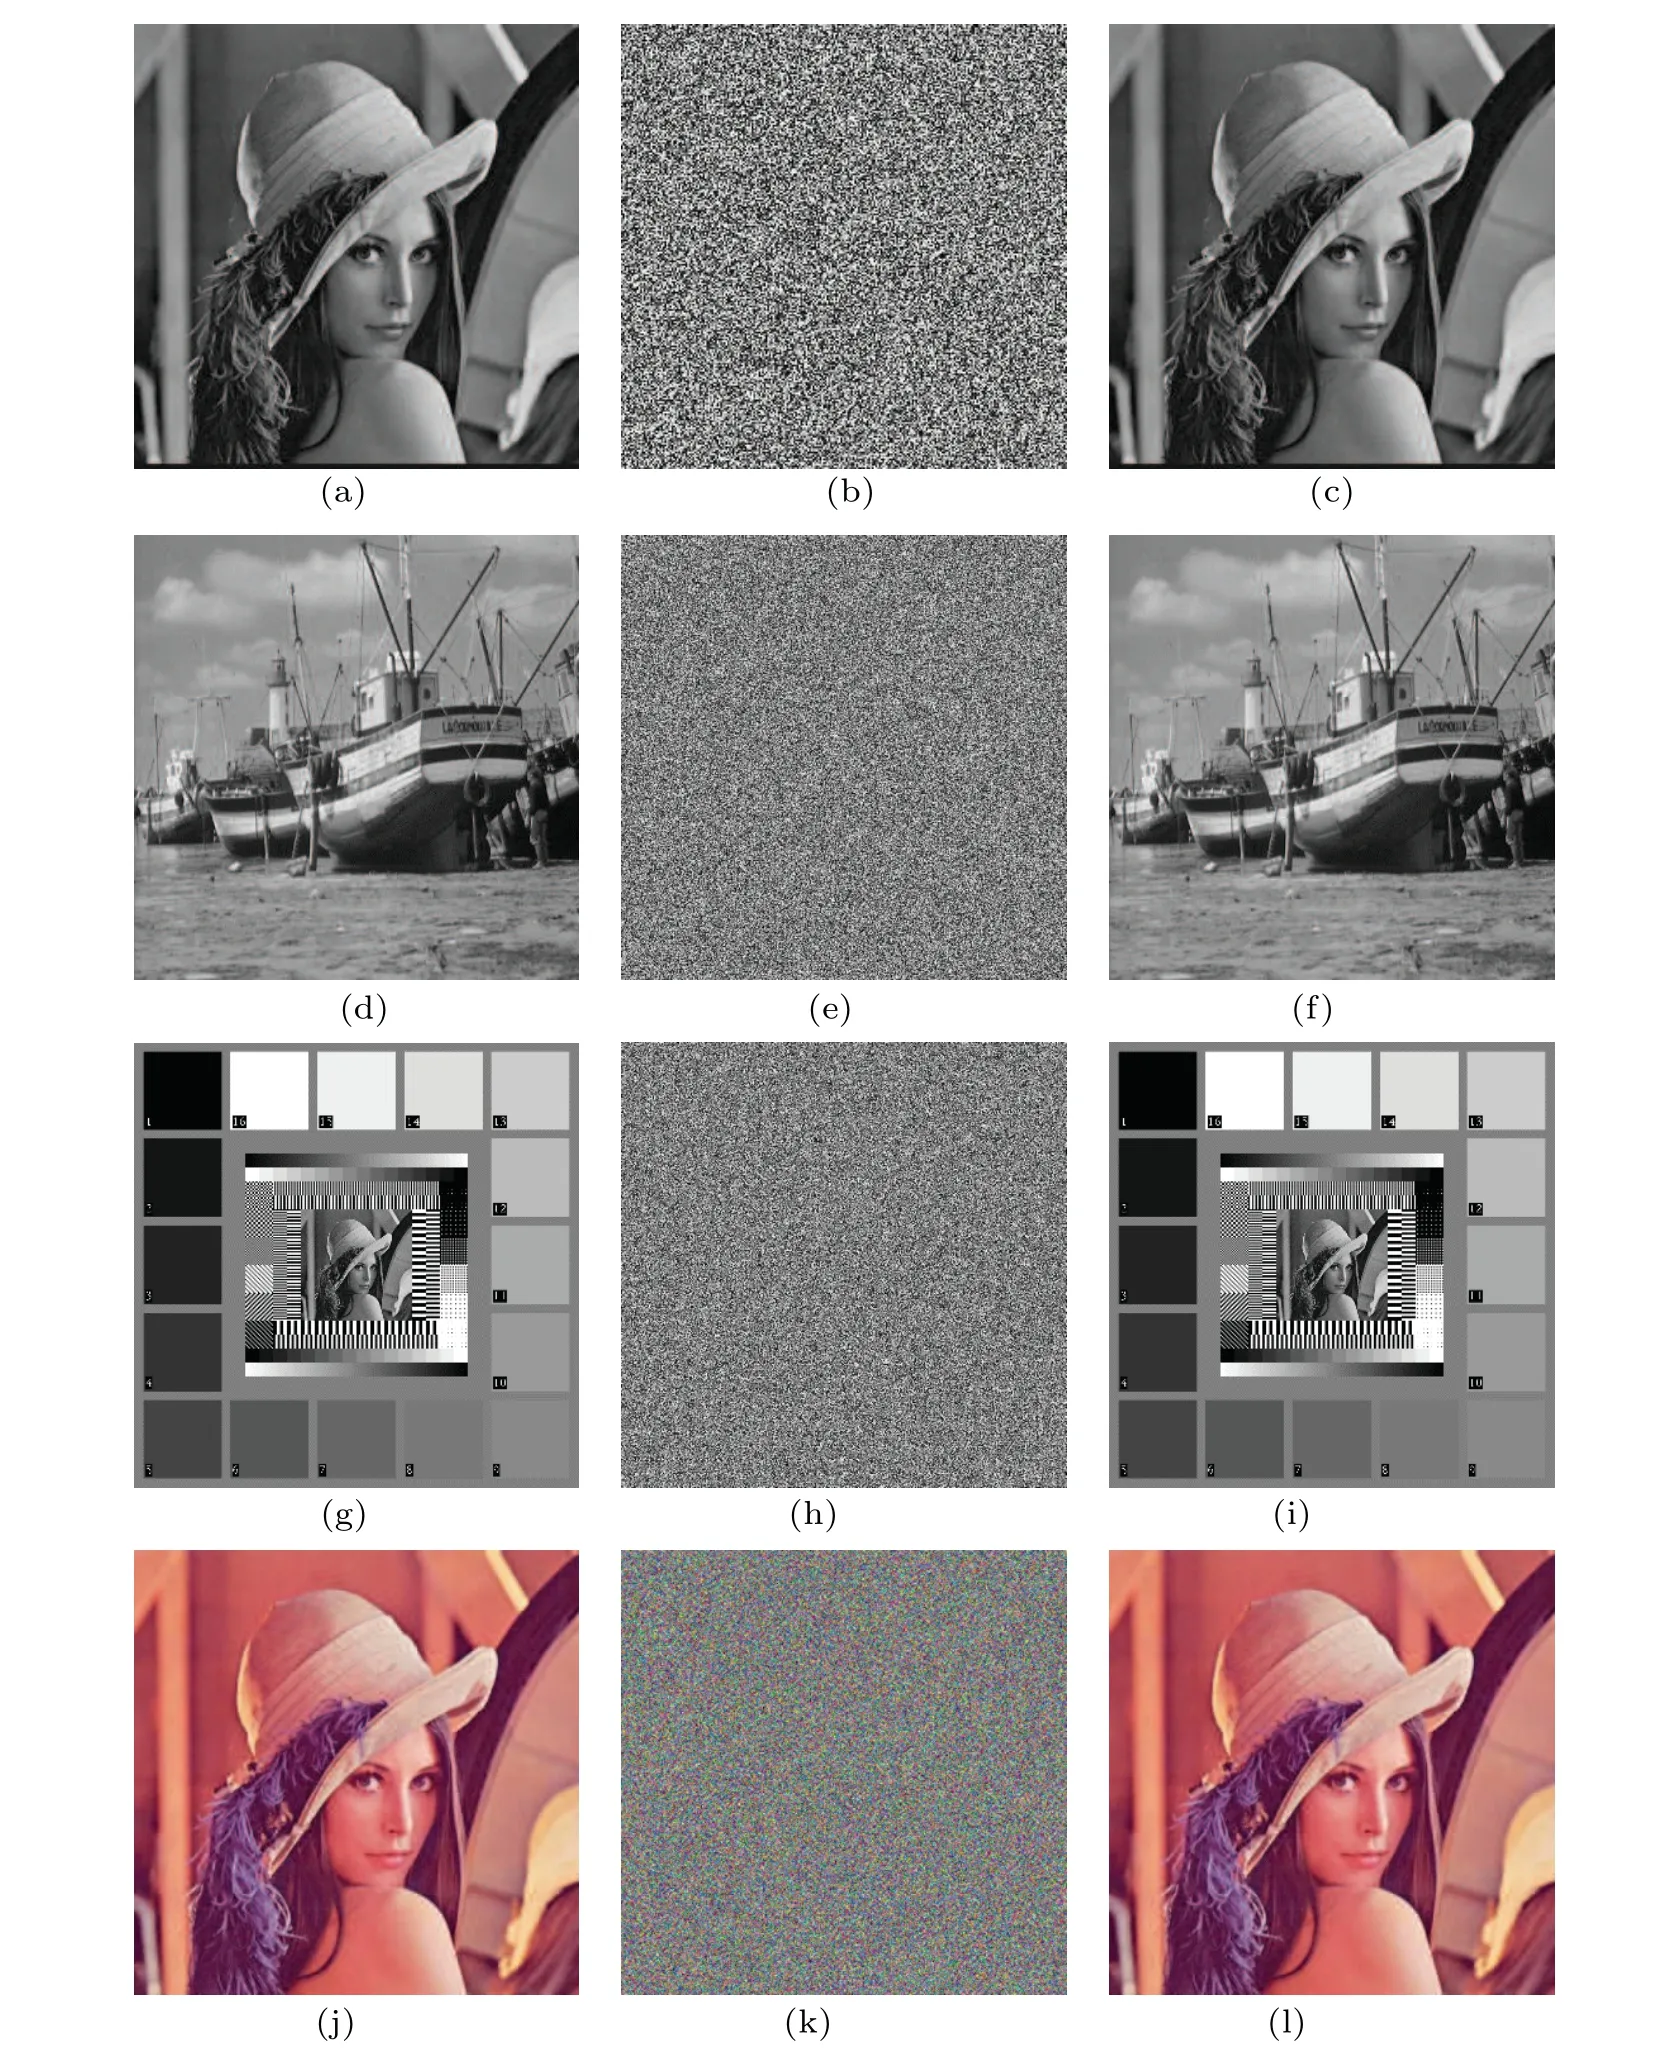
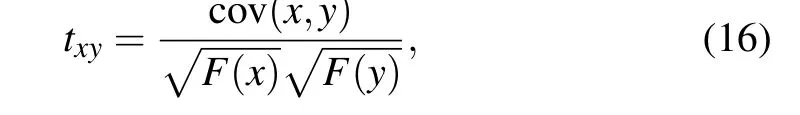
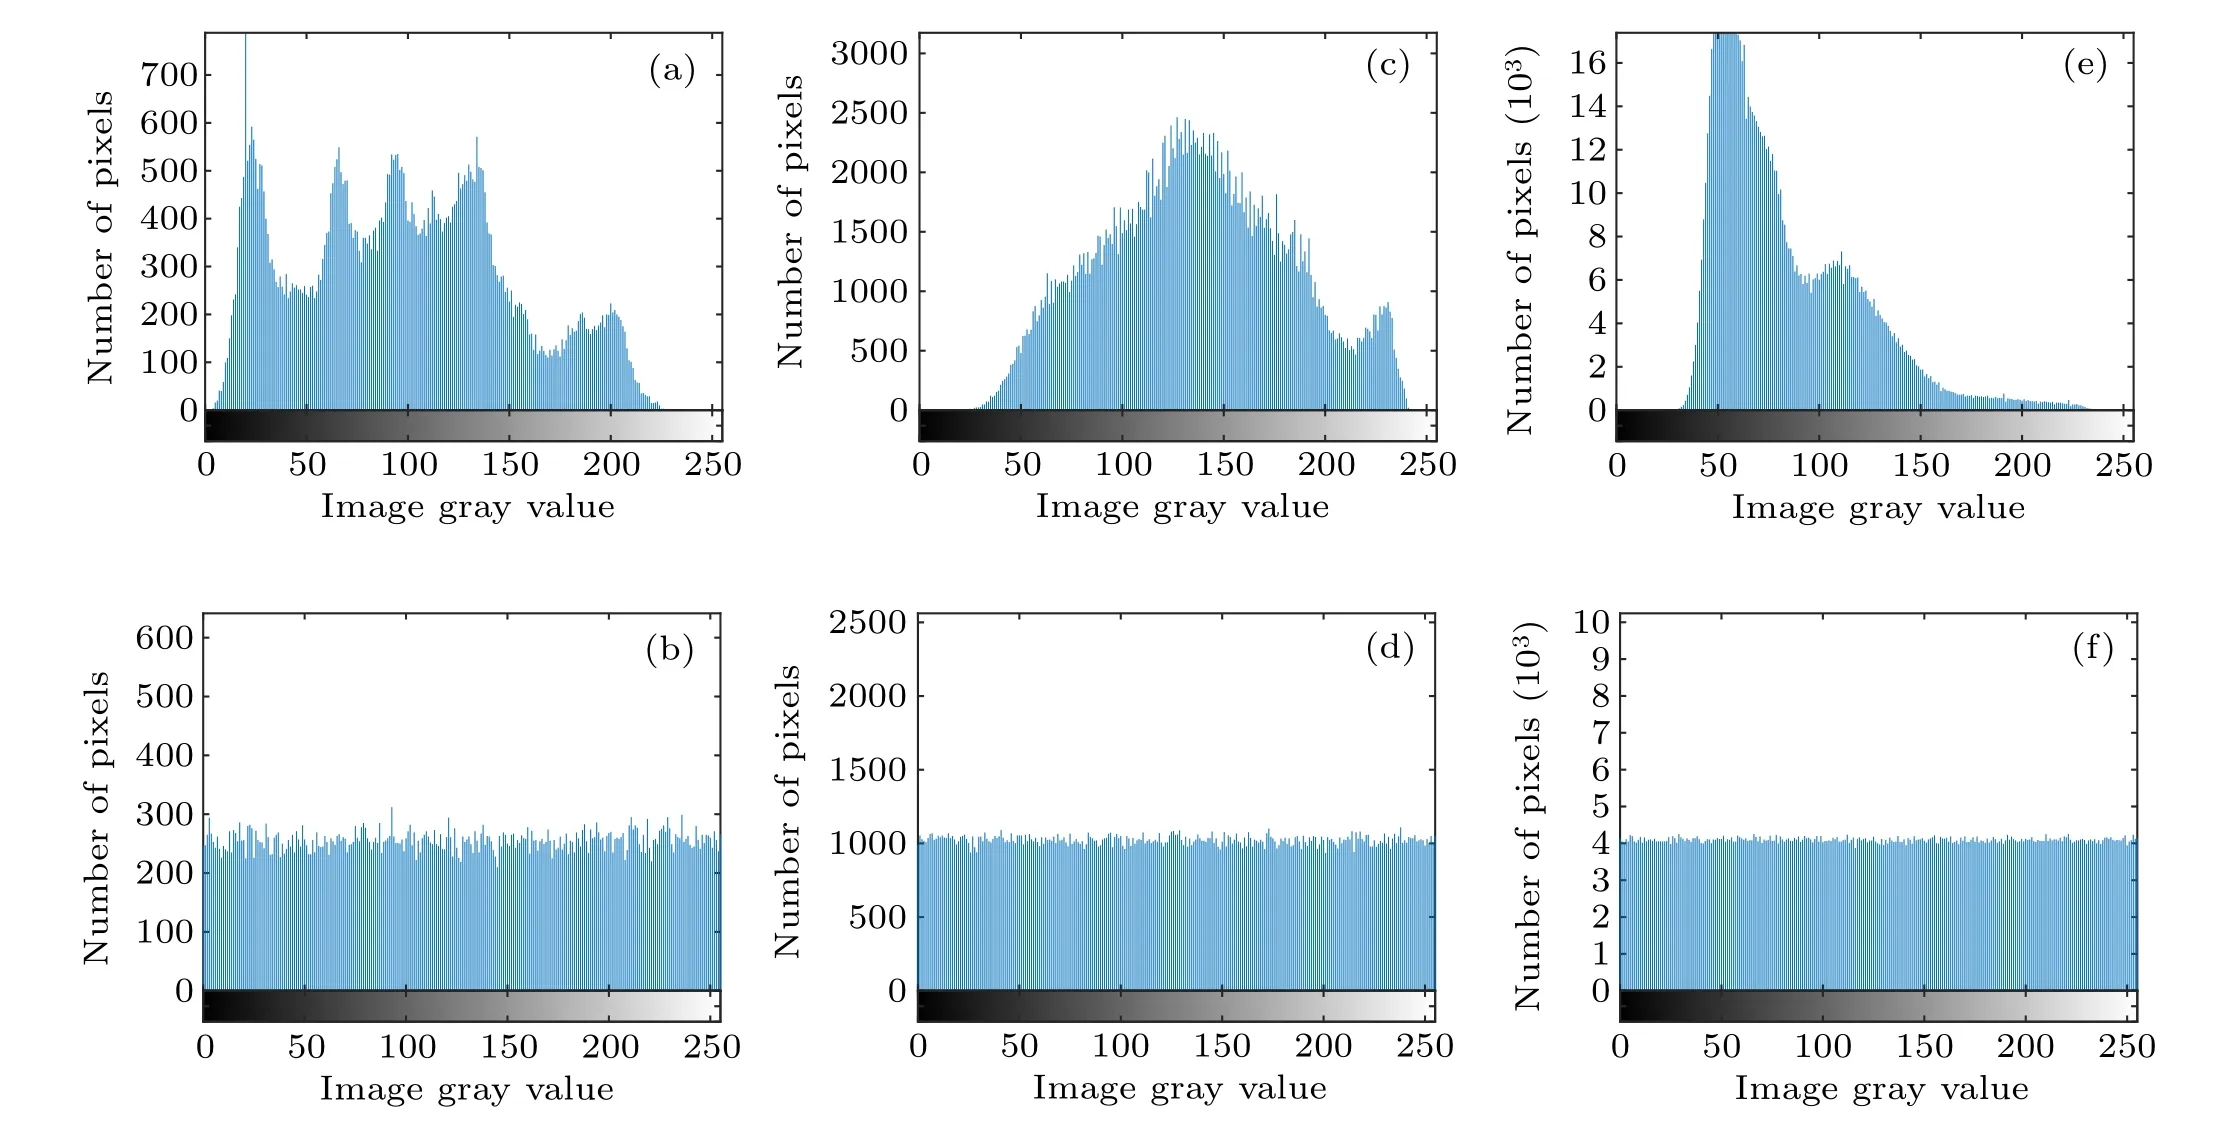
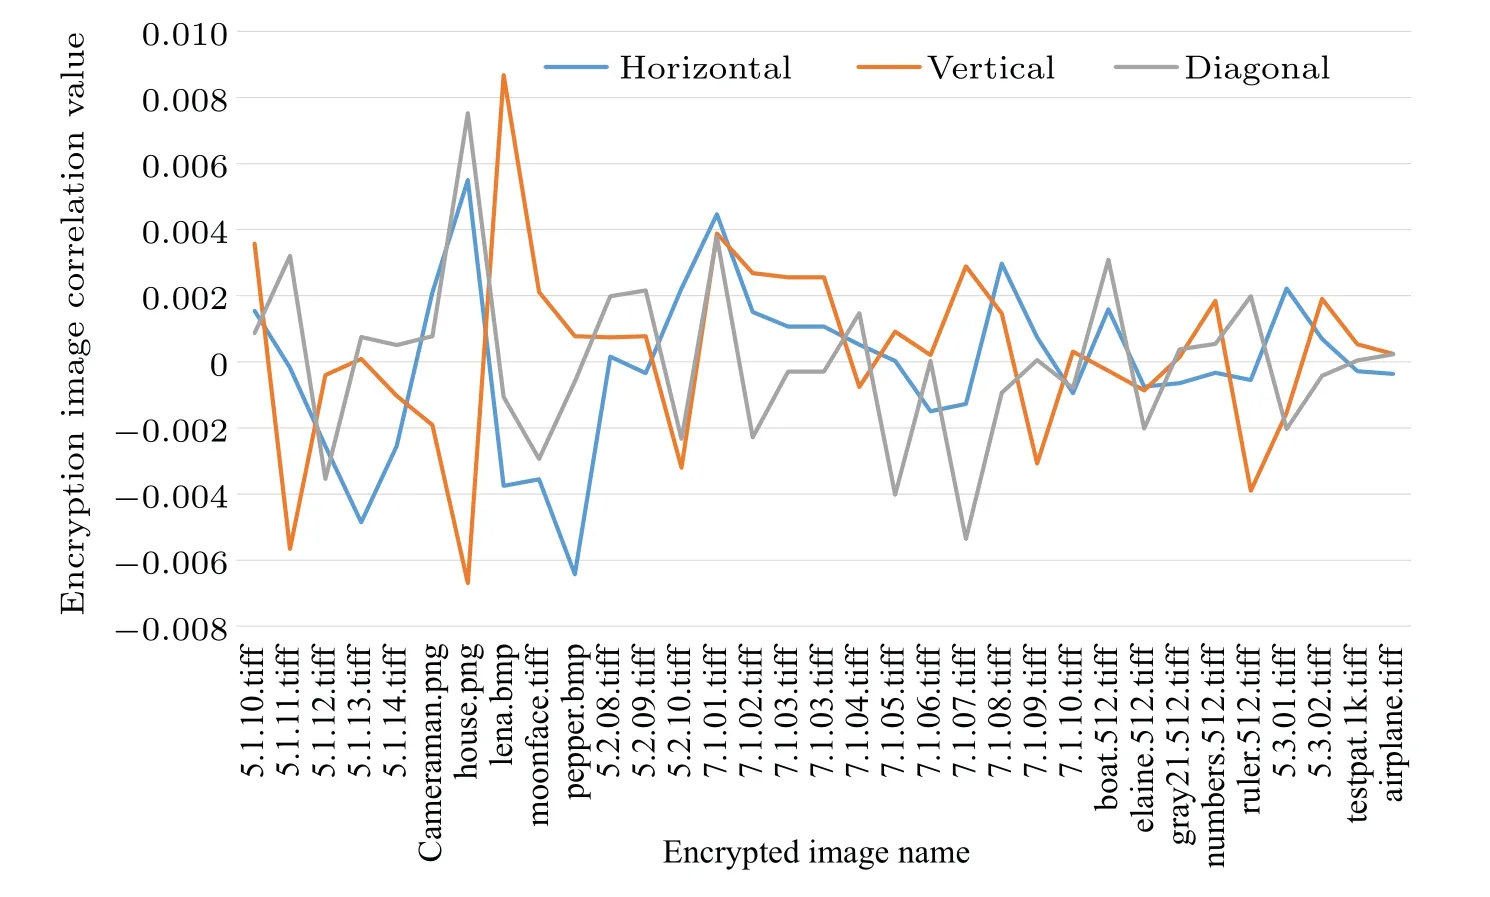
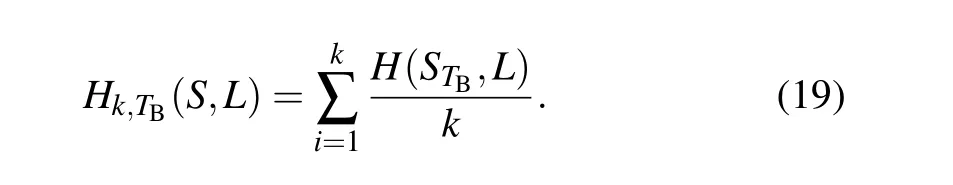
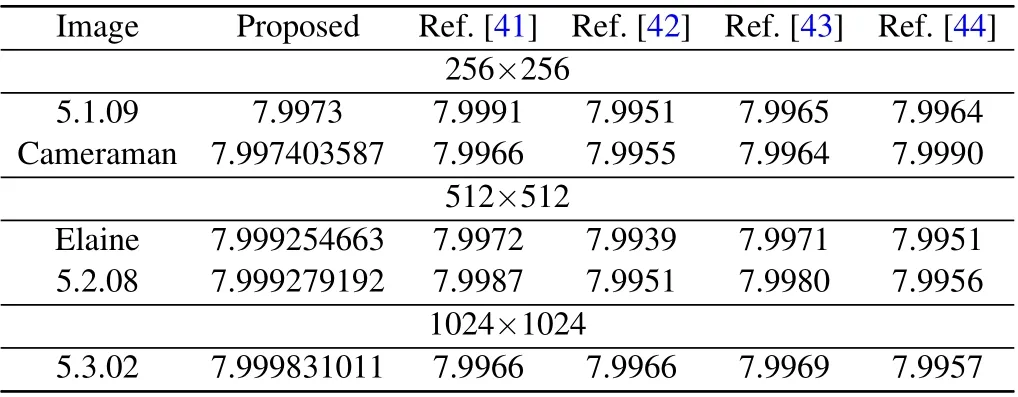
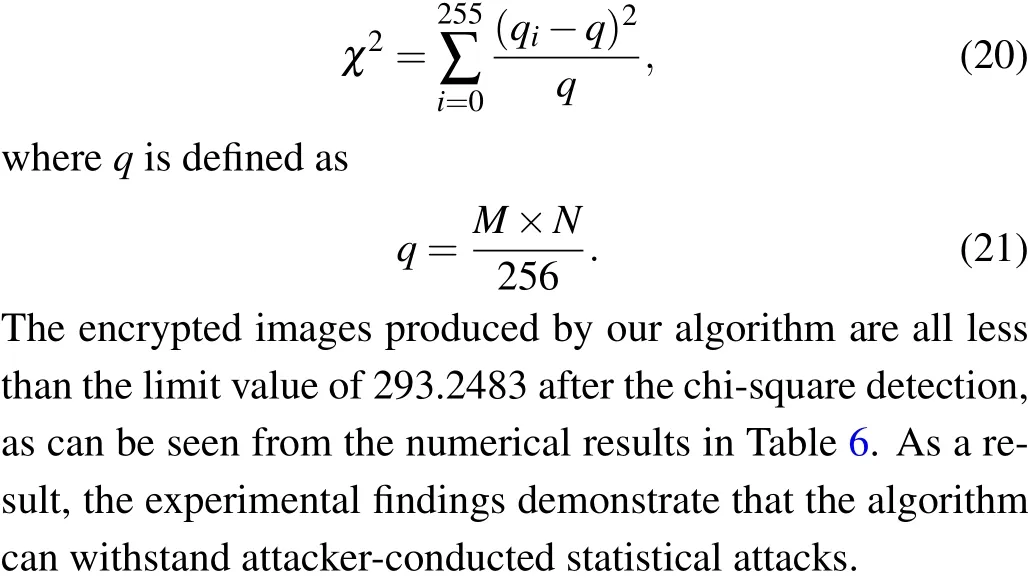
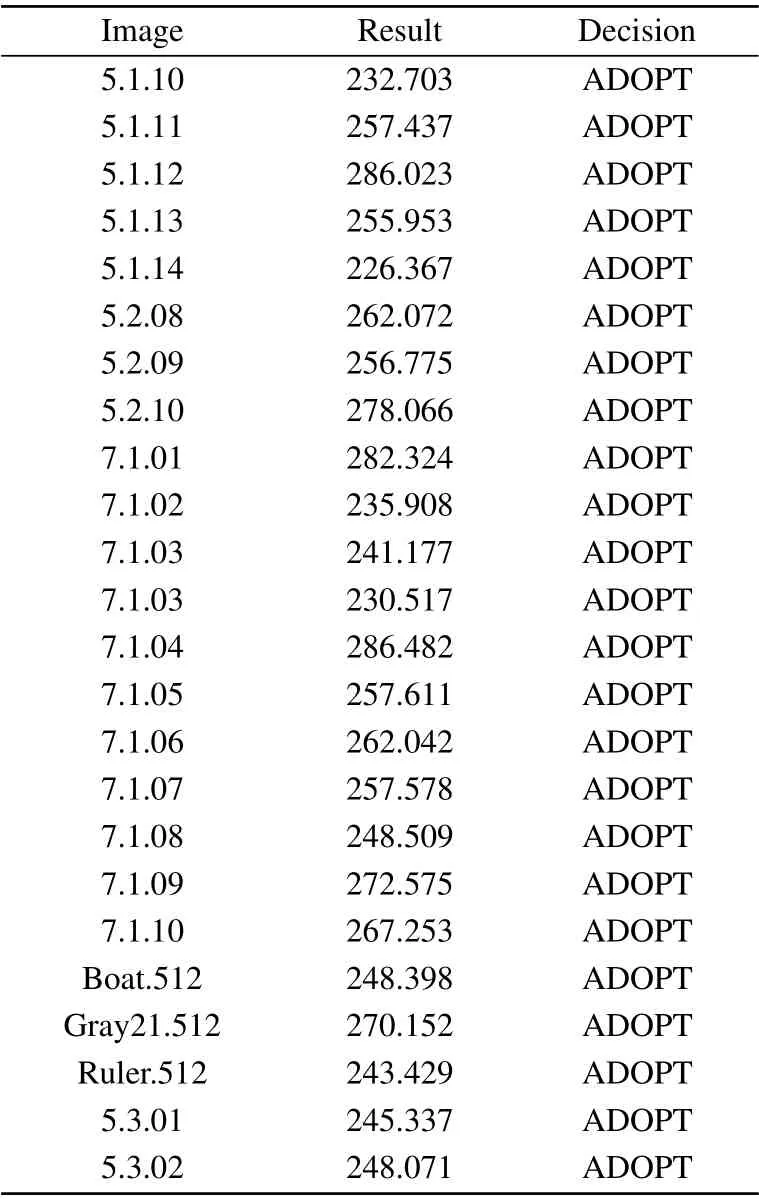
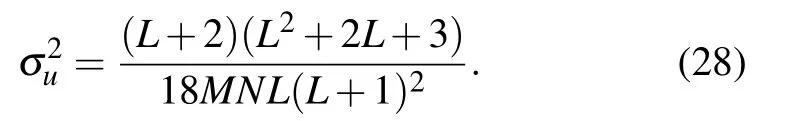
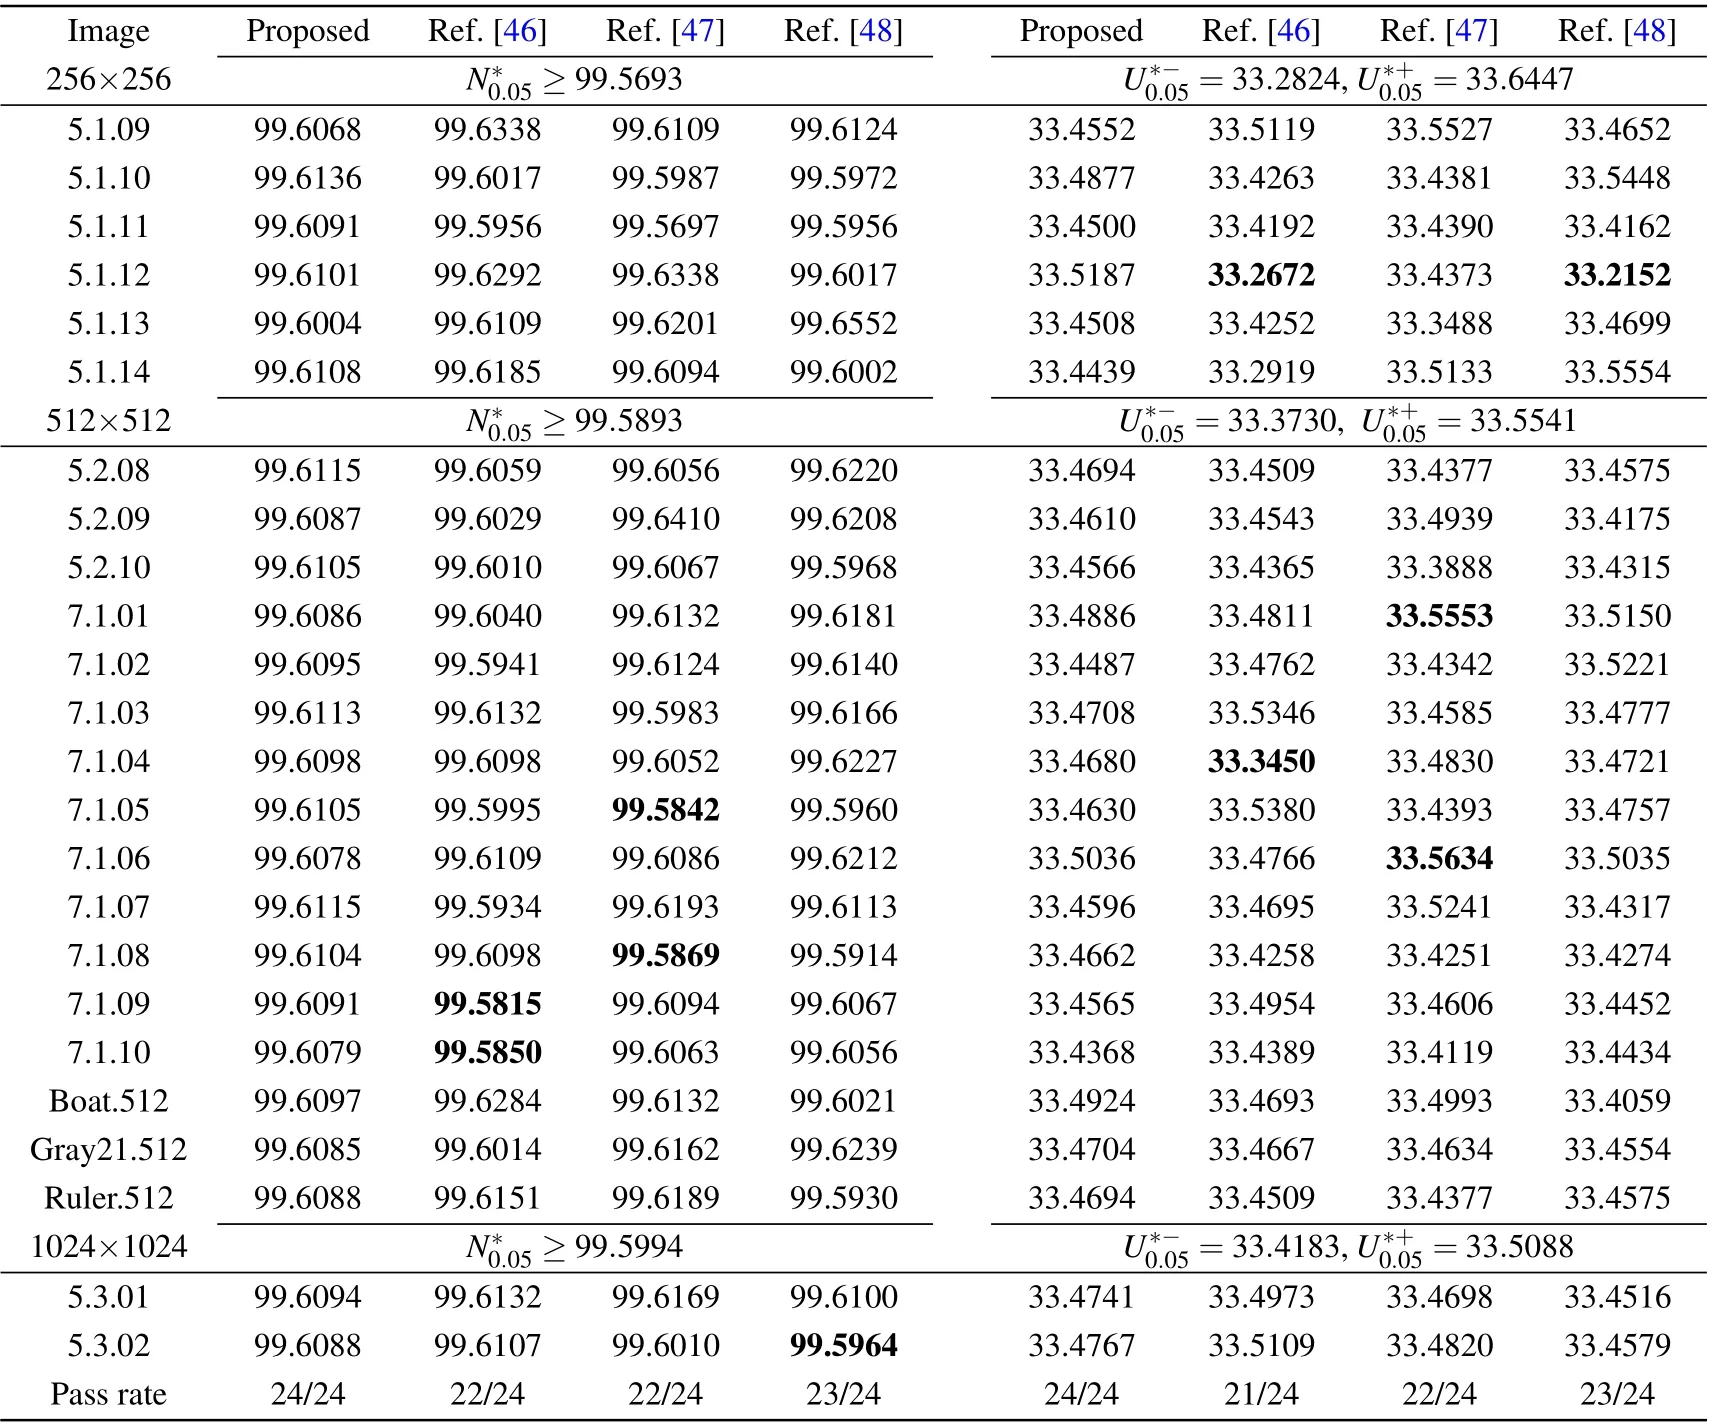
wheret0denotes the time center that corresponds to the observer’s location;whent In order to simulate the Doppler effect and create an information wave model,we use the C-LS chaotic model as the generating function. The cyclic diffusion effect, period and frequency of C-LS mapping are good. Using chaos to build a cyclic information wave model,pseudo-random sequences are generated based on C-LS mapping: (1) The information wave’s length is given asn, and the circular information wave’s polynomial is given asm. (2) Different pseudo-random sequences are generated in multiple columns using C-LS chaotic mapping, and the sequences are chosen as frequency and parameter sequences in the polynomial. (3)The circular information wave model is created using the C-LS mapping as the generation system: whereTis the period. The high frequency shifts to the low frequency as the distance grows. To achieve the goals of synchronous scrambling and diffusion of the image,it is possible to use the frequency shift property of the circular information wave to change the gray value and position of the image pixel. The appropriate information wave polynomial is chosen based on the image size,and the frequency array of the circular information wave is generated using a chaotic system simulation. The necessary information wave can then be generated after a number of cycle iterations based on various periods. When scrambling an image,the wave used to generate the information is dependent on the size of the image because the generated cycle information wave length is inversely proportional to the image size. As a result,when the image is larger,the wave used to generate the information will take more time,which has a significant negative impact on how quickly the scrambling process proceeds, so the algorithm adopted for chunking thoughts, according to the size of the block to generate a wave doppler and scrambling,will greatly improve the execution efficiency of this algorithm. We decide to use the hash function as the secret key generation technique. The compression length of a given message sequence can be specified by the hash algorithm. This algorithm has a very high safety factor and can withstand the majority of brute force attacks, but some algorithms have recently been broken,including SHA-1 and others. Thus,as the primary part of key generation, we opt for the more popular SHA-512 function. Due to the peculiarity of the hash function, if the plaintext has a pixel value transformed, then the generated hash sequence group will be completely different, so it has extremely high security and sensitivity.We operate the SHA-512 function to hash the unencrypted image to obtain hash array,from which we select the appropriate sequence value for corresponding processing to obtain the secret key value we need. The algorithm’s complexity of 2512makes it robust enough to fend off brute force attacks. We select a 128-bit hash sequence and transform it into an array: Step 1 The hash algorithm is used to calculate the plaintext image. The parameter used to iterate the chaotic system is chosen to be the corresponding hash value. We initialize the sequence value to conform to the requirements of the chaotic system’s correlation coefficient. The formula for calculating the initial value and control parameters is as follows: Step 2 The obtained parameters are initialized to produce those that satisfy the requirements of the chaotic system.We produce the necessary pseudo-random sequence using the C-LS cyclic information wave generation system. The cyclic information wave’s sequence is transformed into a matrix with the same size as the matrix that will be diffused during the diffusion stage.The components of the pseudo-random sequence A must first be converted before being normalized. The normalized processing formula of circulating information wave is given as follows: The synchronous scrambling and diffusion process is realized as follows: Step 1 Obtain the median element value ofPasP(mid),the maximum element value asP,and the original image matrix asP(max). Utilize thePmatrix to perform a traversal comparison operation. Ifp(u,v)≤p(mid),recordL(u,v)=0;otherwise,recordL(u,v)=1,and get the position record matrixL. Step 2 Using Eq.(7)and matrixP,the cyclic information wave is produced. Information sequenceZis then obtained,and the initial operation is performed on the sequenceZ: According to the needs of the algorithm, the target image matrix is first divided intoN×Nsmall blocks, then into smaller blocks, and finally block-after-block division is carried out on the synchronized scrambling diffusion operation.Using an 256×256 image as an example,this article chooses images of various sizes for experiments. The block 8×8 is a matrix block. The steps for encryption are as follows: Step 1 Using C-LS chaotic mapping,six rows of chaotic pseudo-random sequences are created, and the sequences are initialized: Step 2 Choose theAA1 andBB2 sequence,apply Eq.(7)in periodTgenerated wave doppler information, convert information sequence of the same size as matrixpwave information matrix,and then utilize the information matrix for the block to apply Eqs.(13)and(14)to sync block image scrambling and diffusion, after the completion of the merger block image,and the output,as the first phase encryption results forP1. Step 3 Use Eq. (7), the sequencesAA2 andBB2 were chosen to produce Doppler information waves with the periodT1, which were then transformed into a matrix with the same sizeP1. In accordance with Eq. (5),P1undergoes traversal sorting and scrambling, and the scrambling matrixP2is produced. Step 4 Using Eq. (7), theAA3 andBB3 are chosen to produce information waves with the periodT2that are then transformed into a matrix with the same sizeP2. To achieve diffusion operation, the matrixP2is used in the XOR operation,and the final encrypted image is output. Fig.6. Encryption process flow chart. The reverse of encryption is decryption. The precise operational flow of the encryption algorithm suggested in this paper is shown Fig.6. The simulation-based safety verification algorithm is presented in algorithm, we select a representative target image,analyze it comprehensively according to different resolutions and colors, write and implement the code using MATLAB software, and conduct the simulation and experimental analysis of the algorithm under the Window 10 operation system. We use the images “Lena” in color, “boat” in grayscale,“TestPat-1K,”and“Lena”in grayscale to conduct an encryption simulation experiment. The results are then subjected to the necessary security analysis. Figure 7 displays the encrypted and unencrypted versions of the image. Fig. 7. Experimental results. (a) Lena, (b) encryption result, (c) decrypted, (d) boat, (e) encryption result, (f) decrypted, (g) TestPat-1k, (h)encryption result,(i)decrypted,(j)color Lena,(k)encryption result,(l)decrypted. In terms of security, there are a number of security requirements such that our algorithm should meet in order to comply with safety standard requirements. To determine whether the algorithm has reliable security through verification, we should conduct the appropriate security verification on the simulation results and the algorithm itself. We should compare numerical results to verify the encryption effect for encryption methods. On the algorithm, we analyze common attacks, brute force attacks, statistical attacks, robustness attacks, and some plaintext attacks. The results show that the proposed theory has a high degree of reliability when compared to both experimental and numerical simulation results. Large key spaces used in the encryption techniques make them resistant to brute-force attacks. The resistance of the key space increases with its size. Therefore,the design algorithm should choose the secret key space with the larger size. There are various components to the algorithm’s key space. This paper’s key space 26×2512×1014×6is much larger than 2100.Because the algorithm’s key is 6 bits,the computer’s precision is 10−14. It takes SHA-512 as its hash function,and the space size is 2512. Thus,in our proposed algorithm,the key space is sufficient to resist all kinds of brute-force attacks. In order to estimate the sensitivity and security of the algorithm, our model achieves high key sensitivity. A small perturbation can significantly change the reconstruction output,and the current encryption result obtained is very different from the result prior to the key change. In the simulation, we first choose a secret key value,change it from 0.3801 to 0.380000000001, and then use the two keys to get the two encrypted images of Figs. 8(a) and 8(b). Make a distinction using two encrypted images. In Fig.8(c),the image difference is displayed. The two encryption results are very dissimilar,as shown in Fig.8(c). Finally,we decrypt Fig.8(a)using the modified key,and the result in Fig.8(d)shows that the modified key is unable to decrypt the original key encryption result. We again change the secret key information, choose a pixel from the original image matrix,add or subtract 1,modify the pixel value,and then encrypt the image before and after the change,respectively. Figure 8(d)is the pixel value after modification encrypted image.Figure 8(e)is the difference between Figs.8(a)and 8(d).This result shows the extremely strong key sensitivity of the algorithm script in this paper. Fig. 8. Sensitivity test. (a) Encrypted with x1(0), (b) encrypted with modified x1(0), (c) difference between (a) and (b), (d) decrypted with modified x1(0),(e)encrypted with modified1-bit pixel,(f)difference between(e)and(a). A series of simulation experiments and numerical analyses are conducted in this section in order to verify the reliability of the algorithm. (1)Histogram The unprocessed image’s pixel distribution is more concentrated,and because of this,the overall pixel distribution is not uniform, which causes the histogram of the image to be very wavy. The image’s pixels are evenly distributed after encryption,and the histogram can be used to visualize this distribution. The histogram ought to be flat as a result. Inequalities in the distribution of image pixels will be targeted by statistical attacks. A flat and uniform distribution of pixels can therefore withstand statistical analysis well. The histogram results of the three different images chosen for the experiment are displayed in Fig.9. The histogram of the encrypted image can be seen in Fig. 9, and exhibits a pixel distribution that is remarkably uniform. (2)Correlation comparison The unprocessed image has strong pixel correlation, and a statistical analysis attack on a strongly correlated image can easily leak or lose information content. In contrast, the encrypted image breaks up the pixel correlation of the original image, making it well resistant to the statistical type of attack.The encrypted image’s pixel correlation can be decreased through encryption operation. The formulas(16)and(17)[40]are used to calculate the correlation of adjacent pixels in the encrypted image using the Lena graph as the experimental target. Figure 10 displays the correlation’s numerical results. We have with Calculating the correlation of the ciphertext image yields corresponding data. In the literature, data results have been compared.[41–44]Figure 11 and Table 1 display the comparison results. We can see from the comparison that the correlation coefficient obtained by the algorithm in this paper is actually smaller than the correlation coefficient produced by the algorithm in a number of other documents. Therefore, it can be inferred from the experimental findings and numerical analysis that the encryption algorithm suggested in this paper performs exceptionally well in resisting statistical analysis. Fig.9. Histogram of experimental images. (a)Original image of Lenna,(b)encryption image of Lenna,(c)original image of Elaine,(d)encryption image of Elaine,(e)original image of airport,(f)encryption image of airport. Fig. 10. Correlation of adjacent pixels: (a)–(c) plaintext image correlation, (d)–(f) ciphertext image correlation. (a) Horizontal correlations, (b) vertical correlations,(c)diagonal correlations,(d)horizontal correlations,(e)vertical correlations,(f)diagonal correlations. Fig.11. Ciphertext correlation line graph. Table 1. Correlation comparison results of adjacent pixels. (3)Information entropy Determine the image’s information entropy and,using the information entropy’s specific value, assess the likelihood of information leakage. (i)Global information entropy The calculation formula of global information entropy is as follows:[39] Global information entropy should typically be around 8 wirelessly. The likelihood of leakage decreases with proximity. By comparing the encryption results of the algorithm in this paper with the values in Refs. [41–44], we can see from Tables 2 and 3 that for the encryption results of the algorithm in this paper, the value of global information entropy is better than other similar algorithms, and it is very close to 8, so the probability of information leakage of this algorithm is very low. (ii)Local Shannon entropy To determine the algorithm’s local information entropy,we use the equation The Shannon entropy must be within the range of[7.901515698, 7.903422936] after the algorithm has encrypted the images that satisfy the experimental requirements.This is known as a pass test. Table 4 displays the Shannon entropy values determined by the aforementioned formula following the encryption of the image using the algorithm suggested in this paper. Table 2. Information entropy of encrypted image. Table 3. Entropy comparison results of encrypted image information. Table 5. Local Shannon entropy. In this section, we examine the ciphertext images’ pixel distribution. Chi-square detection tests the target quantitatively and yields numerical results that are quantitative, helping to prevent visual misperception. For comparative analysis,we use the formula provided in Ref.[39]as follows: Table 6. Uniformity evaluation by chi-square test. Table 7 compares and analyzes the NPCR and UACI of the encrypted image. In the differential attack evaluation,the closer the NPCR and UACI are to the standard value,the more it proves that the algorithm has higher resistance to attack.Through the data comparison in Table 7,Figs.12 and 13,it can be seen that the algorithm proposed in this paper is relatively excellent in the experimental results of NPCR and UACI. In addition,by comparing with the literature,[46–48]it can be seen that the NPCR and UACI values and pass rate of our algorithm are the best. Table 7. Comparison of NPCR(%)values and UACI(%)values. Fig.12. NPCR test results. Fig.13. UACI test results. When the data we send includes digital images, the attacker can directly attack the encrypted image to compromise the data’s integrity, obstructing the receiver’s decryption process and preventing the acquisition of accurate decryption information. Through experiments,we simulate various degrees of noise,cropping,and loss attacks,and by decrypting the images that have undergone the attacks, we can obtain images with recognizable information.[49,50]The decryption results through various levels of clipping and noise attacks are shown in Figs.14 and 15,demonstrating how well the algorithm can resist these attacks. Fig. 14. Noise experiment. (a) Noise intensity 0.01, (b) noise intensity 0.05, (c) noise intensity 0.1, (d) noise intensity 0.05, (e) 0.01 noise picture decryption,(f)0.05 noise picture decryption,(g)0.1 noise picture decryption,(h)0.01 noise picture decryption. Fig.15. Cropping attack experiment: (a)1.526%,(b)6.25%,(c)25%,(d)25%,(e)1.526%,clipping decryption(f)6.25%clipping decryption,(g)25%clipping decryption,(h)25%clipping decryption. This paper proposes a novel cosine-based chaotic onedimensional mapping. The chaotic map can meet the requirements of cryptography because of its highly chaotic behavior, wide range of control parameters, and numerous fixed points. In light of the issues in the field of image encryption, we propose a new image encryption scheme based on one-dimensional cosine chaos mapping and doppler wave to synchronous operation of diffusion of image,which improves encryption efficiency and reduces system complexity,and the associated with the same type of algorithm is not found. The plan put forth in this paper is more efficient at encrypting data.The scheme proposed in this paper has better security and can withstand common attacks, which has some industrial value and significance, according to simulation experiments, data analysis,and comparison. Acknowledgements This project was supported by the National Natural Science Foundation of China (Grant No. 61672124),the Password Theory Project of the 13th Five-Year Plan National Cryptography Development Fund (Grant No. MMJJ20170203), the Liaoning Provincial Science and Technology Innovation Leading Talents Program (Grant No. XLYC1802013), the Key R&D Project of Liaoning Province (Grant No. 2019020105-JH2/103), Jinan City ‘20 Universities’ Funding Projects Introducing Innovation Team Program (Grant No. 2019GXRC031), Research Fund of Guangxi Key Lab of Multi-source Information Mining&Security(Grant No.MIMS20-M-02).
2.4. Key generation

3. Encryption algorithm
3.1. Cyclic information waves are simultaneously scrambled and diffused
3.2. Image encryption process

4. Simulation results
5. Security analysis
5.1. Key analysis
5.2. Key sensitivity analysis

5.3. Statistical analysis


5.4. The χ2 test
5.5. Resistance differential attack analysis


5.6. Resistance to noise attacks and cropping attacks


6. Conclusion
猜你喜欢
Chinese Physics B(2023年2期)2023-03-13 09:17:48
湘潮(上半月)(2022年5期)2022-12-06 03:02:22
Chinese Physics B(2022年11期)2022-11-21 09:34:34
Chinese Physics B(2022年6期)2022-06-29 08:57:06
Chinese Physics B(2022年2期)2022-02-24 09:38:04
Chinese Physics B(2021年11期)2021-11-23 07:25:26
Chinese Physics B(2021年6期)2021-06-26 03:03:34
Chinese Physics B(2021年6期)2021-06-26 03:03:34
Chinese Physics B(2021年1期)2021-01-21 02:08:20
金沙江文艺(2018年1期)2018-11-14 02:09:33

- Chinese Physics B的其它文章
- Magnetic properties of oxides and silicon single crystals
- Non-universal Fermi polaron in quasi two-dimensional quantum gases
- Purification in entanglement distribution with deep quantum neural network
- New insight into the mechanism of DNA polymerase I revealed by single-molecule FRET studies of Klenow fragment
- A 4×4 metal-semiconductor-metal rectangular deep-ultraviolet detector array of Ga2O3 photoconductor with high photo response
- Wake-up effect in Hf0.4Zr0.6O2 ferroelectric thin-film capacitors under a cycling electric field