
Necroptosis signature predicts neuroblastoma outcome
2022-08-23 01:03:06XinLiWanRongLiHaoJin
Medical Data Mining 2022年3期
Xin Li ,Wan-Rong Li ,Hao Jin
1Tianjin Cancer Hospital Airport Hospital,Tianjin Medical University Cancer Institute and Hospital,National Clinical Research Center for Cancer,Key Laboratory of Cancer Prevention and Therapy,Tianjin’s Clinical Research Center for Cancer,Tianjin 300060,China.
Abstract Neuroblastoma is the most prevalent solid tumor seen outside of the brain in children.Despite multimodal therapy,high-risk neuroblastoma has a 5-year survival rate of less than 50%.Necroptosis,an inflammatory form of controlled cell death,has either anti-tumor or pro-tumor functions in several types of adult malignancies.However,the genes related to necroptosis and their association with prognosis in neuroblastoma are unclear.This study sought to determine the role of necroptosis-related genes in neuroblastoma a comprehensive bioinformatics analysis.Based on the expression of genes associated with necroptosis,the neuroblastoma samples were classified into three groups.We found that neuroblastoma with high necroptosis displayed promising outcomes and increased infiltration of immune cells.On the basis of the findings of the Cox regression analysis,we developed a four-gene prediction model consisting of PGAM family member 5 (PGAM5),tumor necrosis factor (TNF),baculoviral IAP repeat containing 2(BIRC2),and fas associated via death domain(FADD)that is strongly linked with overall survival.The model exhibited superior performance,both internally and externally.Our data demonstrate that a high necroptosis rate correlates with favorable outcome and immune infiltration.These four necroptosis-related genes may serve as therapeutic targets,encouraging research on necroptosis in high-risk neuroblastoma therapy.
Keywords: necroptosis;neuroblastoma;immune landscape;prognostic model;overall survival
Introduction
Neuroblastoma is a remarkably heterogeneous childhood tumor with clinical behaviors ranging from spontaneous regression to metastatic spread [1,2].This heterogeneity is mirrored in overall survival.Lowto intermediate-risk neuroblastoma has a five-year survival rate of 85 to 90 percent,but high-risk neuroblastoma has a survival rate of less than 50 percent despite multimodal therapy [3,4].Thus,new therapy alternatives for neuroblastoma with a high-risk profile are urgently required.
Necroptosis is a form of caspase-independent cell death that manifests as morphological features of necrosis [5,6].Necroptosis needs a mixed lineage kinase domain-like (MLKL) protein for plasma membrane perforation,which is frequently triggered by receptor-interacting protein kinase (RIPK) [7].Recent studies have suggested that necroptosis plays both tumor-suppressing and tumor-promoting roles in adult tumors [6,8].Conventional pro-apoptotic chemotherapies are usually ineffective for high-risk neuroblastomas.Necroptosis,a form of programmed cell death,occurs when apoptosis is blocked [9].Several drugs have been shown to induce necroptosis in neuroblastoma.Recent research indicated that necroptosis-mediated cell death was produced in MYCN-amplified neuroblastoma cell lines by the combination of rapamycin and MK-2206 [10].Another study reported that HVJ-E,a UV-treated non-replicating sendai virus,induced necroptosis in caspase-8-deficient neuroblastoma cell lines [11].Isoliquiritigenin can induce neuroblastoma cell death via necroptosis in the absence of apoptotic activity [12].However,the precise function of necroptosis in neuroblastoma has not yet been well studied.
The purpose of this study was to determine the role of necroptosis in neuroblastoma.We investigated the relationship between the necroptosis signature,immune microenvironment,and neuroblastoma outcomes using bioinformatics.We anticipate that our study will help to a deeper knowledge of necroptosis in the treatment of neuroblastoma with a high risk of recurrence.
Results
Classification of neuroblastoma based on necroptosis-related genes
The flowchart for the research is depicted in Figure 1.The necroptotic process was used to derive thirty-four necroptosis-related genes from the Gene Ontology database (GO:0070266).Thirty of the 34 necroptosis genes were expressed in the GSE49710 dataset.Based on necroptosis gene expression,we performed consensus clustering in the“ConsensusClusterPlus” package to investigate the internal connection between necroptosis and neuroblastoma.The optimal value of the clustering variable (k) was found to be 3,with strong intragroup correlations and low intergroup correlations.Based on the findings of clustering,the 498 neuroblastoma samples were divided into three clusters including 171,122,and 205 samples,respectively (Figure 2A).Three clusters manifested substantial separation in the t-distributed stochastic neighbor embedding (t-SNE) analysis (Figure 2B).The heatmap shows that cluster1 possessed the highest necroptosis gene expression while cluster2 possessed the lowest expression (Figure 2C).We qualified the necroptosis signature using a single-sample gene set enrichment analysis (ssGSEA) algorithm.cluster1 showed the highest necroptosis signature score,while cluster2 showed the lowest score(Figure 2D).Moreover,Kaplan-Meier survival curves demonstrated that cluster1 had a significantly better overall survival (Figure 2E).We investigated tumor hallmark differences between clusters using the ssGSEA algorithm.Cluster2 had the highest score for signatures related to the cell cycle and MYC targets (Figure 2F).This suggests that signatures related to the cell cycle and MYC may be very important in controlling neuroblastoma outcomes.Furthermore,the expression of potential immunotherapy targets in neuroblastoma,including GD2,L1CAM,and CD276,was evaluated.Cluster1 showed higher expression of all three molecules(Figure 2G-I).
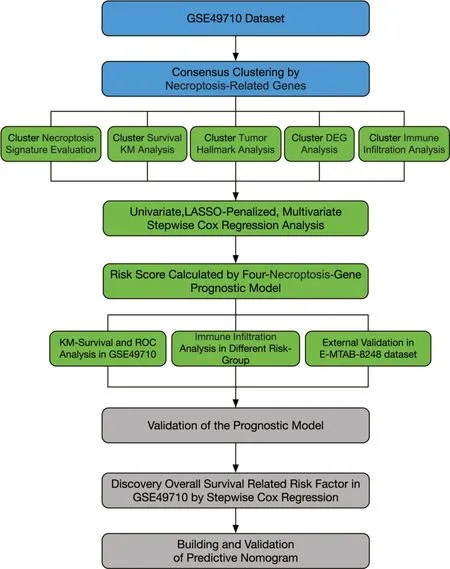
Figure 1 Schematic representation of the study’s structure
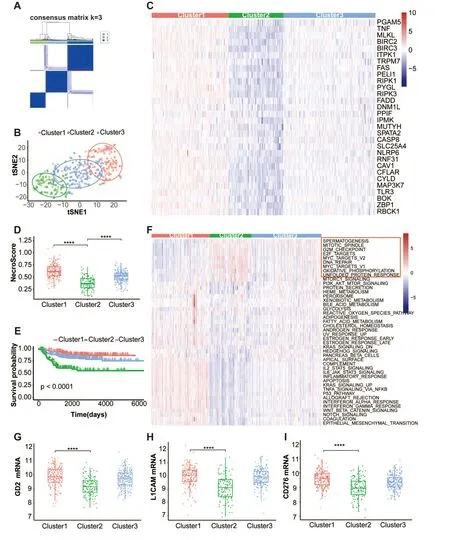
Figure 2 The classification of neuroblastoma according to genes associated with necroptosis.(A) Results of a consensus clustering analysis at k=3 for 498 individuals with neuroblastoma in the GSE49710 dataset.(B) An illustration of the three clusters using t-SNE (t-distributed SNE).(C)Heatmap shows necroptosis gene expression in three clusters.(D) Box plots of the necroptosis signature score distribution calculated by the ssGSEA algorithm in the three clusters.(E) The Kaplan-Meier overall survival curves for each of the three clusters.(F) The heatmap displays the tumor hallmark signature scores computed by the ssGSEA method in three clusters;the red rectangle emphasizes nine hallmarks with high scores in cluster2.(G-I) Box plots of the mRNA expression of the GD2(G),L1CAM (H),and CD276(I) in three clusters,GD2 synthase is used for representing the GD2 molecular.****P <0.0001.t-SNE,t-distributed SNE;ssGSEA,single-sample gene set enrichment analysis.
Cluster characteristic exploration
To identify pathway differences across clusters,we examined the differentially expressed genes (DEGs) using the criterion |logFC| >1.5 and an adjustedP-value <0.01.Three thousand five hundred sixty-nine upregulated and three downregulated genes were discovered when comparing cluster1 and cluster2 (Figure S1A).Interestingly,MYCN was one of three downregulated genes.Gene ontology(GO)and Kyoto Encyclopedia of Genes and Genomes(KEGG)pathway enrichment analyses were used to study the biological functions of the DEGs.DEGs were concentrated in biological processes associated with immune cell activation and differentiation,consistent with the function of necroptosis in controlling cell death and inflammation.The majority of cellular compartment enrichment analysis was done on the plasma membrane,which corresponded to the establishment of the immunological complex (Figure S1B).Analysis of KEGG pathways indicated that DEGs are engaged in neuroactive ligand-receptor interactions,cytokine receptor interactions,and viral protein interactions (Figure S1C),which correlate to necroptosis during viral infection.In addition,gene set enrichment analysis (GSEA) discovered the necroptosis-related chemokine signaling pathway(Figure S1D).
Survival-related necroptosis gene identification and development of a necroptosis prognostic signature
All 498 patients with overall survival information were included in the stepwise Cox regression analysis.Table S1 shows the clinical information of each patient.Using univariate Cox regression,twenty-two necroptosis-related genes were substantially correlated with overall survival(P<0.01).In univariate Cox regression analysis,PPIF,FADD,and PGAM5 exhibited a hazard ratio (HR) >1,which may serve as a promotion factor.In contrast,other genes exhibited an HR <1,which may function as protective factors in neuroblastoma(Figure 3A).Moreover,the Kaplan-Meier survival curve demonstrated that all 22 necroptosis-related genes had significantly different overall survival rates (Table S2,log-rankP-value <0.01).Furthermore,a necroptosis-related prognostic signature consisting of four genes,including PGAM5,TNF,BIRC2,and FADD,was derived via least absolute shrinkage and selection operator (LASSO)-penalized Cox and multivariate Cox regression analyses(Figure 3B-D).The risk score was calculated using the following formula:
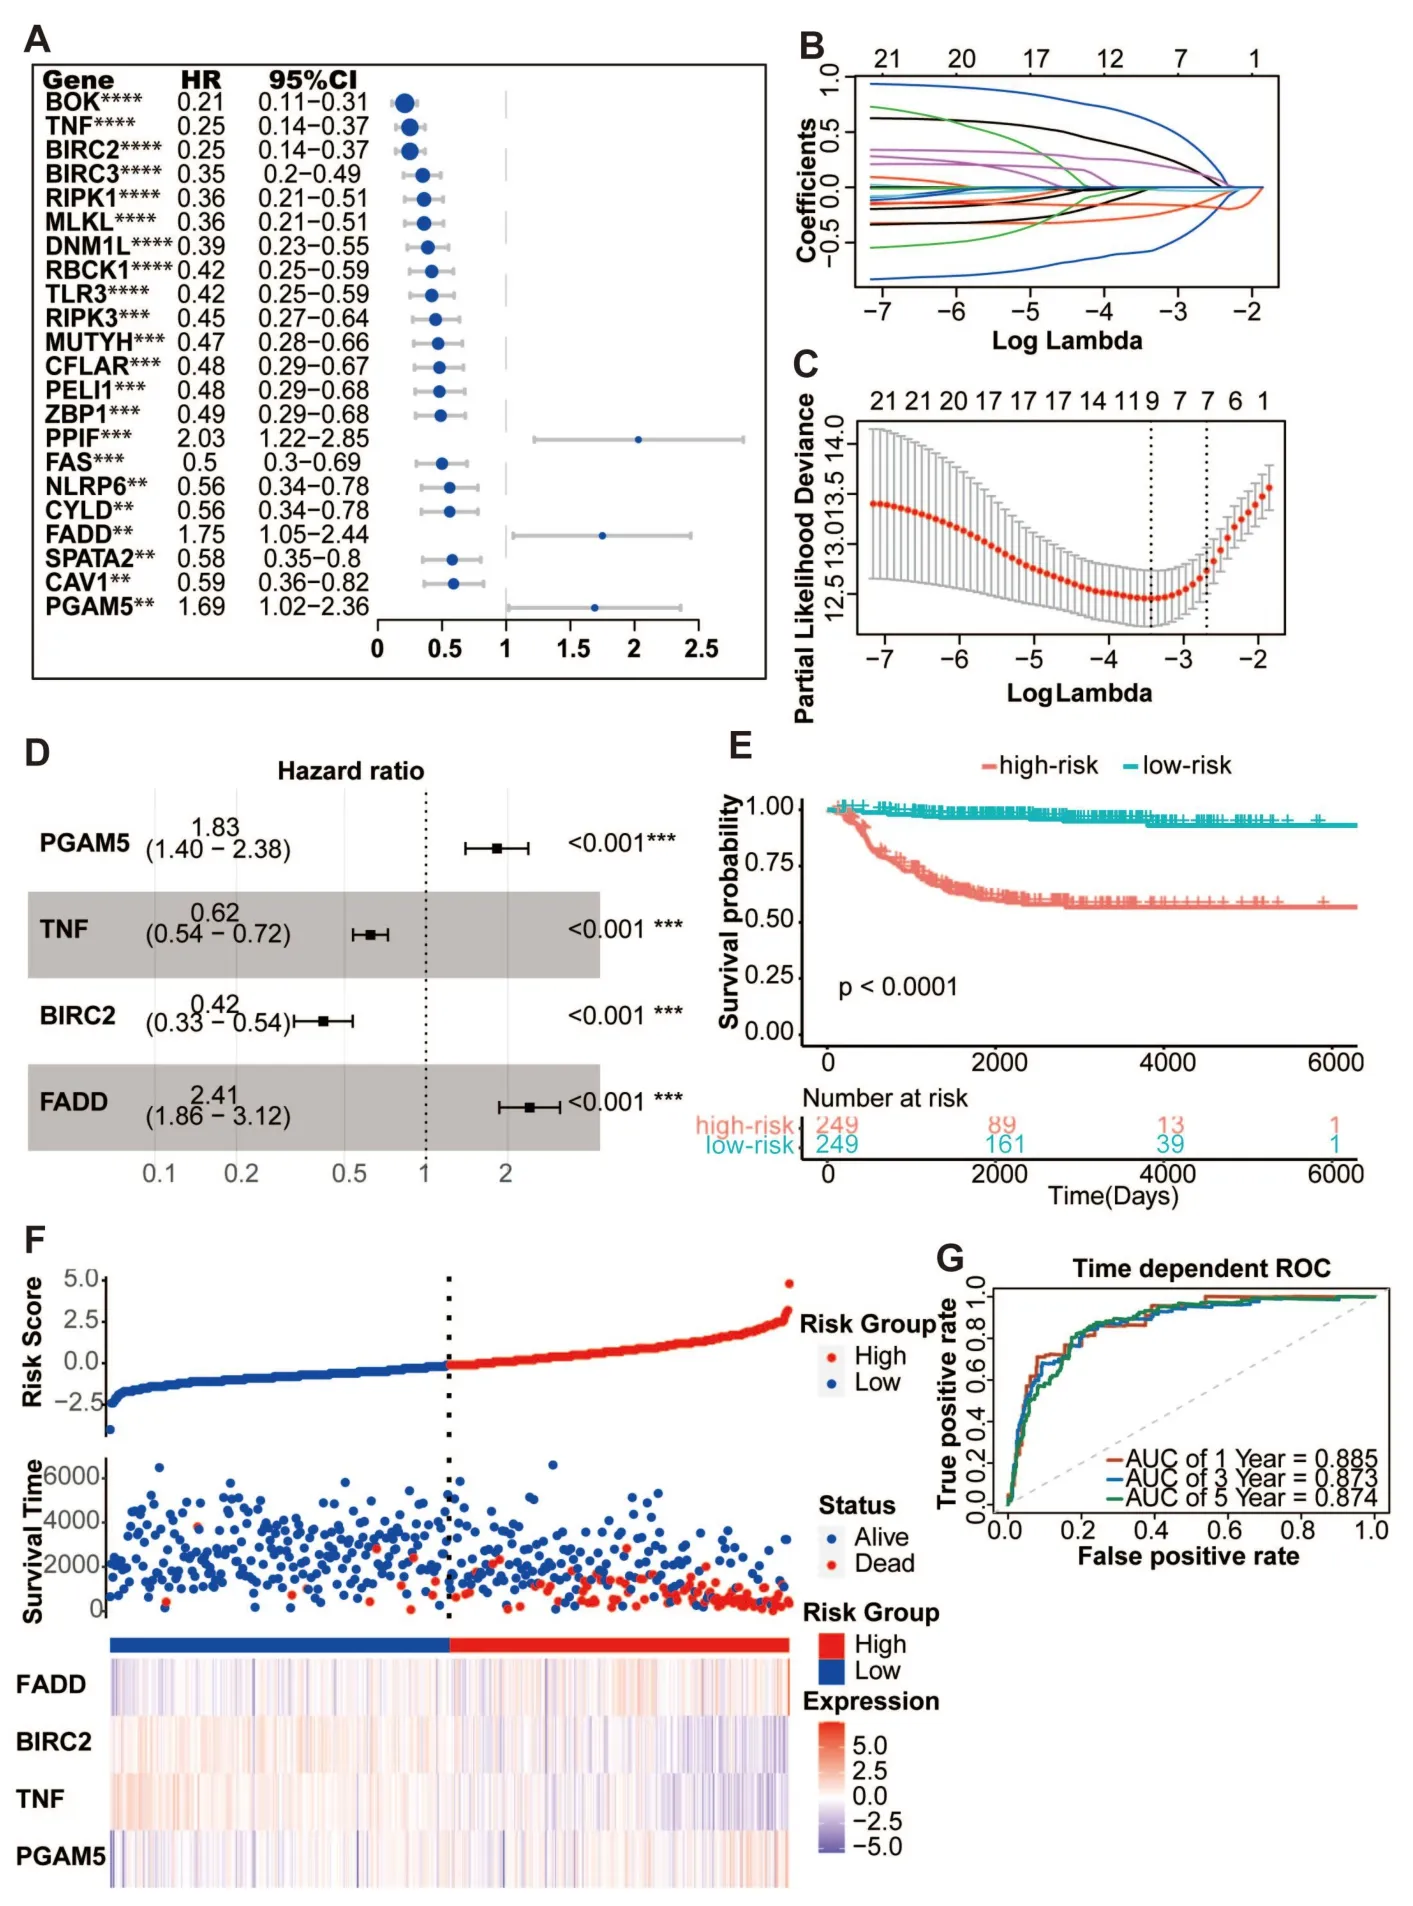
Figure 3 Construction of the predicative necroptosis signature.(A) Twenty-two necroptosis genes in the GSE49710 dataset having a P-value of less than 0.01,as determined by a univariate Cox regression analysis of overall survival.(B) A profile of the LASSO coefficients for 22 necroptosis genes.(C) Tuning the predictor selection using a 10-fold cross-validation.(D) The forest plot of the four-necroptosis-gene signature.(E) Four-gene signature Kaplan-Meier overall survival curves.The median risk score was used to divide patients from the GSE49710 dataset into two groups.(F)The risk score distribution,related survival data,and mRNA expression in the GSE49710 dataset.(G) ROC curves for the four-gene signature-based predictions of 1-year,3-year,and 5-year overall survival.**P <0.01,***P <0.001,****P <0.0001.LASSO,least absolute shrinkage and selection operator;ROC,receiver operating characteristic.
Risk score=[(0.60194) × PGAM5 expression]+[(-0.47190) ×TNF expression]+[(-0.87266) × BIRC2 expression]+[(0.87990)× FADD expression]
The cutoff value was determined to be the median risk score (1.36).Patients were separated into two separate groups.The survival curves for the low-risk score group demonstrated a positive overall survival rate (Figure 3E-F,P<0.0001).The performance of the four-gene model was evaluated using time-dependent receiver operating characteristic (ROC) and C-index.The 1-year,3-year,and 5-year area under the curve (AUC) for the model’s forecasts of overall survival were 0.885,0.873,and 0.874,respectively (Figure 3G).Predictive performance of the four-gene signature for neuroblastoma was high,as shown by a C-index of 0.835 (95% confidence interval(CI):0.800-0.870).
External validation of the signature’s predictive capability
The E-MTAB-8248 dataset was used to verify the predictive potential of the signature.Risk scores were calculated using the same method.Using the threshold value (1.36),patients were divided into high-risk and low-risk groups.In the t-SNE analysis,there was a substantial gap between the two risk categories (Figure S2A).In addition,subgroup-specific changes in overall survival were indicated by the Kaplan-Meier survival curves.Low-risk group results were superior to high-risk group outcomes (Figure S2B-C,P<0.0001) Utilizing the time-dependent ROC and C-index,the performance of the model prediction was evaluated.The 1-year,3-year,and 5-year overall survival prediction AUCs for the risk scores in the E-MTAB-8248 dataset were 0.753,0.832,and 0.816,respectively (Figure S2D).The C-index for the risk score was 0.779,with a 95% CI ranging from 0.726 to 0.832.The four-gene signature showed remarkable prognostic utility in predicting neuroblastoma outcomes in a set of independent validation experiments.
Model comparison between signature and clinical biomarkers
The International Neuroblastoma Staging System (INSS) stage is a neuroblastoma staging system based on surgical results.The INSS stage aids doctors in determining which risk group a patient belongs to and is utilized frequently in clinical practice.MYCN is the driver gene of neuroblastoma and is associated with unfavorable outcomes.The MYCN status is frequently used for neuroblastoma prognosis prediction.To demonstrate the different levels of accuracy provided by the different models,we compared the INSS stage,MYCN status,and the four-gene signature.Overall survival predictions for 1,3,and 5 years showed that the four-gene signature was more accurate than the INSS stage and MYCN status using decision curve analysis (DCA)(Figure 4A-C).The areas under the decision curve for the 1-year,3-year,and 5-year four-gene signatures were 0.0043,0.0403,and 0.0624,respectively.The areas under the decision curve for the 1-year,3-year,and 5-year INSS stages were 0.0012,0.016,and 0.028,respectively.The areas under the decision curve for the 1-year,3-year,and 5-year MYCN statuses were 0.0017,0.020,and 0.023,respectively.Moreover,based on the ROC curve,the four-gene signature demonstrated the highest prediction accuracy among the three models (Figure 4D-F).The short-and long-term AUCs of the four-gene signature model were higher than those of the INSS stage and MYCN,respectively (Figure 4G).
We compared our four-gene model with three previously published prognosis models [13-15].The AUC of the four-gene model was better than that of the published models (Figure S3A-C).The DCA curve showed the best clinical utility for the four-gene model (Figure S3D).
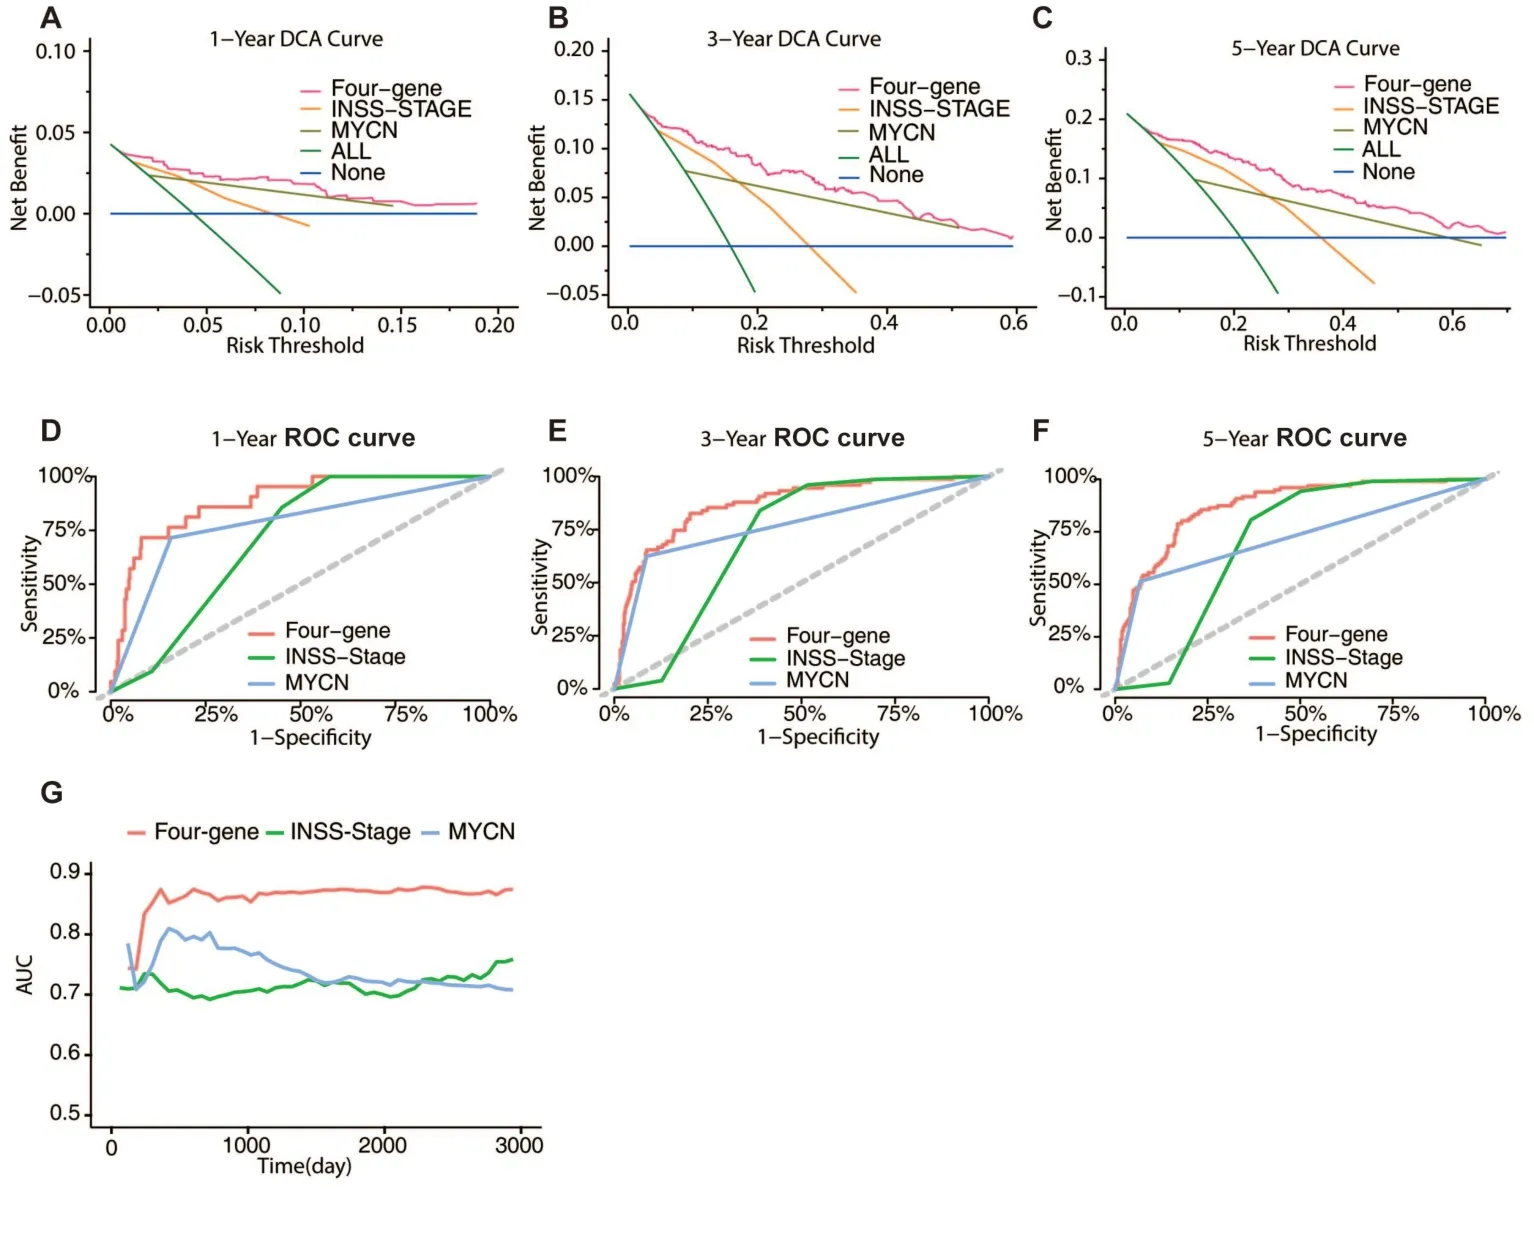
Figure 4 Model comparison between the predictive signature,INSS stage and MYCN status.(A-C) The four-gene signature,INSS stage,and MYCN status model DCA curves for 1-year,3-year,and 5-year periods.(D-F) The four-gene signature,INSS stage,and MYCN status model 1-year,3-year,and 5-year ROC curves are shown.(G) AUC values for the four-gene signature,INSS stage,and MYCN status model are shown.INSS,International Neuroblastoma Staging System;DCA,decision curve analysis;ROC,receiver operating characteristic;AUC,area under the curve.
Association of clinical-pathology and tumor immunity with the four-gene signature
Associations between the signature and INSS stage,MYCN,and tumor development in neuroblastoma were analyzed in the GSE49710 dataset.There was a correlation between the higher risk scores and the more advanced stages of neuroblastoma (Figure 5A).Except for stage4S,the risk scores increased from stage1 to stage4.Patients with MYCN amplification had significantly higher risk scores (Figure 5B).In addition,those with higher risk ratings were more likely to have tumor progression(Figure 5C).
We used the ESTIMATE method to analyze stromal and immune cell infiltration into tumors and to discover differences in tumor immunity across subgroups.Scores for immune and stromal cells were greater in the low-risk group than in the high-risk group,indicating that there was more infiltration of these types of cells in the low-risk group(Figure 5D-F).Tumor-infiltrating immune cells were tracked down with the use of the MCP-count and CIBERSORT algorithms.The low-risk group had a higher concentration of antitumor immune cells such cytotoxic lymphocytes,natural killer cells,and memory T cells(Figure 5G-H).
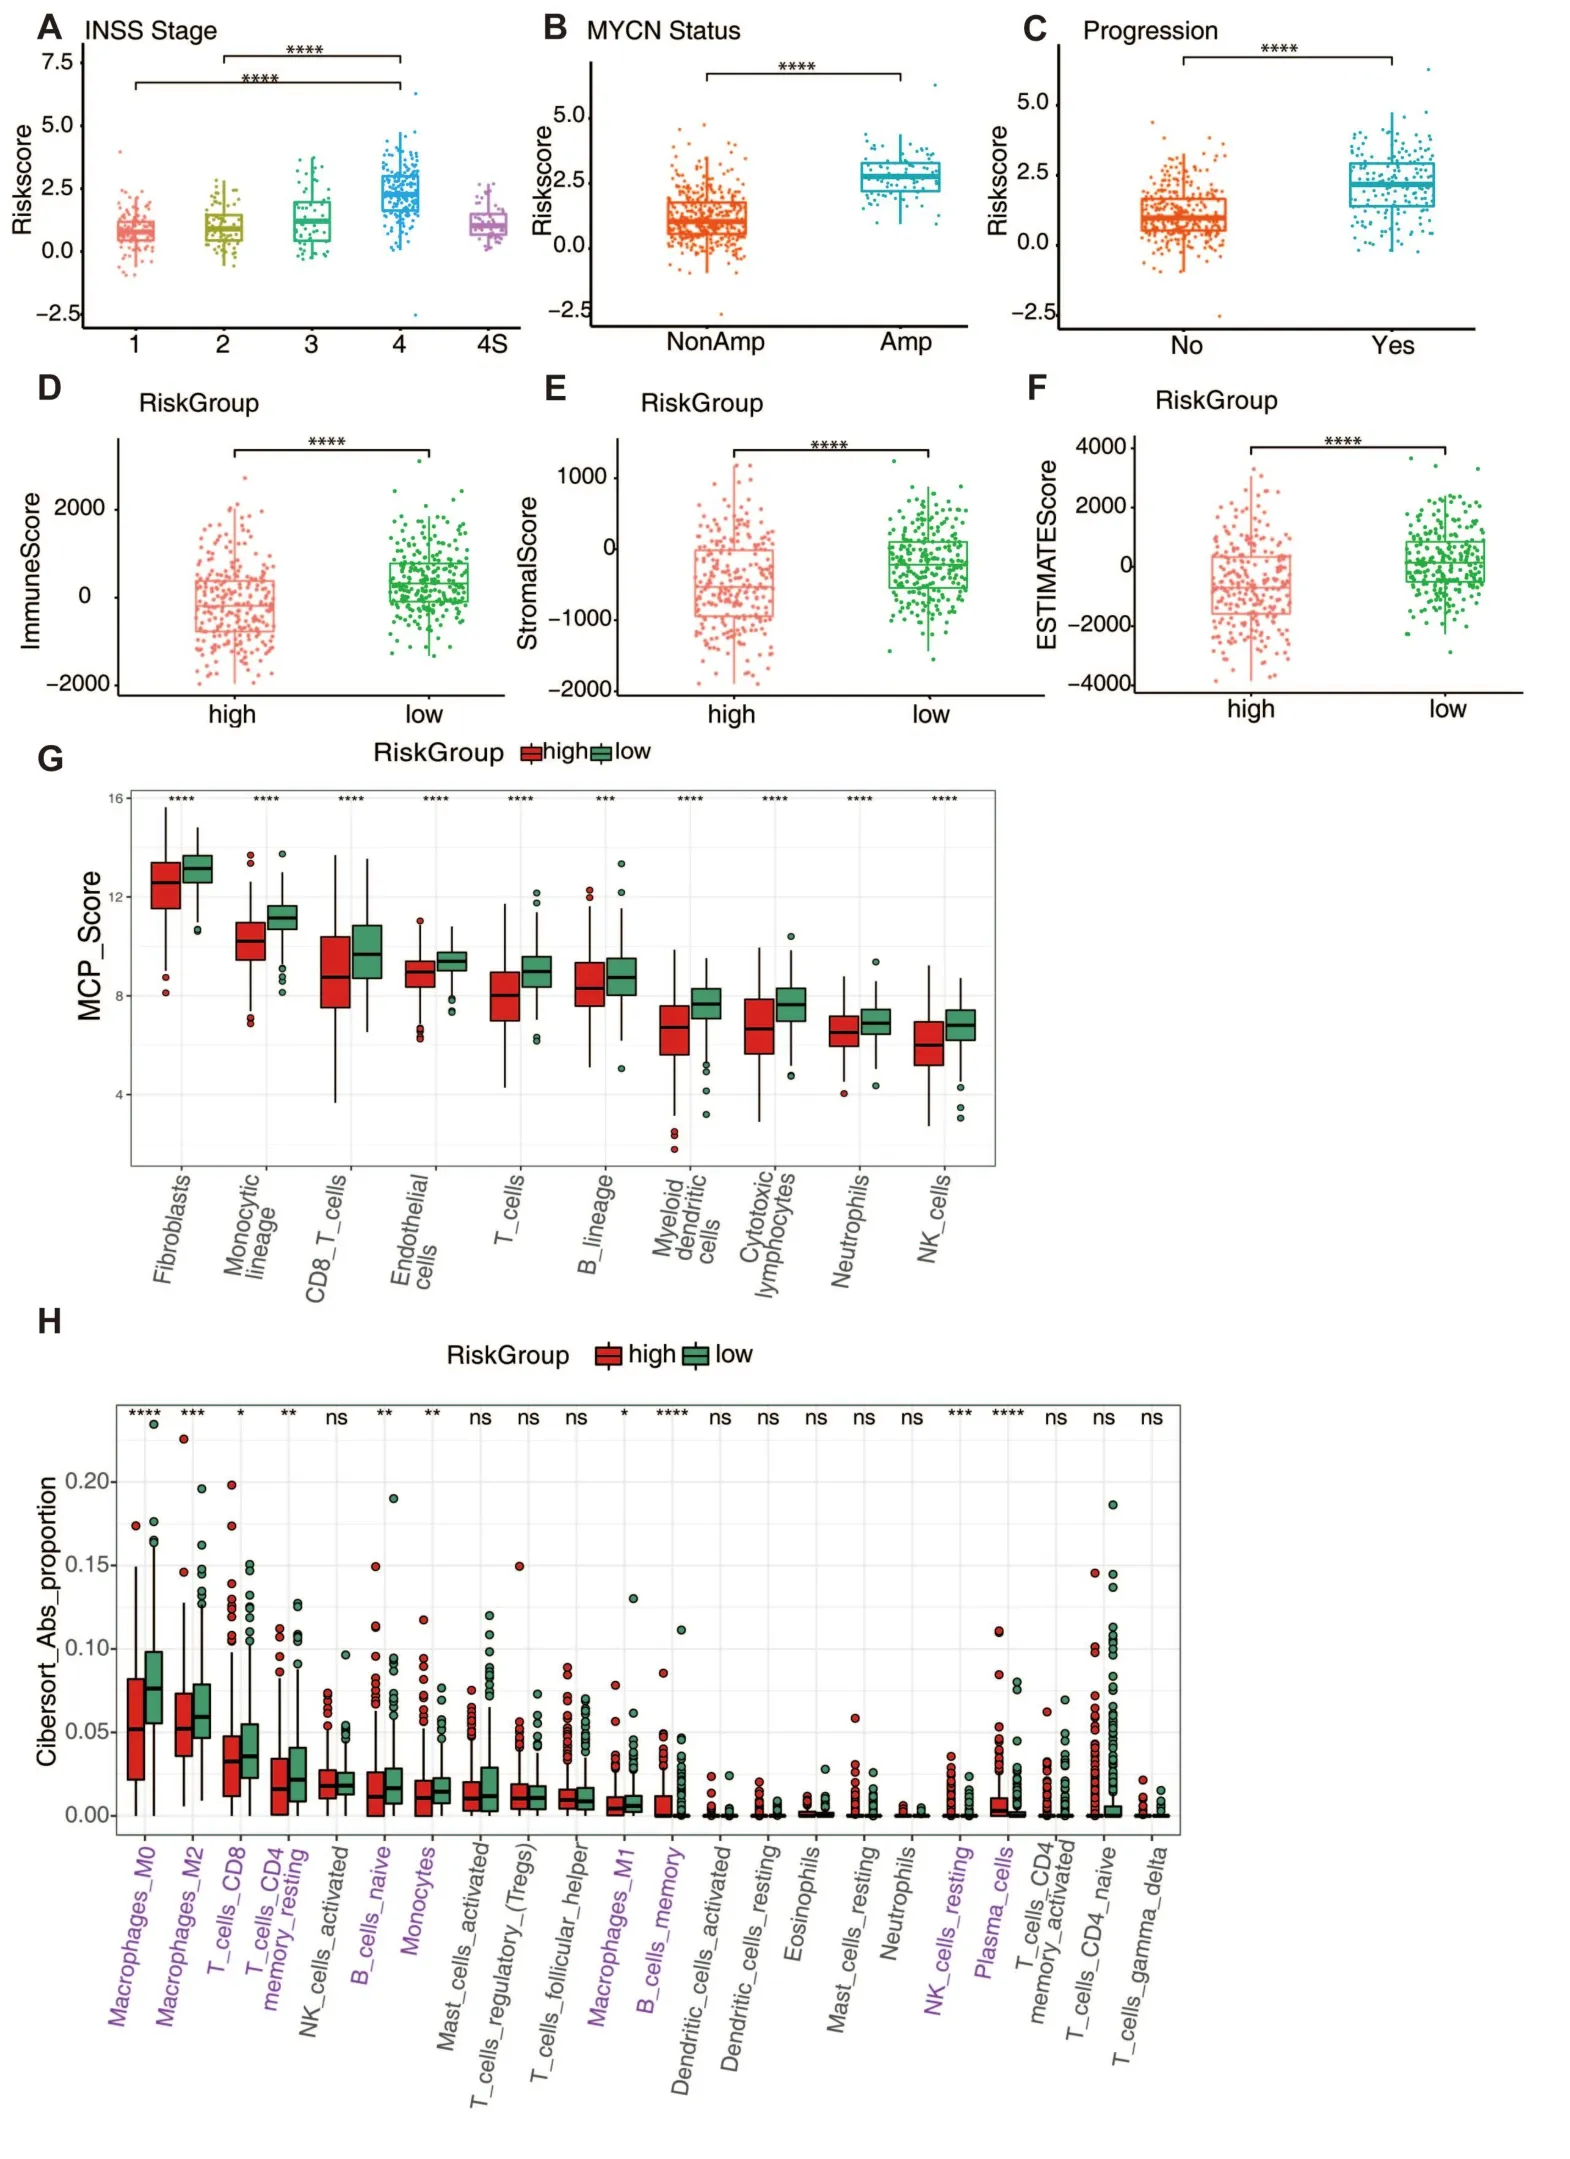
Figure 5 The predictive signature’s clinical relevance and tumor immunity.(A-C) Show risk score distribution in INSS stage groups,MYCN status,and tumor progression status in GSE49710.(D-F) Show the immunological,stromal,and estimation scores in high-and low-risk groups.The ESTIMATE algorithm was used to calculate scores.(G) Show the score of eight types of immune cells in two risk groups.Estimated scores were calculated by the MCP-Count algorithm.(H) Show the estimated proportions of 22 immune cells in two risk groups.Estimated proportions were calculated by the CIBERSORT algorithm.Immune cells that are statistically distinct from one another are indicated in pink.n.s.,not significant,*P<0.05,**P <0.01,****P <0.0001.INSS,International Neuroblastoma Staging System.
Neuroblastoma prognostic factors and the construction nomogram model
All available clinical data from 493 participants was used for additional analysis.The use of univariate and multivariate Cox regression analyses allowed for the identification of independent neuroblastoma prognostic variables.The risk score (P=3.6e -14),age(P=6.7e-13),INSS stage(P=2.8e-13),and MYCN(P=2.2e-16) were all substantially linked with overall survival in a univariate Cox analysis (Figure 6A).In addition,the results of a multivariate Cox analysis demonstrated that the risk score,age,INSS stage,and MYCN were each independent neuroblastoma prognostic variables (Figure 6B).The findings of the multivariate Cox regression analysis were used to create a nomogram that could predict the 1-year,3-year,and 5-year overall survival rates (Figure 6C).Based on their nomogram scores,patients were classified into one of three categories.The high-risk group had worse outcomes,according to the Kaplan-Meier plot,which distinguished risk groups (Figure 6D-E,P<0.0001).Overall survival estimates from the nomogram model had AUCs of 0.904,0.919,and 0.914 at 1,3,and 5 years,respectively (Figure 6F).The nomogram model has a C-index of 0.861 (95% CI,0.834-0.888).Also,the 1-year,3-year,and 5-year survival calibration plots showed that the nomogram provided reliable predictions of neuroblastoma outcomes (Figure 6G-I).

Figure 6 Construction of the predictive nomogram.(A) Overall survival-related parameters in the GSE49710 dataset were analyzed using univariate Cox regression.(B) A forest plot depicting the parameters of the GSE49710 dataset that are associated with overall survival.(C) A predictive nomogram for neuroblastoma that predicts overall survival at 1-year,3-year,and 5-year.(D) The nomogram’s overall Kaplan-Meier survival curves.The nomogram score was used to divide the patients in the GSE49710 dataset into three groups.The significance level was determined by using a log-rank test.(E) The nomogram score distribution and related survival statistics in the GSE49710 dataset.(F) Overall survival prediction ROC curves for 1-year,3-year,and 5-year using the nomogram model in the GSE49710 dataset.(G-I) The 1-year,3-year,and 5-year calibration plots used to verify the accuracy of the nomogram are shown.The X-axis shows the expected overall survival rate,while the Y-axis shows the actual overall survival rate.n.s.,not significant,***P <0.001.ROC,receiver operating characteristic.
Discussion
The present research discovered a significant connection between necroptosis signature,the immune cell landscape of neuroblastoma,and outcomes.Neuroblastoma with a high level of necroptosis displayed positive results and enhanced infiltration of antitumor immune cells.Functional enrichment analyses revealed that the anti-tumor immune response plays a pivotal role in necroptosis,which is consistent with the inflammatory characteristics of necroptosis [6].The principal pathway involved in this process is the chemokine signaling pathway,which is a crucial mediator of the inflammatory process [16].MYCN amplification is observed in 20% of neuroblastomas,and is predictive of poor survival [17,18].However,MYC family proteins are considered“undruggable”due to the lack of a targetable surface [17,19].Surprisingly,we found that neuroblastoma with high necroptosis harbors low MYCN expression and a lower MYC target-related tumor hallmark score.Previous studies have found that cytosolic MYC protein is a negative regulator of necroptosis.MYC protein in the cytosol prevents necrosome formation by directly interacting with RIPK3 [20].Further studies on the necroptosis signature and MYCN expression may unravel new therapies for MYCN-amplified neuroblastoma.
Numerous neuroblastoma prognosis signatures have been built,but research using necroptosis genes to predict neuroblastoma outcomes has not been reported [21-23].To the best of our knowledge,our study is the first to explore necroptosis-related genes in neuroblastoma survival prediction and immune cell infiltration.Stepwise Cox regression analysis was used to construct the prognostic model.Subsequently,we built a prognostic signature containing PGAM5,TNF,BIRC2,and FADD,which demonstrated superior predictive ability compared to traditional biomarkers.Upregulated PGAM5 and FADD were linked to poor survival,while TNF and BIRC2 acted as tumor suppressors.Patients were classified into high-and low-risk groups based on their four-gene signature.The high-risk group manifested unfavorable outcomes and was poorly immunogenic.Additionally,numerous known risk factors for neuroblastoma are associated with a high-risk score.Collectively,these findings indicate that high-risk patients exhibit aggressive characteristics.The four-gene signature was shown to properly predict the outcome of neuroblastoma as well as immune infiltration when it was subjected to external validation.It was shown that an integrated nomogram of neuroblastoma that was based on the four-gene signature and pathological features performed very well in outcome prediction.
The four genes in the prognosis model correlated with tumor progression and prognosis in adult tumors.PGAM5 is a mitochondrial phosphatase that is required for necroptosis induced by TNF-α [24].PGAM5 expression in hepatocellular carcinoma is higher than that in normal tissues,and PGAM5 induces chemoresistance by enhancing anti-apoptotic signaling and independently predicts poor prognosis[25].The expression of PGAM5 in colorectal tissues is lower than that in normal tissues [26].Therefore,PGAM5 may play a unique role in different tumor types.We found that PGAM5 appeared to be a cancer-promoting gene in neuroblastoma,positively associated with poor survival.FADD is part of most signalosome complexes,including the necroptosome,innateosome,and inflammasome [27].FADD may be a potential cancer driver through amplification,which is associated with tumor metastasis and poor oral and breast cancer outcomes [28,29].In our study,FADD exhibited tumor-promoting roles in neuroblastoma,in which high expression was correlated with poor outcomes.The mechanism by which FADD overexpression promotes metastasis requires further investigation.TNF is a pleiotropic cytokine involved in immune system homeostasis,inflammation,and host defense [30].TNF exerts antitumor and protumor effects in multiple tumors.TNF sensitizes neuroblastoma cells to FasL-induced cell death by upregulating Fas,implying that TNF enhances the efficacy of neuroblastoma treatments [31].We found that TNF plays a cancer-protective role in neuroblastoma,which is negatively associated with poor survival.BIRC2 is a protein that belongs to the family of proteins known as inhibitors of apoptosis (IAP),and it plays a crucial part in the regulation of nuclear factor-B (NF-kB)signaling as well as apoptosis [32].BIRC2 promotes breast tumor development and reduces anti-tumor immune cell infiltration,hence diminishing the efficacy of anti-PD1 therapy [33].Significantly poorer outcomes were related with high BIRC2 expression in squamous cell cancer [34,35].However,we discovered that BIRC2 is a cancer-preventative gene in neuroblastoma,and that its overexpression is linked with a positive result.It is not yet clear how BIRC2 controls the outcomes of neuroblastoma,but this is something that has to be investigated.
Immunotherapy is a hot topic for tumor treatment.Due to a paucity of anti-tumor immune cell infiltration and a modest mutation load,neuroblastoma is immunologically “cool” [36].While PD-1 and PD-L1 antibodies show remarkable activity against adult malignancies,they have little effect on the prognosis of neuroblastoma [36].To far,dinutuximab,an anti-GD2 antibody,has been the sole immunotherapy option for patients with high-risk neuroblastoma.Dinutuximab significantly increased two-year event-free survival but had a modest effect on five-year overall survival [4].Dinutuximab failed to induce long-lasting immunological memory,preventing the relapse of high-risk neuroblastoma [37].Therefore,establishing immunological memory and changing the immune milieu such that it stimulates rather than suppresses activity might be potentially useful.Necroptosis,an inflammatory cell death,has both a tumor suppressor and promoter function in adult malignancies.Increased necroptosis in neuroblastoma correlates with increased infiltration of cytotoxic T lymphocytes and natural killer (NK) cells,as well as memory lymphocytes,higher expression of GD2 synthase,and better prognosis.Patients with neuroblastoma who also have activated NK cells have a higher chance of survival.NK cell-mediated cellular cytotoxicity is key to the mechanism of anti-GD2 treatment.Adoptive transfer of NK cells in conjunction with anti-GD2 antibodies significantly improves neuroblastoma patient survival [38].High levels of cytotoxic T cell infiltration into the tumor microenvironment (TME) are predictive with better patient outcomes [39].Better survival rates have been associated with memory T cells in various solid tumor types [40].In urothelial carcinoma and melanoma,patients with memory B cells show clinical benefits from anti-PD1 therapy [41].The GD2 synthase gene is directly responsible for GD2 production,and a high copy number of GD2 synthase is associated with a high level of GD2 expression in neuroblastoma [42].Therefore,high necroptosis neuroblastoma manifested more GD2 expression and the immunogenic “hot”.Combining anti-GD2 antibody with activating necroptosis may improve the response to high-risk neuroblastoma immunotherapy.
Our research indicates that the immune landscape and outcome of neuroblastoma are connected to the necroptosis signature.However,this research was not without limitations.First,previous studies have shown that anti-tumor immune cells in neuroblastoma are unresponsive;necroptosis-induced anti-tumor immune reactivity is an area that needs further investigation.Second,the model was developed using public datasets that were not validated by our cohort sample.The correlation between the necroptosis signature score and the status of neuroblastoma necroptosis requires further investigation.
Our results show that the necroptosis signature is linked to better neuroblastoma outcomes and immune cell infiltration.This is the first bioinformatics examination of the necroptosis signature in neuroblastoma,as far as we are aware.Our results open the door to further research into necroptosis-inducing treatments for high-risk neuroblastoma.
Materials and methods
Acquisition of the expression data and related clinical information
Gene Expression Omnibus (GEO) accession number GSE49710(https://www.ncbi.nlm.nih.gov/geo/query/acc.cgi?acc=GSE49710,N=498) and ArrayExpress accession number E-MTAB-8248(https://www.ebi.ac.uk/arrayexpress/experiments/E-MTAB-8248,N=223) were used to collect the neuroblastoma gene expression matrix and related clinical data,respectively.The prognostic model was built using the GSE49710 dataset and verified using the E-MTAB-8248 dataset.
Consensus clustering
Genes associated with necroptosis were identified using the gene ontology database and obtained from the necroptotic process(GO:0070266) and listed in Table S3.The expression of necroptosis-related genes was normalized to the median value prior to clustering.Neuroblastoma samples were clustered using the pam(partitioning around medoids) method in the “ConsensusClusterPlus”software [43].The item resampling was set to 0.8,with a maximum evaluated k of 8.Random seeds were utilized to ensure the repeatability of the outcomes.
Signature score calculation
The ssGSEA method included in the “IOBR” package was used to determine the signature scores,which included necroptosis and tumor hallmark scores [44].For the necroptosis score,the minimum gene count was set to 2.The minimum gene count for the tumor hallmark score was 5.
Identification and functional analysis of DEGs
The clustering findings were used to categorize the patients.Probes were annotated using an annotation file.When a gene matches multiple probes,the highest expression value represents gene expression.For group comparisons of DEGs,we used the “limma”package and the following criteria: |log2 (fold-change)| >1.5 and adjustedP-value <0.01 [45].The GO,KEGG,and GSEA analysis of the DEGs were performed in the “ClusterProfiler” package [46].Statistical significance was assumed when the adjustedP-value was less than 0.05.
Assessment of tumor immunity
The ESTIMATE method was used to determine stromal,immune,and estimated scores[47].The MCP-count algorithm was used to calculate scores to eight immune cells [48].The CIBERSORT algorithm was used to analyze the distribution of 22 different types of immune cells[49].
Establishment of the predictive necroptosis signature and model comparison
A multi-stage Cox regression analysis was used to develop the prognostic signature.Genes having aP-value of less than 0.01 in the univariate Cox analysis were considered significant,and the LASSO-Cox analysis was performed on those genes.The LASSO-Cox regression analysis was used to cut down on the number of genes in the “glmnet” package that had the highest predictive performance with tenfold cross-validation.Multivariate Cox regression analysis optimized the number of genes using the minimum Akaike information criterion (AIC) value following LASSO-Cox analysis.A predictive gene signature for neuroblastoma was created based on a linear combination of regression coefficients (β) multiplied by its mRNA expression level.Patients were classified as high-or low-risk based on the median risk value of the predictive signature.Area under the ROC curve,Kaplan-Meier analysis,and Harrell’s concordance index (C-index) were used to assess the performance of the signature.Effectiveness and clinical value of models were compared using ROC and DCA curves.Curves for ROC and DCA were generated using the“survivalROC” and“ggDCA” packages,respectively.
Signatures were validated using the E-MTAB-8248 dataset.The risk score was derived using a formula identical to that used for the GSE49710 dataset.The patients were separated into low-and high-risk groups based on the GSE49710 dataset's calculated cutoff value.Comparing the outcomes of the two groups helped evaluate the prognostic model.
Construction of predictive nomogram
Univariate Cox regression analysis was used to determine independent prognostic markers based on age,INSS stage,MYCN status,and sex.AP-value of less significance was set atP<0.05.The attributes were used to build a predictive nomogram for predicting 1-year,3-year,and 5-year overall survival of neuroblastoma after the proportional hazards assumption was tested using the Schoenfeld residuals in the“survminer” package.Area under the receiver operating characteristic,Harrell’s C-index,and a calibration plot were used to assess the performance of the nomogram.Nomogram points were used to classify patients into three groups,and Kaplan-Meier analysis was used to generate survival curves.
Statistical analysis
Statistical analyses were performed using RStudio (version 1.1.463).When comparing overall survival rates between groups,the Kaplan-Meier approach was utilized.Analysis of parameters related to overall survival was conducted using univariate,LASSO-penalized,and multivariate Cox regression.Comparing immune cell infiltration across groups was done using the Mann-Whitney test.Unless otherwise stated,aP-value of less than 0.05 was considered statistically significant.

- Medical Data Mining的其它文章
- Clinical significance of DNAH14 gene in uterine corpus endometrial carcinoma based on bioinformatics
- The role of CXCL chemokine family in the development and prognosis of colorectal cancer
- Integrated bioinformatics analysis of potential biomarkers and candidate drugs of esophageal squamous cell carcinoma
- Construction of prognostic model of cervical cancer based on necroptosis-related lncRNAs
- Increased expression of TUBA1C predicts poor prognosis of breast cancer by regulating cell cycle
- Analysis of low expression of ferroptosis-related gene DECR1 on poor prognosis and immune cell defects of bladder urothelial carcinoma