
Increased expression of TUBA1C predicts poor prognosis of breast cancer by regulating cell cycle
2022-08-23 01:02:54YanWangYangLiuJianLi
Medical Data Mining 2022年3期
Yan Wang ,Yang Liu ,Jian Li
1College of Information Science and Engineering,Shandong Agricultural University,Tai’an 271018,China.2Department of Hepatobiliary Surgery,The Affiliated Tai’an City Central Hospital of Qingdao University,Tai'an 271000,China.3Department of Breast Disease Diagnosis and Treatment,The Affiliated Tai’an City Central Hospital of Qingdao University,Tai'an 271000,China.
Abstract Background: A kind of tubulin called TUBA1C is implicated in the occurrence and growth of a number of cancers.We mainly investigated the expression,prognostic significance,mechanism and interaction with immune infiltration of TUBA1C in breast cancer patients.Methods: The expression of TUBA1C as well as its associations with clinical traits and prognosis were examined using the Cancer Genome Atlas,DepMap and Human Protein Atlas databases.The primary pathway involved in breast cancer based on TUBA1C was examined using gene set enrichment analysis software,CancerSEA and the GSCALite database.Then,using ssGSEA and Spearman methods,the interaction between TUBA1C and immune cell infiltration was examined.The R package “pRRophetic” investigated the sensitivity of TUBA1C to chemotherapy and targeted treatment drugs.Results: Patients with BC had significantly higher levels of TUBA1C expression.The poor prognosis of breast cancer patients was linked to the increased expression of TUBA1C.The expression of TUBA1C was identified as an independent risk factor for breast cancer by univariate and multivariate Cox regression analysis.An examination of the gene set enrichment analysis and CanerSEA databases revealed that TUBA1C primarily engages in the cell cycle and DNA replication pathways to have a carcinogenic effect.Th2 cells,aDC,Th1 cells,macrophages,NK CD56dim,neutrophils,DC,Treg,pDC,CD8 T cells,mast cells,NK cells and eosinophils were the 13 types of tumor immune infiltrating cells that TUBA1C was associated with by ssGSEA.Additionally,we discovered that TUBA1C was closely associated with a number of chemotherapy and targeted therapy medications.Our findings suggest that TUBA1C is a novel prognostic predictor of breast cancer,related to immune infiltration and drug sensitivity,and may serve as a new target for breast cancer treatment in the future.Conclusion: According to our study,TUBA1C exerts a carcinogenic effect in breast cancer through oncogenic pathway such as the cell cycle and is associated with immune cell infiltration and predicts response to chemotherapy and targeted therapy.
Keywords: TUBA1C;breast cancer;immune infiltration;cell cycle;prognosis
Background
According to the International Agency for Research on Cancer’s GLOBOCAN 2020 estimations,breast cancer (BC) is the most prevalent cancer in women globally.Nearly 10 million people will die from cancer worldwide in 2020,according to estimates of 19.3 million new cases.Female breast cancer has surpassed lung cancer in prevalence as the most frequent cancer and it accounts for 6.9% of all cancer-related fatalities [1].Age,stage and molecular subtype are regarded to be clinicopathological factors that are closely associated with prognosis in the current clinical treatment of breast cancer.These factors also affect the patient’s eligibility for chemotherapy,radiation,endocrine therapy and targeted therapy.There are still some BCs with a bad prognosis,including human epidermal growth factor receptor type 2 (HER2) positive and triple-negative breast cancer,despite significant advancements in clinical treatment [2,3].In order to further enhance the therapeutic effect of breast cancer,it is vital to discover novel molecular biomarkers.
There are five tubulin subtypes that have been identified in humans:α,β,γ,δ and ε-tubulin;microtubes are hollow tubes with a diameter of 25nm,composed of αβ-tubulin heterodimers,which are dynamically assembled into hollow nanotubes composed of protofilaments [4,5].Microtubules are the basic components of the cytoskeleton and play a vital role in various cell functions,from the positioning of organelles,providing channels for long-distance transportation and ensuring the correct and timely separation of chromosomes during mitosis[6].
Tubulin Alpha 1c (TUBA1C) is a subclass of α-tubulin,the principal building block of microtubules and binds to two moles of guanosine triphosphate.The exchangeable site on the beta chain is occupied by one mole and the non-exchangeable site on the alpha chain by the other mole.Recent research has shown that TUBA1C is considerably up-regulated in a number of cancers,has a role in tumor incidence and is significantly related to poor prognosis in conditions including pancreatic cancer,liver cancer,lung cancer,glioma,etc.[7-10].Previous research has demonstrated that TUBA1C expression is up-regulated in breast cancer compared to normal breast tissue and may be connected to taxane treatment resistance [11].However,its precise function in breast cancer and its connection to prognosis is still unknown.It is possible to turn into a potential target of BC by conducting a thorough analysis of its significant role in BC.
In our study,we analyzed the expression and mutation of TUBA1C in BC based on TCGA and various databases and analyzed the relationship between its expression and clinicopathological characteristics and prognosis.The signal transmission pathways in BC that TUBA1C mostly engages in were examined using GSEA.The ssGSEA method was used to analyze the relationship between the expression of TUBA1C in BC and the infiltration of immune cells.Subsequently,we used the R package "pRRophetic" to analyze further the expression of TUBA1C and the sensitivity of BC to chemotherapy and targeted therapies.The research results proved that TUBA1C played a vital role in the occurrence and development of BC.Therefore,our research focuses on the impact of TUBA1C overexpression on the potential biological function and prognostic significance of BC.
Materials and methods
Data collection and processing
We obtained the Cancer Genome Atlas (TCGA) breast cancer gene sequencing,mutation and clinical data from the Genomic Data Commons’s official website (https://portal.gdc.cancer.gov/).We did log2 conversion on ribonucleic acid sequencing data after converting it from fregments per kilobase per million to transcripts per million reads format.The expression differences of TUBA1C in pan-cancer and normal tissues were analyzed by the Oncomine(http://www.oncomine.org) and Tumor Immune Estimation Resource(https://cistrome.shinyapps.io/timer/)online databases.The expression of TUBA1C messenger ribonucleic acid (mRNA) in BC cells and the CERES score analysis from the CRISPR/Cas9 screening experiment were performed from the DepMap(https://depmap.org/portal/) portal website.The Expression 21Q3 Public and DepMap 21Q3 Public CERES data sets were chosen.The Human Protein Atlas database was used to analyze the difference in protein expression levels of TUBA1C in breast cancer and normal tissues.
The relationship between TUBA1C gene expression and clinicopathological characteristics
First of all,the clinicopathological characteristics of high and low expression groups according to the median value of TUBA1C were compared by using the Wilcoxon rank sum test or Pearson chi-square test and the baseline data was displayed in Table 1.Tumor-immune System Interactions Database (TISIDB) is a website for the interaction between genes and tumor immunity.We analyzed the correlation between TUBA1C gene expression and breast cancer molecules and immune subtypes by the TISIDB website.
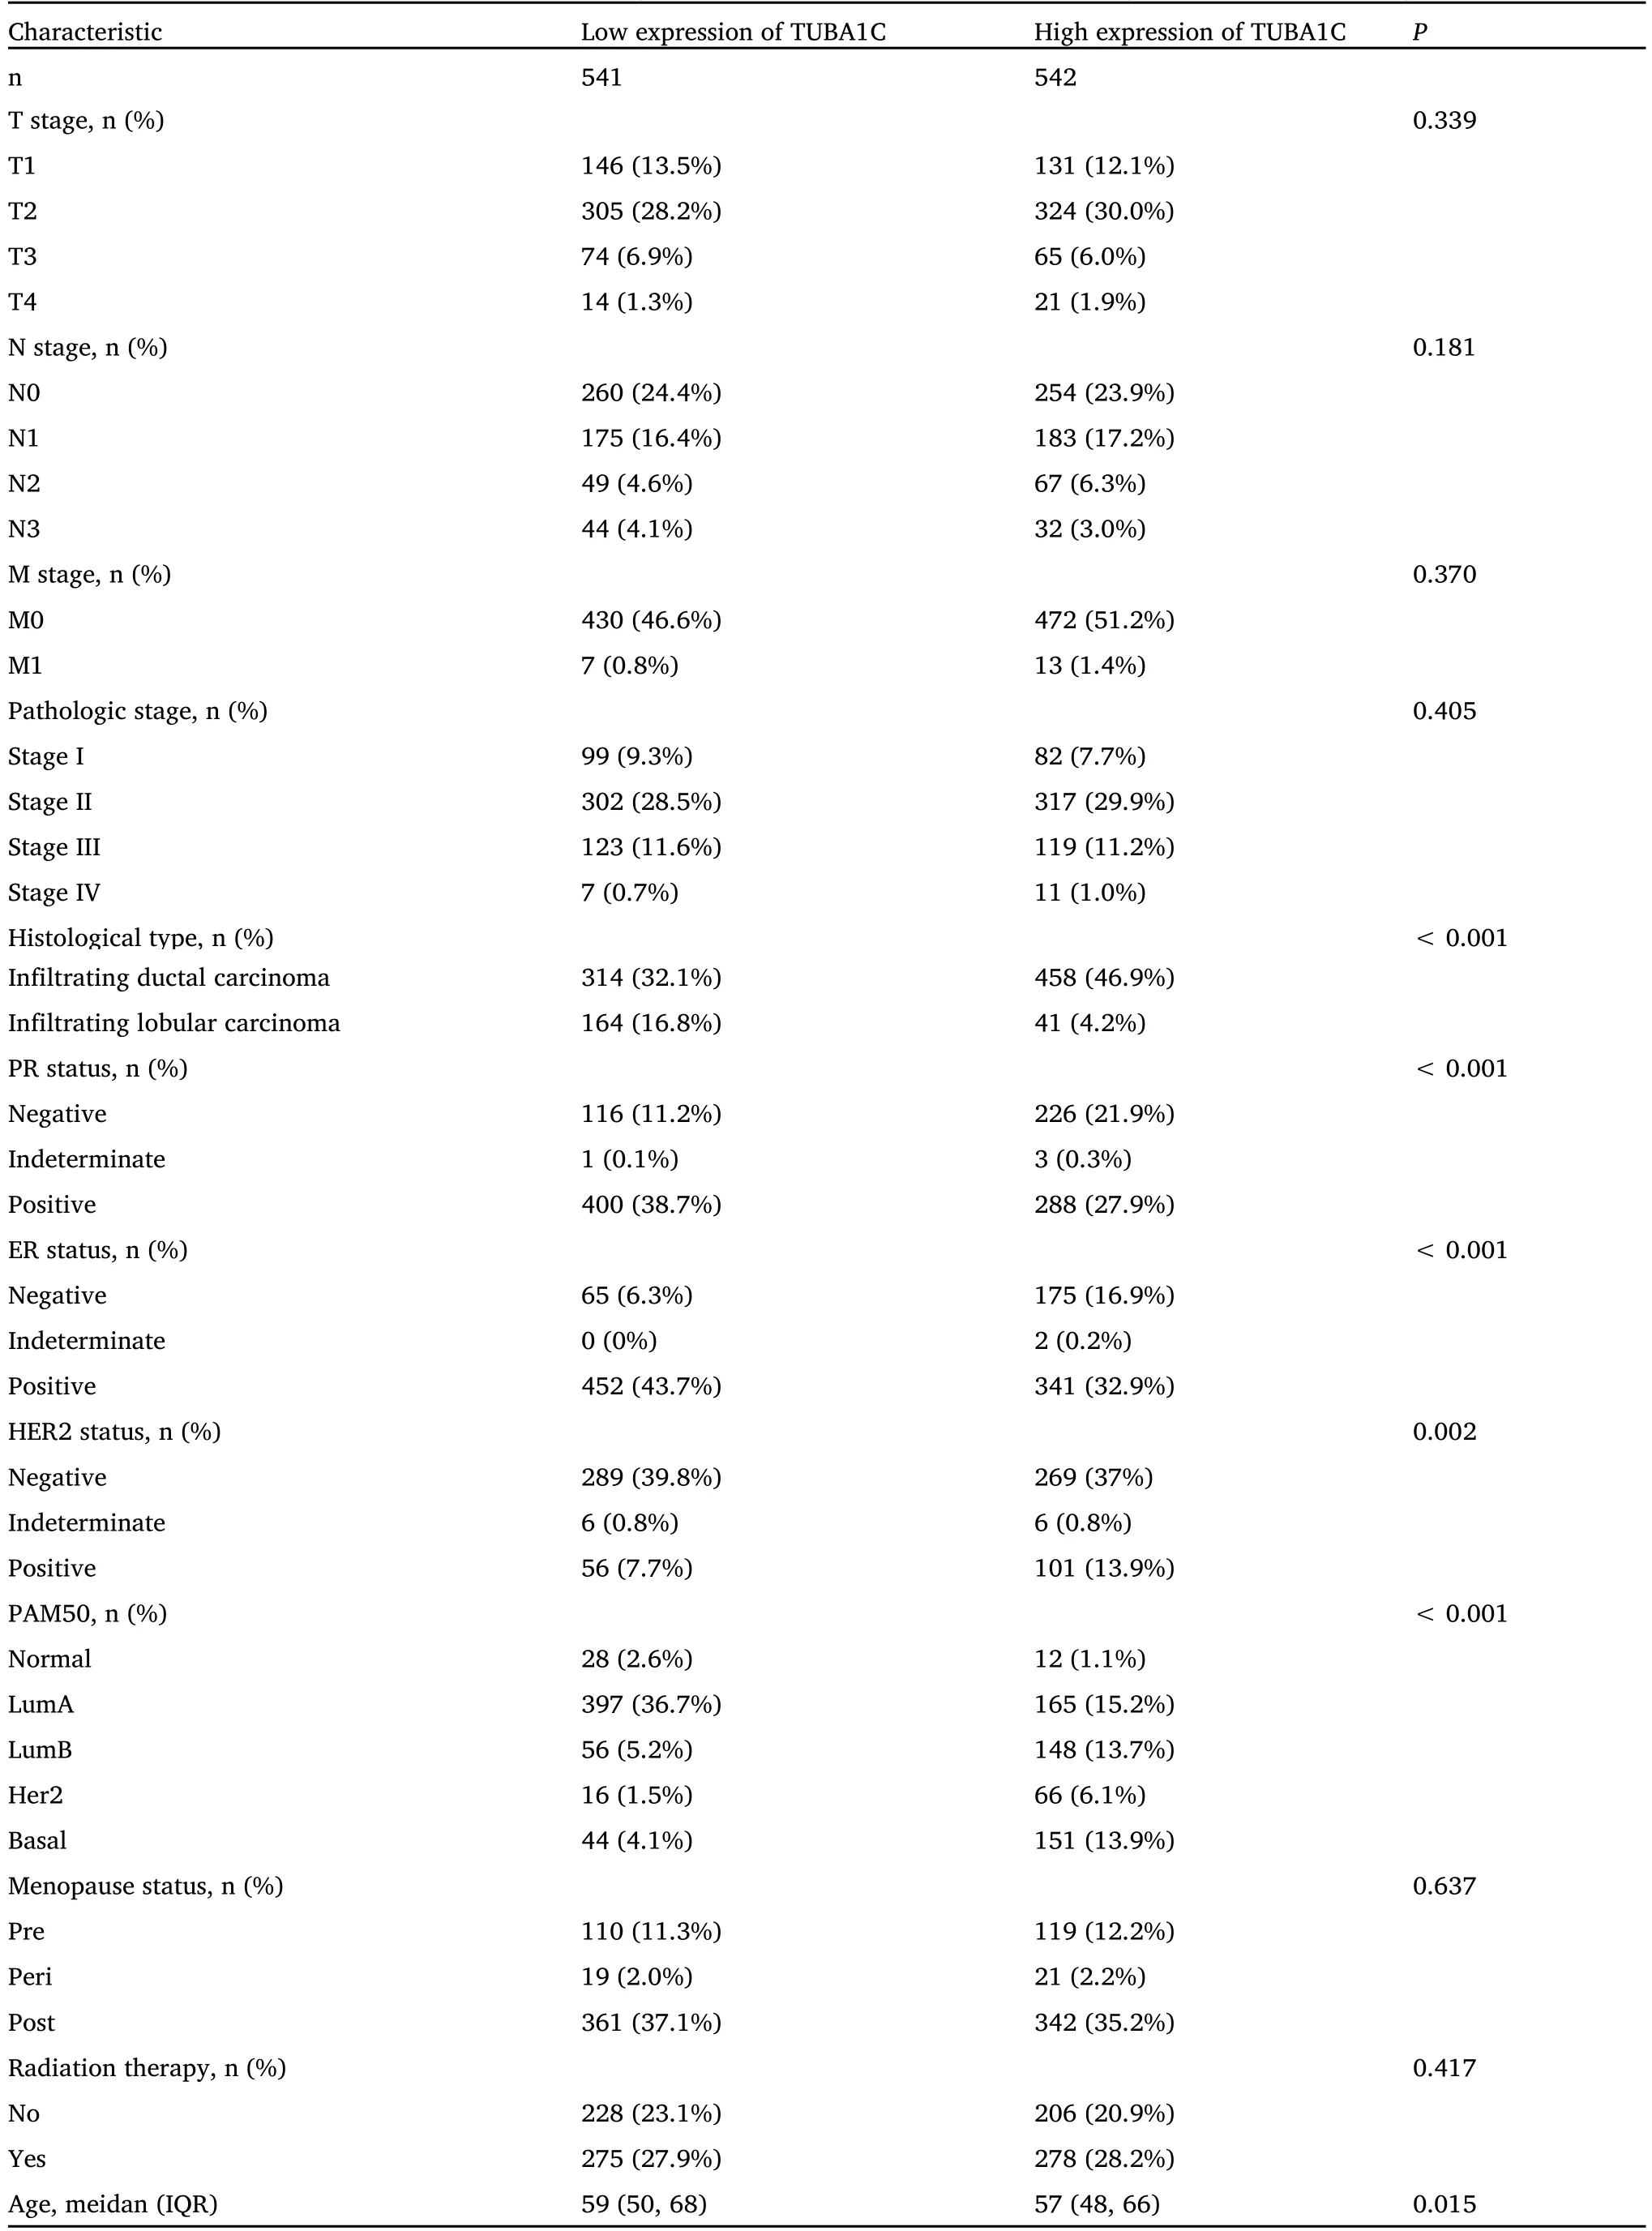
Table 1 Comparison of clinicopathological characteristics between TUBA1C high and low expression groups
Mutation analysis of TUBA1C in BC
The TUBA1C mutation in the breast was assessed using the TCGA’s mutation data on breast cancer.The samples were separated into high and low expression TUBA1C groups and the chi-square test was used to assess the difference of gene mutation frequency between the two groups.
Pathway enrichment analysis
To explore the potential biological roles of TUBA1C,gene set enrichment analysis (GSEA) was conducted by the GSEA 4.1.0 software.The reference gene set used in GSEA was the c2.cp.kegg.v7.0.symbols.gmt gene set obtained from the Molecular Signatures Database.Clusters are deemed statistically significant when the false discovery rate is less than 0.25 and theP-value is less than 0.05.Utilizing the data from CancerSEA’s pan-cancer single cell expression,investigate how TUBA1C is related to 14 functional states in various malignancies.
The importance of TUBA1C expression in breast cancer for diagnosis and prognosis
Receiver operating curve (ROC) analysis was used to evaluate the prognostic significance of TUBA1C expression in the diagnosis of BC.The prognostic study used Kaplan-Meier analysis,univariate and multivariate Cox regression analysis methods to determine the overall survival (OS),progression-free interval and disease-specific survival(DSS) rate.The R software package “rms” was used to construct nomograms and calibration curves.The above statistical analysis was performed by R(v4.0.2)andP-value ≤0.05 is regarded as significant.
The correlation of TUBA1C and immune cell infiltration in BC
Firstly,we used the ssGSEA method in the R software package “Gene set variation analysis” to evaluate the degree of infiltration of 24 immune cells.Next,Spearman analysis was used to evaluate the correlation of TUBA1C expression and immune cell infiltration.
Drug sensitivity analysis
Based on the database of Genomics of Drug Sensitivity in Cancer,the R package “pRRophetic” was used to predict the drug sensitivity of each tumor sample;the half-maximal inhibitory concentration (IC50)estimated value for each specific drug treatment was calculated.
Statistical analysis
All statistical analysis were performed by R language (version 4.0.2).Survival analysis was performed by the Kaplan-Meier method.chi-square test or Fisher’s exact test was used for the analysis of clinical data.Spearman correlation coefficient was used to evaluate the relationship between TUBA1C expression,immune infiltration and immune checkpoint gene expression.
Results
TUBA1C expression levels in BC
In order to determine the difference in the expression of TUBA1C mRNA in tumor and normal tissues,we first used Oncomine and Tumor Immune Estimation Resource databases to obtain the difference in mRNA expression of TUBA1C in pan-cancer (Figure 1A,Figure 1B).The results show that the expression of TUBA1C was significantly higher in many types of tumors compared with normal tissues.In breast cancers,the expression of triple-negative BC subtypes was the highest.When analyzing the expression of TUBA1C in various BC cells using expression 21Q3 public in the Depmap database,we found that MDAMB231 BC cells (a triple-negative breast cancer cell)had the highest expression (Figure 2A).DepMap 21Q3 public CERES was used to analyze the effect of TUBA1C gene deletion on cell proliferation.The results showed that the loss of TUBA1C gene expression had a greater impact on the proliferation of various BC cells (Figure 2B).Human Protein Atlas database analysis showed that the expression of TUBA1C protein in BC patients was significantly higher than that in normal tissues(Figure 2C).
Figure 1 mRNA expression comparison of TUBA1C between BC and normal tissue.(A) The pan-cancer expression of TUBA1C in Oncomine database;(B) the pan-cancer expression of TUBA1C in TIMER database.BC,breast cancer;TUBA1C,tubulin Alpha 1c;TPM,transcripts Per Million.TIMER,Tumor Immune Estimation Resource.

Figure 2 mRNA expression of TUBA1C in BC cell and protein expression between BC and normal tissue.(A) The TUBA1C expression in cell level of DepMap database;(B) the effect of TUBA1C gene deletion on cell proliferation;(C) TUBA1C protein expression in BC.mRNA,messenger ribonucleic acid;TUBA1C,tubulin Alpha 1c;BC,breast cancer.
Comparison of clinicopathological characteristics grouped by TUBA1C expression
We obtained the baseline characteristics of 1,083 BC patients from the TCGA database and divided them into high and low two groups according to the expression level of TUBA1C.The Wilcoxon rank sum test and the chi-square test were used to compare the level of TUBA1C.The clinical characteristics between the groups are shown in Table 1.P<0.05 was considered statistically significant.The results showed that there were significant differences in age,histological type,ER (estrogen receptor),PR (progesterone receptor),HER2 and PAM50 molecular typing between the two groups (P<0.05).
Correlation between TUBA1C expression and BC molecular or immune subtypes
The relationship between TUBA1C expression and BC molecular subtypes were investigated using the TISIDB database and discovered that basal cell molecular subtypes had the greatest TUBA1C expression(Figure 3A).At the same time,we observed that the expression of TUBA1C was different among BC immune subtypes (C1,wound healing;C2,IFN-γ dominant;C3,inflammation;C4,lymphocyte loss;C5,immune calm;C6,TGF-b dominant),the highest expression was the C2 subtype(Figure 3B).
Mutation analysis of TUBA1C
As can be seen from Figure 4A,the mutation frequency of TUBA1C in BC was 0.81%,with 7 missense mutations and 1 deletion mutation(Figure 4A).Then the samples were divided into two groups according to the expression median level of TUBA1C.It can be noticed that TP53(45.2%,P=7.1e -27) and PIK3CA (43.4%,P=5.6e -5) had the largest mutation difference between the two groups.TP53 has a higher mutation frequency in the high expression group,while PIK3CA has a higher mutation frequency in the low expression group(Figure 4B).
Gene set enrichment analysis of TUBA1C
In order to evaluate the pathway of TUBA1C in BC patients,we divided the patients into high and low groups according to the TUBA1C median expression value and performed GSEA analysis.As shown in Figure 5,we found that multiple pathways related to cell proliferation were enriched,including cell cycle,DNA replication,pyrimidine metabolism,basic transcription factors,homologous recombination and oocyte meiosis.
Pathway enrichment analysis of TUBA1C at the single-cell level
In order to further explore the mechanism of TUBA1C at the single-cell level,we used the CancerSEA database to carry out the pan-cancer function analysis of the TUBA1C.Its function was predicted from 14 aspects,including cell cycle,apoptosis,DNA repair and so on.The size of the dot indicates the strength of the association and the color indicates positive or negative correlation.As shown in Figure 6,in most cancers,including BC,TUBA1C was significantly positively correlated with angiogenesis,cell cycle,proliferation,DNA repair,epithelial-mesenchymal transition,invasion and metastasis.The results were consistent with our function predictions,indicating that TUBA1C was likely to play an essential role in promoting proliferation and metastasis of BC cells.
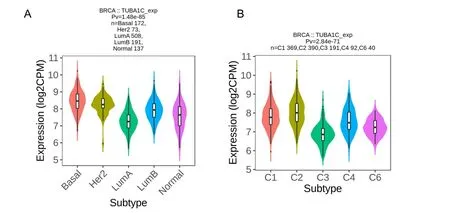
Figure 3 Expression of TUBA1C mRNA in breast cancer molecules and immune subtypes.(A) TUBA1C expression in different breast cancer molecular subtypes;(B) TUBA1C expression in different breast cancer immune subtypes.TUBA1C,tubulin Alpha 1c;CPM,counts per million.
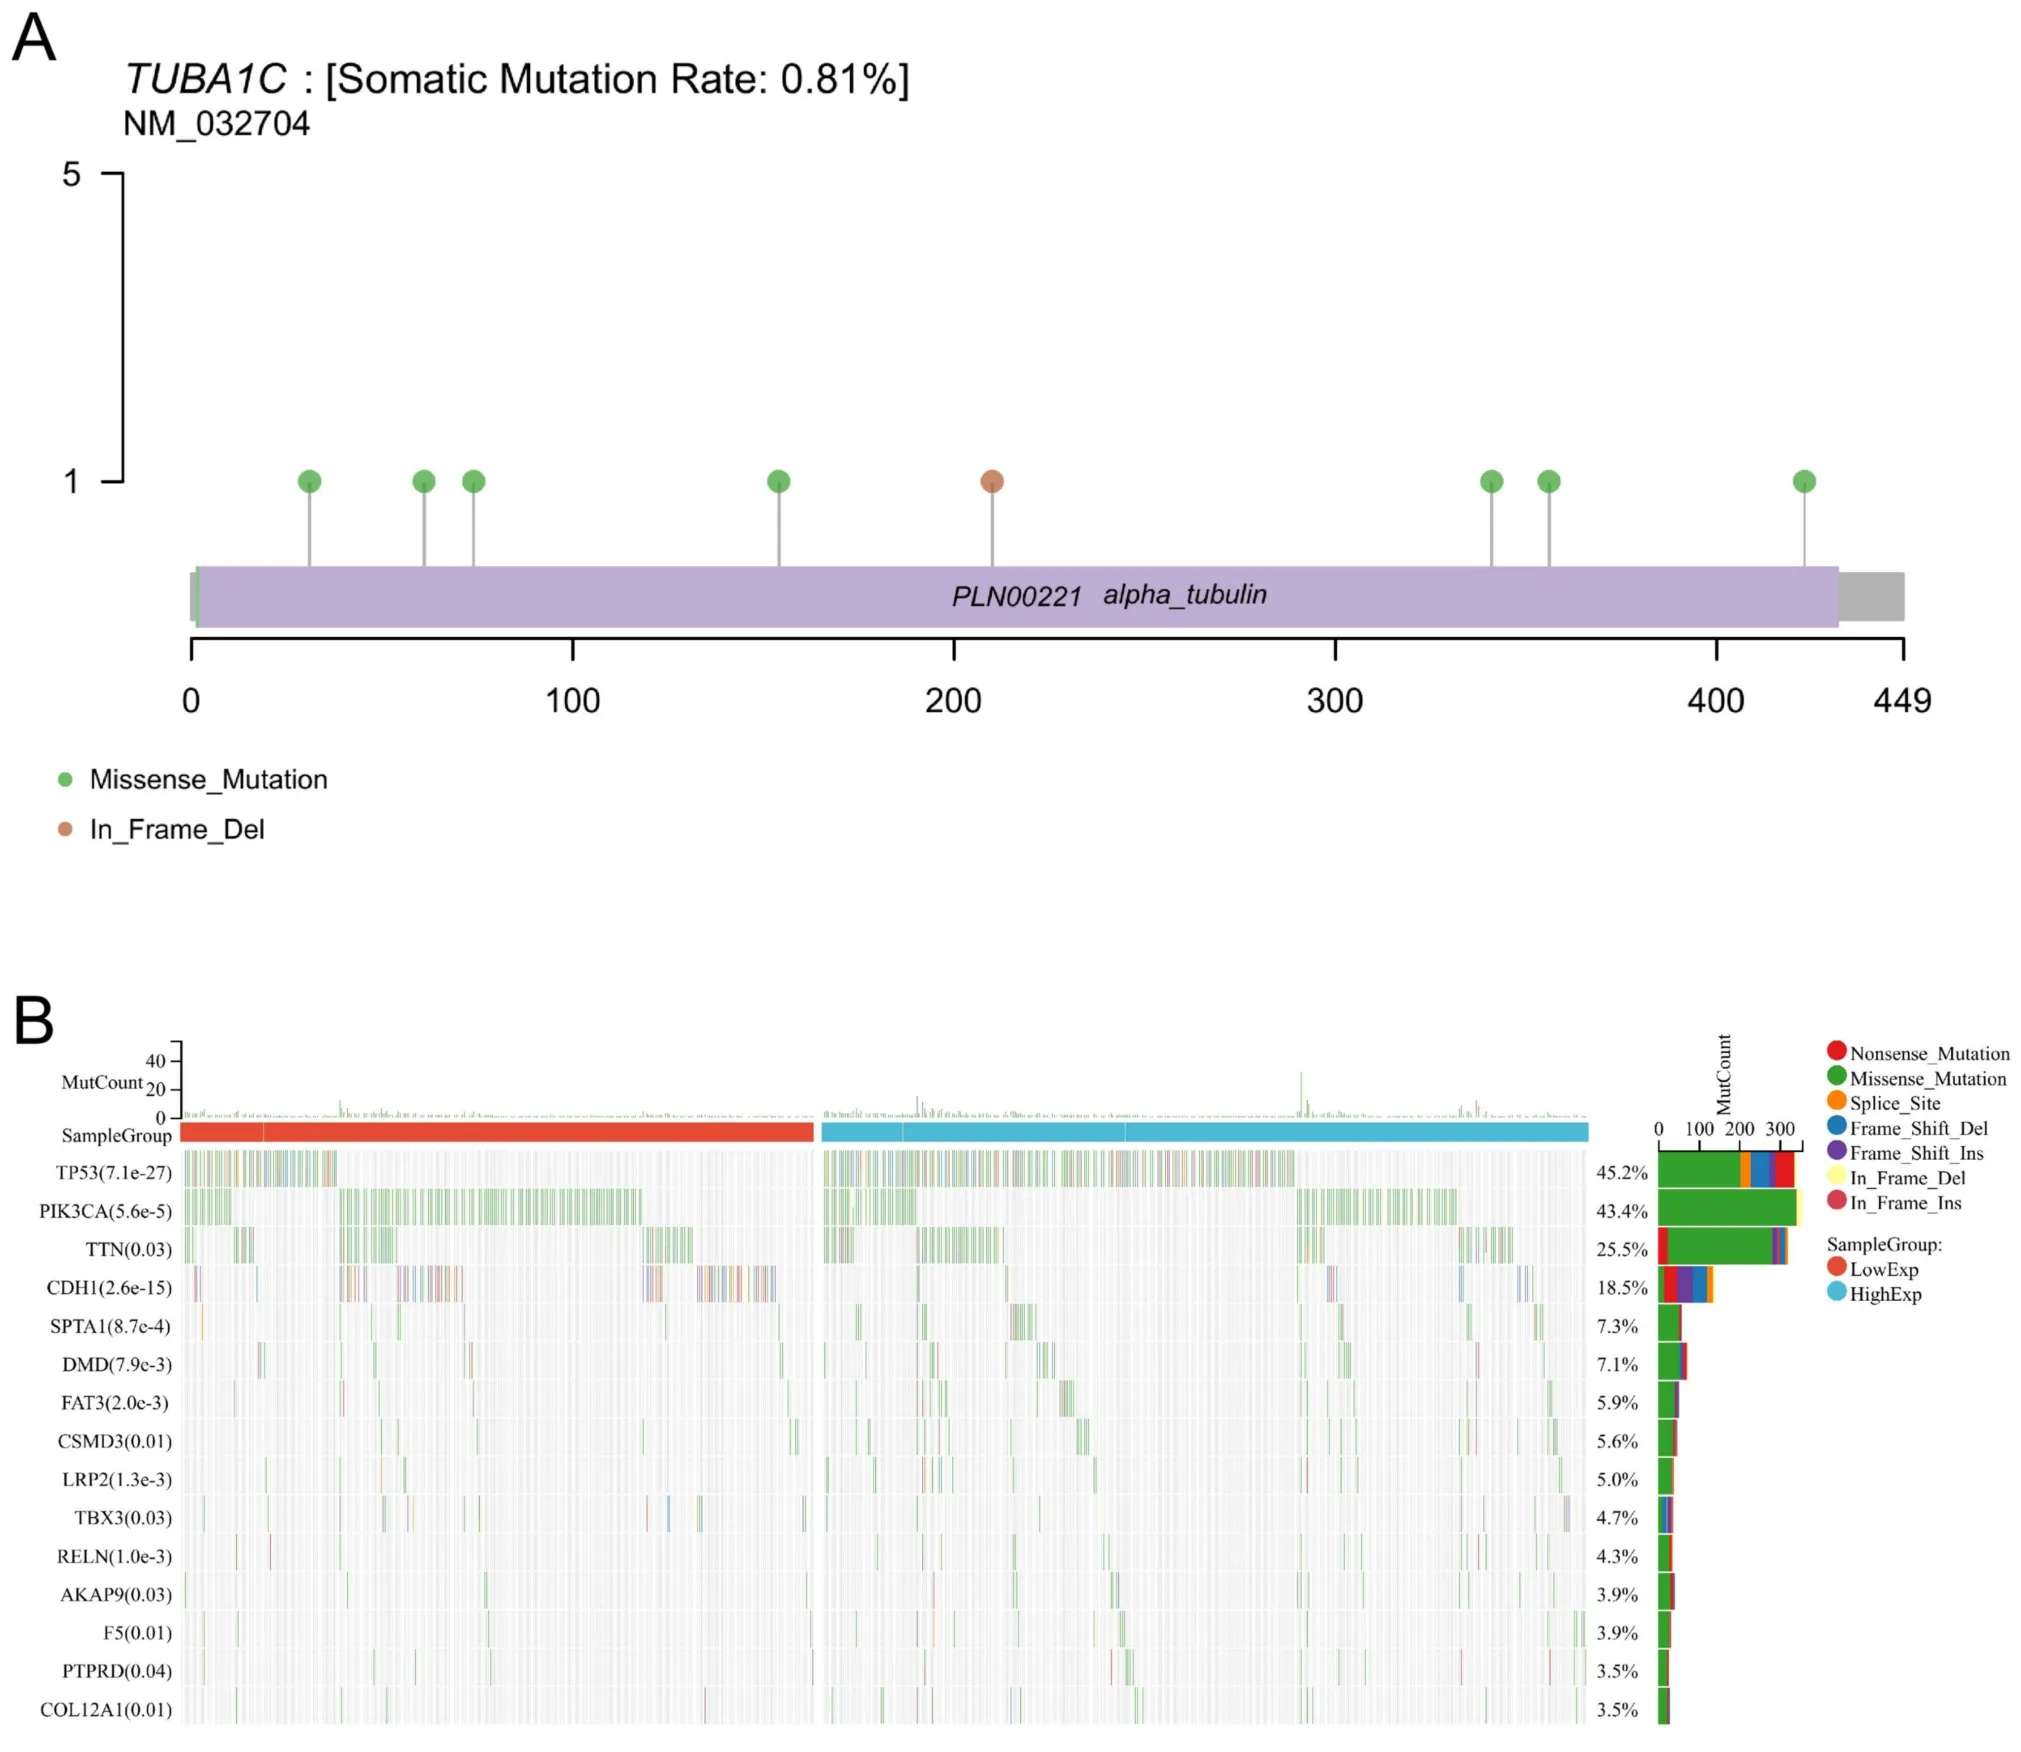
Figure 4 Mutation analysis of TUBA1C in TCGA samples.(A) The mutation frequency of TUBA1C in breast cancer;(B) the mutation difference between high and low TUBA1C expression group.TUBA1C,tubulin Alpha 1c;TCGA,the Cancer Genome Atlas.
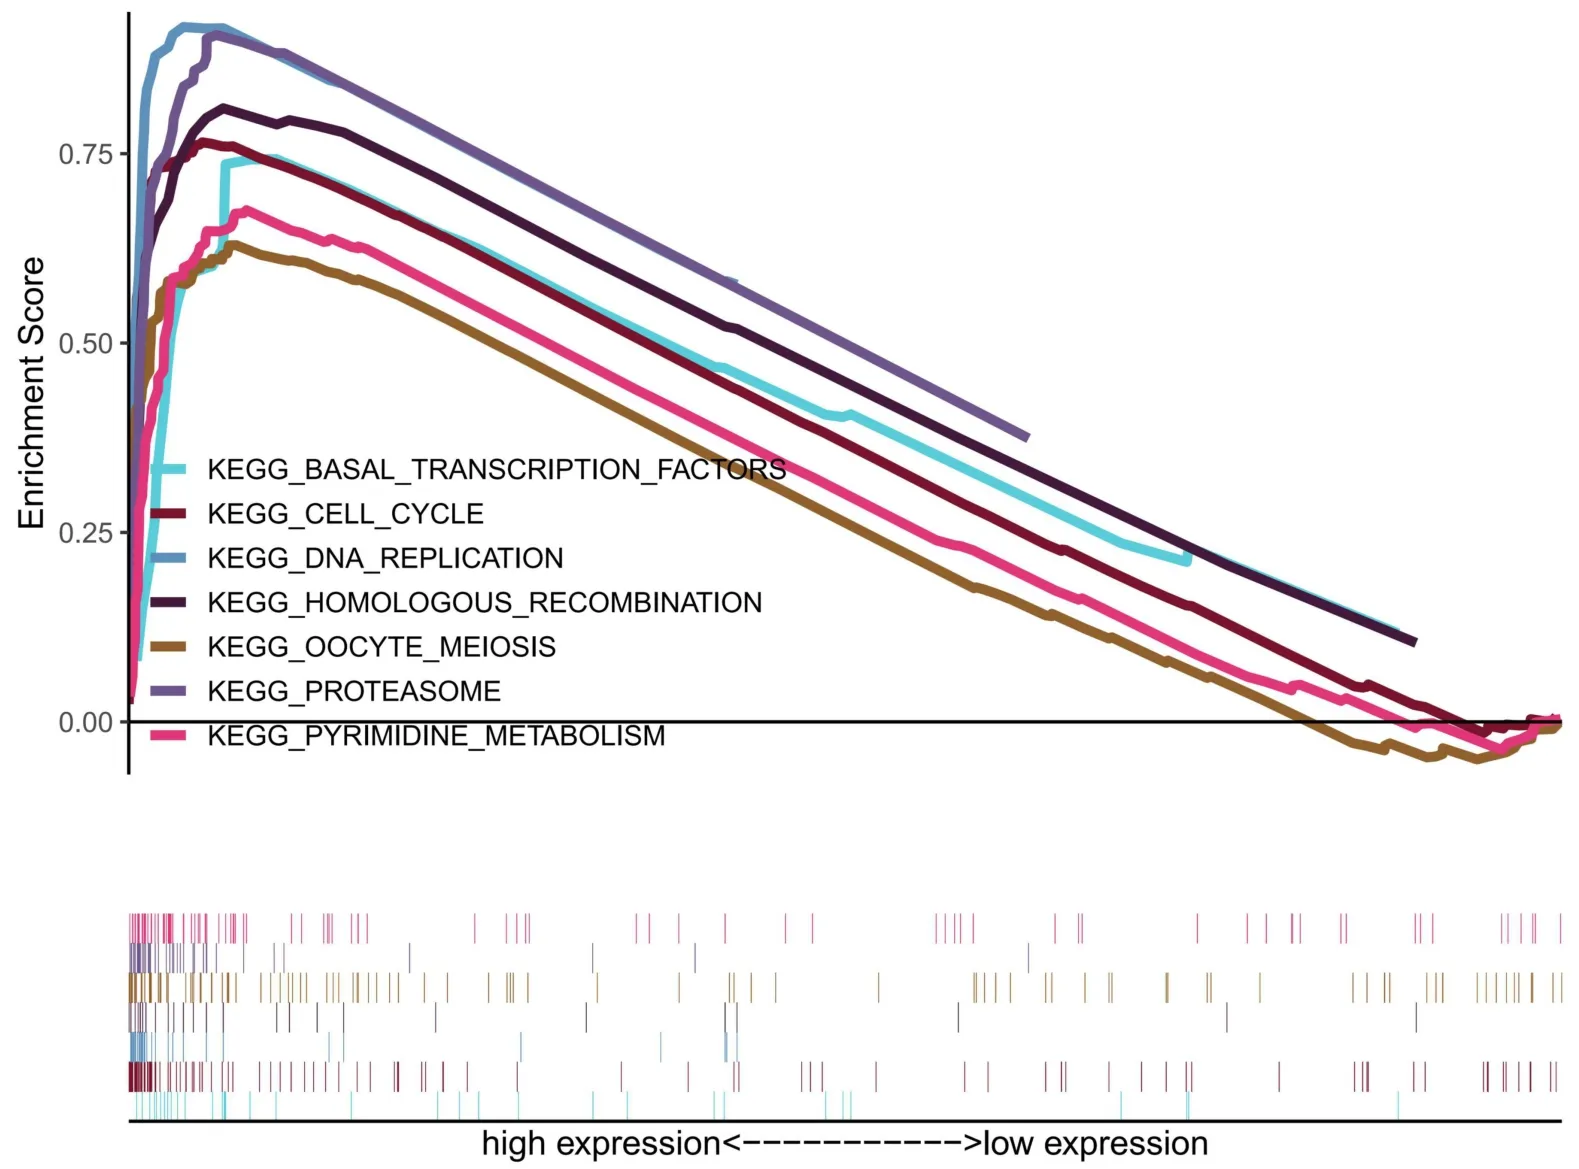
Figure 5 GSEA analysis based on TUBA1C expression.GSEA,gene set enrichment analysis;TUBA1C,tubulin Alpha 1c;KEGG,Kyoto Encyclopedia of Genes and Genomes.
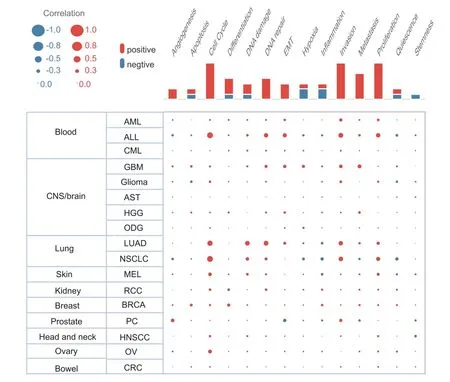
Figure 6 Pathway enrichment analysis of TUBA1C at the pan-cancer single cell level.TUBA1C,tubulin Alpha 1c.
The diagnostic and prognostic significance of TUBA1C in BC
The ROC curve was used to evaluate the diagnosis value of TUBA1C in BC.The results demonstrated that TUBA1C showed high accuracy in the diagnosis of BC area under curve=0.92),as shown in Figure 7A.Next,Cox regression results showed that the prognosis of high TUBA1C expression was poor,including OS (hazard ratio (HR)=1.47,95% confidence interval: 1.06 -2.02,P=0.019) (Figure 7B),DSS (HR=1.8,95% confidence interval: 1.16 -2.79,P=0.009)(Figure 7C).There was no statistically significant difference in progression-free survival.In addition,correlation analysis was performed between TUBA1C and prognosis (OS) in different clinical subgroups.The results showed that in most clinical subgroups,including age ≤60 (Figure 7D),pathological stages III and IV (Figure 7E),M0 (Figure 7F),luminal B subtype (Figure 7G),postmenopausal subgroup (Figure 7H),ER positive subgroup (Figure 7I),patients with high expression of TUBA1C had worse OS.For DSS,in age >60(Figure 8A),pathological stages I and II (Figure 8B),M0 (Figure 8C),N0 (Figure 8D),luminal B subtype (Figure 8E),postmenopausal(Figure 8F),T1 and T2 (Figure 8G),HER2 negative (Figure 8H) and non-radiotherapy (Figure 8I) subgroups with high expression of TUBA1C had worse DSS.
High expression of TUBA1C is an independent risk factor for the prognosis of BC
Univariate and multivariate Cox regression analysis were conducted to evaluate the prognosis predictive value of TUBA1C.As shown in Table 2,regardless of univariate and multivariate Cox regression,TUBA1C expression is an independent risk factor for OS (HR:1.568,P=0.011)and DSS (HR:1.942,P=0.008).At the same time,in the multivariate Cox regression analysis of OS,age,T,N,M and pathological stage also showed advantages in predicting clinical outcomes.In DSS,only N,M,and pathological stages showed predictive power.Then a prognostic nomogram was constructed by the statistically significant prognostic factors in the multivariate Cox regression analysis and draw a calibration curve to test the validity of the nomogram.The nomogram included age,pathological stage and TUBA1C expression to predict overall survival,and its C-index was 0.748 (0.726-0.770) (Figure 9A).Similarly,in the nomogram of DSS,the C index was 0.783(0.755-0.812) (Figure 9C).The calibration curves have ideally predicted clinical outcomes at 3,5 and 10 years (Figure 9B,Figure 9D),and the results all showed good agreement with the actual predicted value.
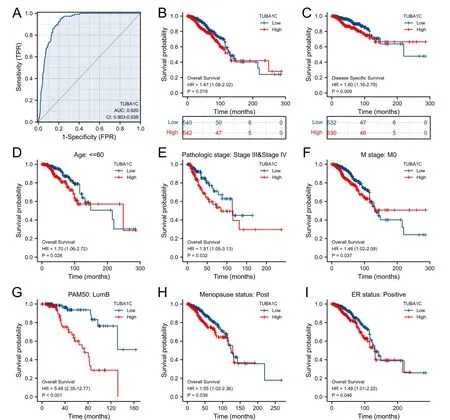
Figure 7 The diagnostic and prognostic value of TUBA1C expression in BC.(A) The ROC curve of TUBA1C;(B) the OS analysis of TUBA1C;(C)the DSS analysis of TUBA1C;(D) the survival curve of the age ≤60 groups;(E) the survival curve of pathological stages III and IV group;(F) the survival curve of M0 group;(G) the survival curve of luminal B subtype group;(H) the survival curve of postmenopausal group;(I) the survival curve of ER positive group.TPR,true positive rate;FPR,false positive rate;ER,estrogen receptor;TUBA1C,tubulin Alpha 1c;ROC,receiver operating curve;OS,overall survival;DSS,disease-specific survival;HR,hazard ratio.

Figure 8 The prognostic value of TUBA1C for DSS in each clinical subgroup of BC.(A) The survival curve of the age >60 group;(B) the survival curve of pathological stages I and II group;(C) the survival curve of M0 group;(D)the survival curve of N0 group;(E) the survival curve of luminal B subtype group;(F)the survival curve of postmenopausal group;(G)the survival curve of T1 and T2 group;(H) the survival curve of HER2 negative group;(I) the survival curve of non-radiotherapy group.TUBA1C,tubulin Alpha 1c;DSS,disease-specific survival;HR,hazard ratio;HER2,human epidermal growth factor 2;BC,breast cancer.
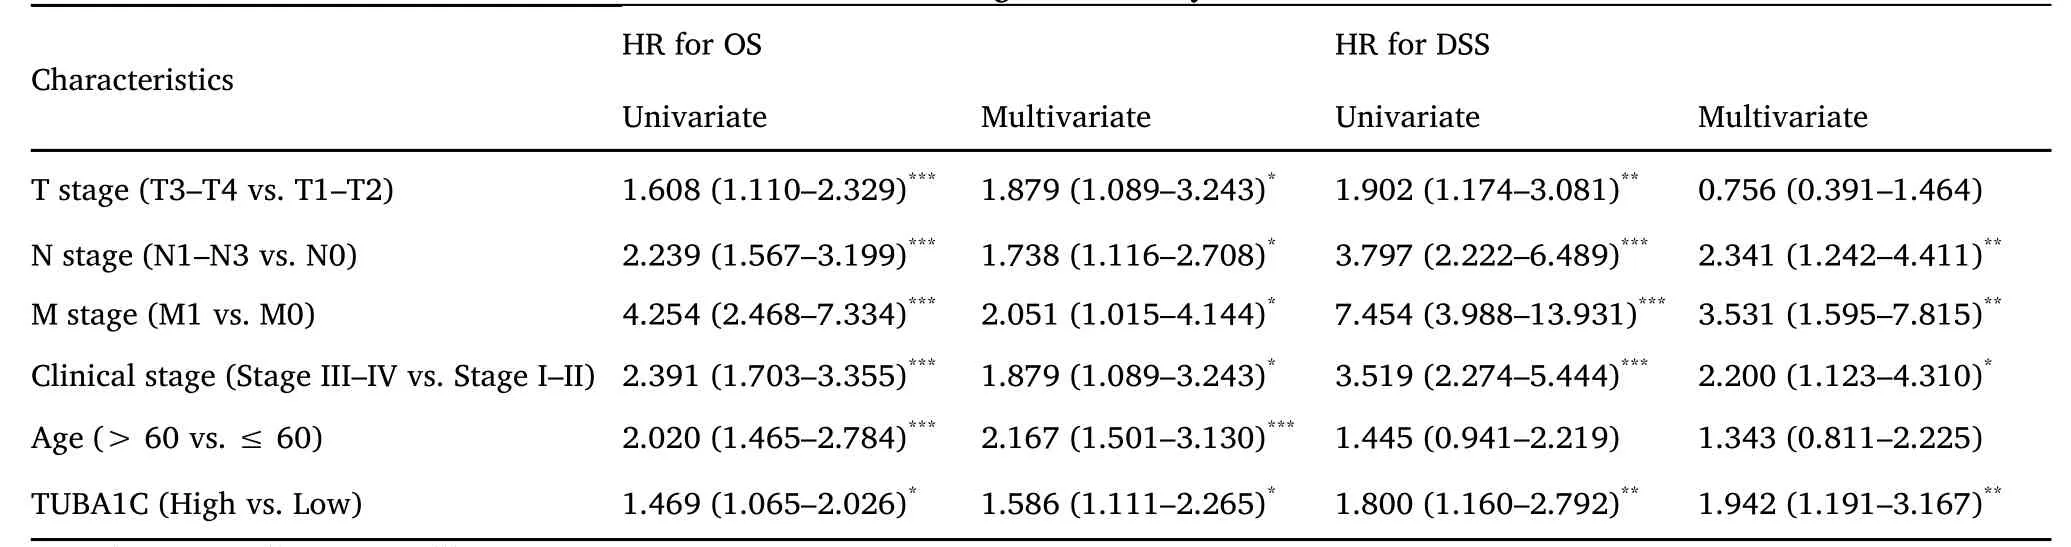
Table 2 Univariate and multivariate Cox regression analysis of TUBA1C on OS and DSS in BC.
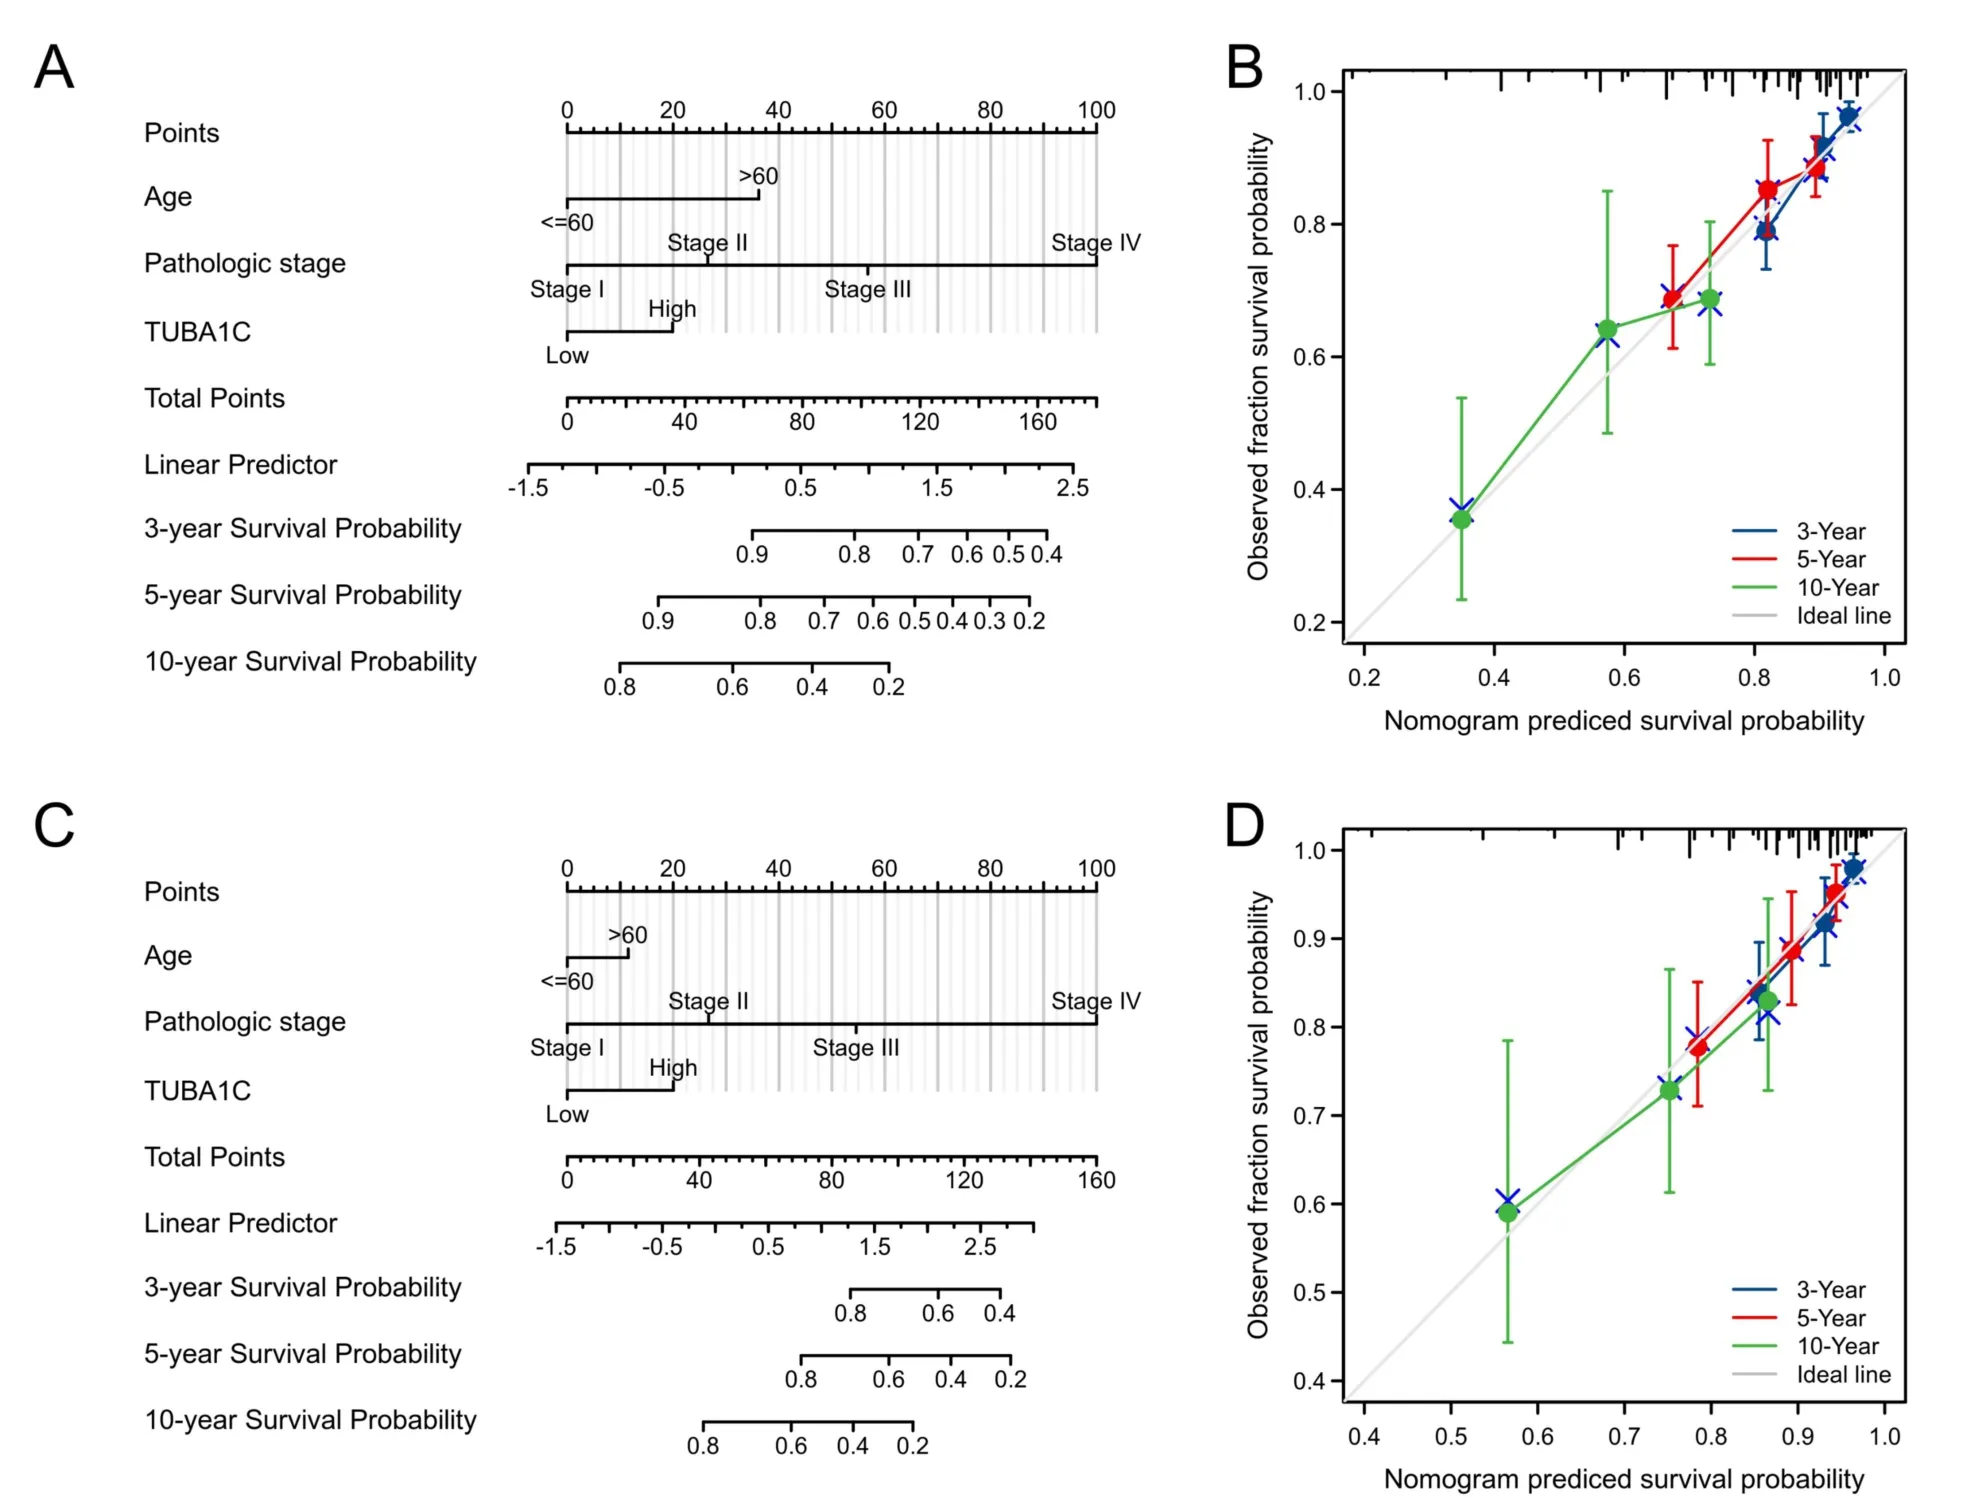
Figure 9 Prognostic nomogram and calibration curve of OS and DSS based on TUBA1C expression.(A) The OS Nomogram plot;(B) the OS calibration curves;(C) the DSS nomogram plot of OS;(D) the DSS calibration curves.TUBA1C,tubulin Alpha 1c;DSS,disease-specific survival;OS,overall survival.
The relationship between the expression of TUBA1C and immune cell infiltration in BC
Firstly,the ssGSEA method was used to determine the degree of infiltration of 24 immune cells in BC.Subsequently,the Spearman method was used to analyze the correlation between the expression of TUBA1C and the infiltration of immune cells.As shown in Figure 10,Th2 cells (R=0.613,P<0.001),aDC (R=0.326,P<0.001),Th1 cells (R=0.324,P<0.001),macrophages (R=0.285,P<0.001),NK CD56dim (R=0.224,P<0.001),neutrophils (R=0.17,P<0.001),DC (R=0.11,P<0.001) and TReg (R=0.252,P<0.001)were positively correlated with the expression of TUBA1C.However,pDC (R=-0.367,P<0.001) CD8 T cells (R=-0.136,P<0.001)and mast cells (R=-0.223,P<0.001),NK cells (R=-0.286,P<0.001) and eosinophils (R=-0.224,P<0.001) were negatively correlated with TUBA1C.
Analysis of TUBA1C expression and drug sensitivity in BC patients
The R package “pRRophetic” is used to predict the chemotherapy IC50value of each tumor sample.The results are shown in Figure 11.In TUBA1C low expression group,Doxorubicin,Cisplatin,Lapatinib,Imatinib and Gefitinib had lower IC50values (P<0.05).Thus patients with low TUBA1C expression were more sensitive to chemotherapy and targeted therapy (P<0.05).
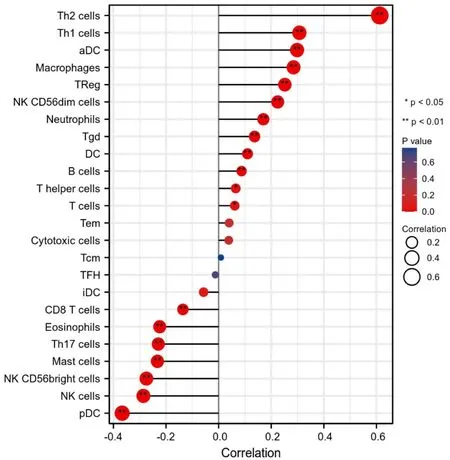
Figure 10 Correlation of immune cell infiltration and TUBA1C expression in BC patients.TUBA1C,tubulin Alpha 1c.

Figure 11 Drug sensitivity analysis of TUBA1C expression.(A) The IC50 value of Doxorubicin;(B) the IC50 value of Cisplatin;(C) the IC50 value of Lapatinib;(D) the IC50 value of Imatinib;(E) the IC50 value of Gefitinib.TUBA1C,tubulin Alpha 1c;IC50,half-maximal inhibitory concentration.
Discussion
In our study,the expression difference of TUBA1C between cancer and normal tissues was evaluated,demonstrating that it was significantly high in a variety of tumors.In BC,the highest expression level was the triple-negative BC subtype.This was confirmed in the TISIDB database.Additionally,the expression of TUBA1C had a significant correlation with age,histological type,ER,PR,HER2 and PAM50 molecular typing.Knocking down the TUBA1C gene had a significant impact on the growth of breast cancer cells,according to the Depmap database.Mutation analysis showed that the higher the mutation frequency of TP53 in patients with high TUBA1C expression and indicated that these two genes might affect each other and further research may be required for the next step.GSEA and CancerSEA single-cell database analysis showed that TUBA1C played a cancer-promoting effect in BC by influencing cell cycle,DNA replication and other pathways.The TCGA database was used to examine the ability of TUBA1C to diagnose and predict the prognosis of breast cancer.The area under the diagnostic ROC was as high as 0.92 and indicated that it had a very high diagnostic ability for BC and can predict the OS and DSS of BC patients.Further subgroup Kaplan-Meier analysis showed that it had significant prognostic predictive ability in most clinicopathological subgroups and the prognosis of patients with low expression was better and was an effective prognostic predictor.We also performed univariate and multivariate Cox regression analysis,indicating that it was an independent risk factor for BC,and the performance of the nomogram constructed based on TUBA1C and common clinical characteristics was also excellent.Then the ssGSEA method was used to determine the degree of infiltration of 24 immune cells in BC.Subsequently,the Spearman method was used to analyze the correlation between TUBA1C and immune cell infiltration.We found that Th2,aDC,Th1,macrophages,NK CD56dim,neutrophils,DC and Treg and other immunosuppressive cells were significantly positively correlated with the expression of TUBA1C.However,tumor killer cells such as pDC,CD8 T,mast cells,NK and eosinophils cells were significantly negatively correlated with the expression of TUBA1C,indicating that the high expression of TUBA1C may inhibit the immune microenvironment of BC.The drug sensitivity analysis of TUBA1C showed that patients with high expression of TUBA1C were more resistant to chemotherapy and targeted therapy,which may be one of the reasons for their poor prognosis.
The primary part of microtubules,known as TUBA1C,is crucial for cell cycle advancement and cell survival [12].TUBA1C plays a role in a variety of tumors and affects the occurrence and progression of tumors.Previous studies had shown that TUBA1C knockout significantly inhibits pancreatic cancer cell proliferation and cell cycle,reduces its migration and invasion ability and inhibits tumor growth.It was revealed that the down-regulation of TUBA1C may inhibit the migration and invasion of pancreatic cancer cells and induce cell apoptosis by regulating cell cycle signaling pathways,and was significantly related to the prognosis [7].Additionally,it was considerably up-regulated in gliomas and significantly correlated with immune cell infiltration and the immunological microenvironment[13].Knockout of TUBA1C leads to cell cycle arrest and inhibition of cell proliferation and migration,which is related to the poor prognosis of glioma patients and was a potential prognostic biomarker of glioma[14].The same result was obtained in lung cancer,which was also significantly high expression,significantly related to immune infiltration and affected the prognosis of patients by the cell cycle,p53 pathway,etc.[15].Another study discovered that TUBA1C could also act as a sponge for miR-143-3p which adversely regulated miR-143-3p and played an essential role in non-small cell lung cancer [16].TUBA1C was significantly overexpressed in liver cancer and promoted cell proliferation and metastasis of liver cancer through cell cycle signaling pathways[8].
In addition,it was also a gene in the prognostic signature of colorectal cancer and was thought to be a crucial protein involved in the metastasis and progression of osteosarcoma,making it a useful prognostic marker [17,18].Other studies have shown that TUBA1C was an important translation control protein binding protein [19].Tubulin heterogeneity regulates the function and kinetics of microtubules and plays a role in the development of cancer drug resistance,which shows that TUBA1C affects the sensitivity of chemotherapy and targeted drugs,which is consistent with our conclusions [20].Our research and the above research have reached consistent conclusions and confirm the important role of TUBA1C in BC.The next phase can concentrate on its role in triple-negative breast cancer (TNBC) and may become a new therapeutic target for TNBC because it was primarily expressed in TNBC.
There are certain restrictions even though we were able to confirm that TUBA1C is expressed in BC and that it has a significant prognostic value for clinical outcomes.On the one hand,the TCGA database is where we primarily obtain samples and clinical data.In order to confirm the accuracy of the findings,we will need to add more public database data sets in the future.In the future,research will be required to confirm the biological roles of TUBA1C at the tissue and cellular levels.As a result,a thorough investigation is required to support our findings in order to further the clinical application of TUBA1C in the evaluation of BC prognosis.
Conclusion
In conclusion,as a new prognostic marker for BC,TUBA1C was found to primarily participate in cell cycle and other proliferation pathways,where it had a carcinogenic effect.Our study concluded that TUBA1C could reliably predict the prognosis of BC patients.Additionally,the expression of TUBA1C was related to immune cell infiltration and drug sensitivity.It can be used as an effective tool for prognostic evaluation and guide individualized clinical treatment.

- Medical Data Mining的其它文章
- Necroptosis signature predicts neuroblastoma outcome
- Clinical significance of DNAH14 gene in uterine corpus endometrial carcinoma based on bioinformatics
- The role of CXCL chemokine family in the development and prognosis of colorectal cancer
- Integrated bioinformatics analysis of potential biomarkers and candidate drugs of esophageal squamous cell carcinoma
- Construction of prognostic model of cervical cancer based on necroptosis-related lncRNAs
- Analysis of low expression of ferroptosis-related gene DECR1 on poor prognosis and immune cell defects of bladder urothelial carcinoma