Research on Surface Defect Detection Technology of Wind Turbine Blade Based on UAV Image
TAN Xingguo , ZHANG Gaoming
(1. School of Electrical Engineering and Automation, Henan Polytechnic University, Jiaozuo, Henan, 454000;2. Hami Vocational and Technical College, Hami, Xinjiang, 839000)
Abstract: In the background of “double carbon,” vigorously developing new energy is particularly important.Wind power is an important clean energy source. In the field of new energy, wind power scale is also expanding.With the wind turbine, the probability of large-scale blade damage is also increasing. Because the large wind turbine blade crack detection cost is high and because of the poor working environment, this paper proposes a wind turbine blade surface defect detection method based on UAV acquisition images and digital image processing. The application of weighted averages to achieve grayscale processing, followed by median filtering to achieve image noise reduction, and an improved histogram equalization algorithm is proposed and used for the characteristics of the UAV acquisition images, which enhances the image by limiting the contrast adaptive histogram equalization algorithm to make the details at the target area and defects more clear and complete, and improves the detection efficiency. The detection of the blade surface is achieved by separating and extracting the feature information from the defects through image foreground segmentation, threshold processing, and framing by the connected domain. The validity and accuracy of the proposed method in leaf detection were verified by experiments.
Keywords: Wind Turbine Blade, UAV, Blade Damage, Image Processing, Defect Detection
1 Introduction
China’s installed wind power capacity has been the world’s first for many years[1-2]. Wind power resources are mostly concentrated in mountainous areas,offshore or Gobi, and other geographic and climatic environments that are relatively complex. Wind turbines work with more sand, more salt spray, and more disasters in the harsh environment. The blade surface is often subject to a variety of media damage to form defects damage[3]. The blade is the wind turbine’s efficient, safe, wind-catching key component. In order to enhance the power, blade length with the single machine capacity increases and increases, blade damage chances increase.
The traditional wind turbine blade condition detection and surface defects mainly use telescope observation and drop rope man detection; long downtime,low detection efficiency, high cost of detection, high risk factors[4-5]. In recent years, a variety of sensors have been used to monitor and identify wind turbine blade defects. Through the analysis of the collected signal, the location and type of defects can be determined, but additional sensors are required, the cost of the completed wind farm transformation is high, and the data also requires a lot of analysis and processing to be used for diagnosis. At present, image-based inspection techniques are also being gradually applied to blade inspection. For example, Kim[6]et al. proposed a damage detection system based on a gimbal zoom camera for fault location of wind turbine blades.Soon-kyu[7]proposed a method to detect wind turbine blade damage using thermal imaging laser technology.These methods allow non-contact inspection of blades and access to information in an intuitive way in the field, but are still some distance away from application.
The deployment of drones to inspect the defects of wind turbine blades compared with traditional inspection methods has the following advantages: (a) can reduce the risk of overhead operations and reduce the labor intensity of workers. (b) can improve the efficiency of detection, greatly reducing downtime. (c)reduces the inspection blind area while increasing accuracy. In addition, by avoiding the installation of a variety of sensors on the blade operation, the cost of testing is reduced.
This paper explores the application of UAV in wind turbine blade inspection and aims to investigate a non-destructive detection method for wind turbine blade surface defects based on computer vision. UAV(Unmanned Aerial Vehicle) is used to capture images,enhance and filter image details, build wind turbine blade surface damage recognition algorithm, and then accurately achieve the detection of typical blade surface defects.
2 Blade Image Acquisition and Fault Defect Analysis
Cause wind turbine blade failure or defects of many factors: remote location of long-distance transport may produce scratches; harsh environment,easy to suffer from wind and rain and snow erosion lead to blade damage; high frequency of alternating load will also cause blade fatigue damage. After the blade long-term detection results were found, blade defects were mainly manifested as surface coating shedding, trachoma, crack, edge corrosion, crease,lightning strike, etc., to crack, crease, breakage, and trachoma.
Blade damage is also one of the highest repair costs of damage types; blades account for about 20% to 30% of the total cost of the wind turbine. Fig.1 shows the blade with several common defects.
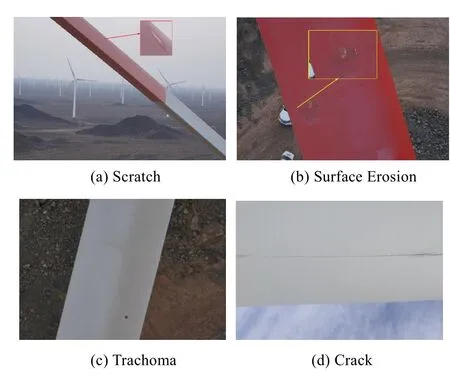
Fig.1 Common Defects of the Blade Diagram
Considering the increasing size of wind turbines and working in high wind speed, high temperature, and harsh environments, UAVs need to meet certain conditions: such as having certain wind resistance, long flight time, carrying camera resolution with high resolution and camera resolution of at least 10 megapixels to meet the acquisition requirements[8-9], in this paper blade defect images are obtained based on DJI Jingwei M300 RTK UAV acquisition[10-11].
UAV wind turbine blade inspection process, in addition to the wind direction, wind speed, and light on the impact of the UAV image, the factors affecting the UAV data acquisition also include: UAV high altitude flight generated by the body shake and the relative motion between the blade and affect the quality of the captured image; in addition to the noise generated by the harsh environment of the wind farm, the noise generated by various electronic devices and the noise generated by a short stay in the imaging is difficult to avoid;need to design the blade defect detection algorithm for the image characteristics of the UAV inspection.
3 Blade Defect Detection Algorithm Design
For the image data collected by the UAV, this paper proposes to apply multiple image processing algorithms to detect wind turbine blade faults. The process and algorithms of each stage are shown in Fig.2.
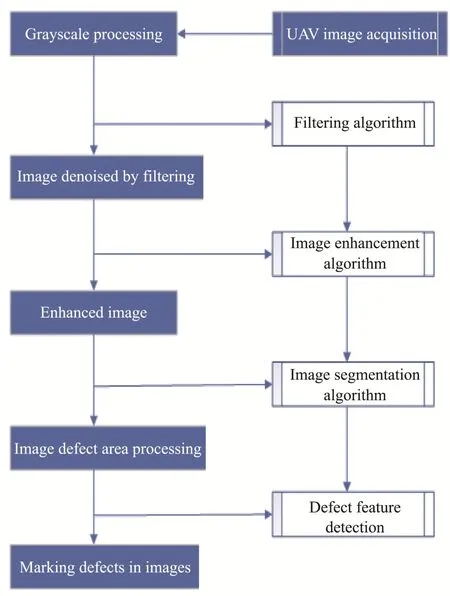
Fig.2 Image Processing Flow Chart
Firstly, the acquired color image is processed in gray scale, and the median filtering method is applied for noise reduction and deblurring for the mixed noise such as pretzel noise and Gaussian noise generated on the image; Subsequently, the restricted contrast adaptive histogram equalization algorithm is proposed for image detail enhancement; Finally, image defective region segmentation should be performed to highlight and mark the defective regions in the image.
3.1 Image Grayscale Processing
The RGB format color raw images captured by UAV are large in data volume, long in processing time and low in efficiency for direct use [13]. In contrast, the three color components R, G, and B in the grayscale image take equal values, and the grayscale values vary in the range of 0 to 255, containing only brightness information but not color information. For blade defect detection, compared with color images, grayscale images are more advantageous. Based on the human eye’s habit of color perception, this paper uses the weighted average method to grayscale the original image first.The weighted average method is a grayscale method that assigns different weights to the three RGB components for weighted average calculation [14], and its calculation formula is as follows.

In the formula: F(i, j) is expressed as the grayscale value at (i, j) in the grayscale map, and A1, A2, andA3are the weighting coefficients.
Because the human eye is most sensitive to green,followed by red, and the least sensitive to blue, making A2> A1> A3will give a grayscale image that is easier to recognize. Using the weighted average method, not only can the three RGB color components be weighted and averaged, but they can also adjust the weighting factor to key the image in different situations to get a better grayscale image. Fig.3 shows the results of grayscale processing of unmanned images when A1=0.299, A2= 0.587, and A3= 0.114 using the weighted average method.

Fig.3 Grayscale Processing Result Graph
3.2 Image Noise Reduction Processing
When the image captured by the drone generates a lot of noise because of many factors[15], irregular patterns such as speckles and lines will appear in the image to affect the picture quality. After the noise analysis,the noise above the image is mainly speckles, Gaussian pretzels, and other mixed noise. For these noises, this paper proposes adaptive median filtering to solve the image quality problems brought on by noise.
The adaptive median filtering algorithm not only filters out noise but also better preserves image details,which conventional filtering algorithms cannot do. The adaptive median filter requires a rectangular windowSxy, the size of which is changed during the filtering process. The filter outputs a pixel value that is used to replace the pixel value at the point (x,y), which is the center of the filter window. The basic principle of adaptive median filtering is: “W” is defined as the center at (x,y), the median filter window areaSxycan be adjusted and initialized to Sini, the preset maximum area window size isSmax,Zxyindicates the gray value at the point (x,y),Zmin, andZmaxis the minimum gray value in the window areaSxy.ZminandZmaxare the minimum gray value and maximum gray value, respectively, andZmedis the median of the gray value inSxy. The basic idea of the algorithm is to automatically adjust the size of the window template according to the statistical characteristics of the pixel intensity differences in the vicinity of the window to obtain a better balance between noise suppression and detail protection and to improve the traditional performance ranking of the statistical algorithm.
The adaptive median filtering algorithm is divided into the following two processing phases, which are phases A and B.
Phase A:A1=Zmed-Zmin
A2=Zmed-Zmax;
IfA1> 0 andA2< 0, proceed to phase B;
otherwise, increase the window size;
If the increased window size≤Smax,
then repeat phase A; Otherwise, outputZmed.
Phase B:B1=Zxy-Zmin
B2=Zxy-Zmin;
IfB1> 0 andB2< 0, outputZxy;
Otherwise, outputZmed.
As shown in Table 1, the above algorithm is used for noise reduction and compared with conventional Gaussian filtering and bilateral filtering to obtain the following results.
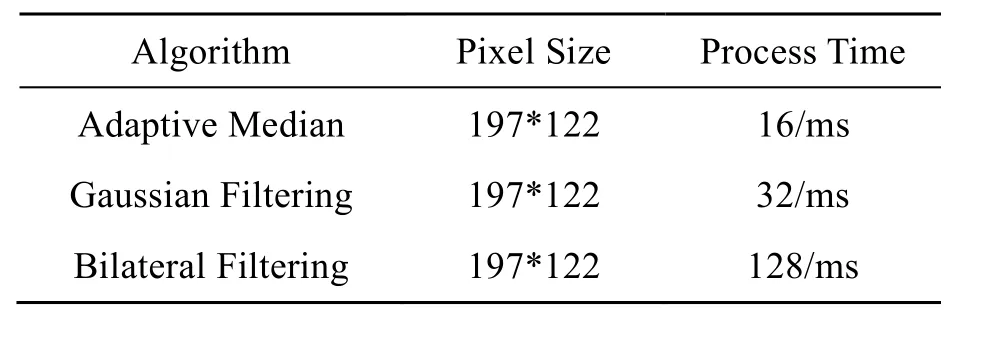
Table 1 Algorithm Operation Speed Comparison
From the above table, we can see that adaptive median filtering can reduce the algorithm running time and improve the processing speed to meet the requirements of this paper.
3.3 Image Enhancement System
Wind turbines work in a harsh environment, and the blade surface is prone to accumulate oil, water, and stains; the image quality is affected by weather and lighting factors in the process of image acquisition by UAV. In this paper, we introduce an image enhancement algorithm that can maintain image details and enhance color balance, to achieve the purpose of improving the visual effect of images. The method is based on the HIS color model Restricted Contrast Adaptive Histogram Equalization algorithm to achieve image enhancement.
Histogram Equalization (HE) is a global picture improvement algorithm that works in the spatial domain like a point operation. Its key concepts are to convert an image’s histogram distribution into a nearly uniform distribution, to accomplish nonlinear stretching of the image, to redistribute image pixel values, and to improve image contrast. HE, on the other hand, is a global image enhancement technique that ignores the local image region. Although this method improves contrast, noise in the dark zone may be enhanced and evident after the equalization process, while fine detail in the bright region would be lost.
To address the above problems, this paper proposes an improved histogram equalization algorithm---Contrast Limited Adaptive Histogram Equalization (CLAHE). The adaptive process is to calculate the histogram distribution within the local area window to construct the mapping function f() during the equalization process, redistribute the luminance to change the image. Introduce the contrast limit to set the threshold value of the histogram distribution, as shown in Fig.5, the part exceeding the threshold value is“uniformly”. This limits the increase of the transform function (cumulative histogram) by setting the threshold of the histogram distribution, as shown in Fig.4,and limits the noise amplification and local contrast enhancement by limiting the height of the local histogram.
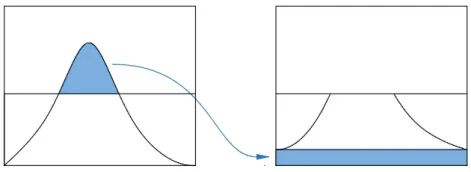
Fig.4 Uniform Distribution of Threshold Values

Fig.5 Principle Diagram of CLAHE Algorithm
The improved CLAHE algorithm is implemented as follows:
Slice the image for chunking, as shown in Fig.6,evenly into 5x5 rectangular blocks of the same size,with the black squares denoted as sub-blocks of each rectangular block.
Compute the histogram, the cumulative distribution function and the corresponding transformation for each block.
The pixels in the red area at the corner are mapped directly using the transform function of the sub-block; the pixels in the green area at the boundary are mapped using the transform function of two adjacent sub-blocks and then linearly interpolated; the pixels in the blue area are bilinearly interpolated using the transform function of the surrounding four sub-blocks. The pixels in the blue area are obtained by bilinear interpolation with four surrounding sub-blocks.
In Fig.6, it can be clearly seen that the enhanced image is sharper than the original image, the crack details are more prominent and the overall image quality has been enhanced. From the two grayscale distributions, it can be seen that the highest pixel in the original image is 25000 after the algorithm processing,the highest pixel is reduced to 12000, and the rest of the pixels are evenly distributed into the image, further verifying the effectiveness of the algorithm.
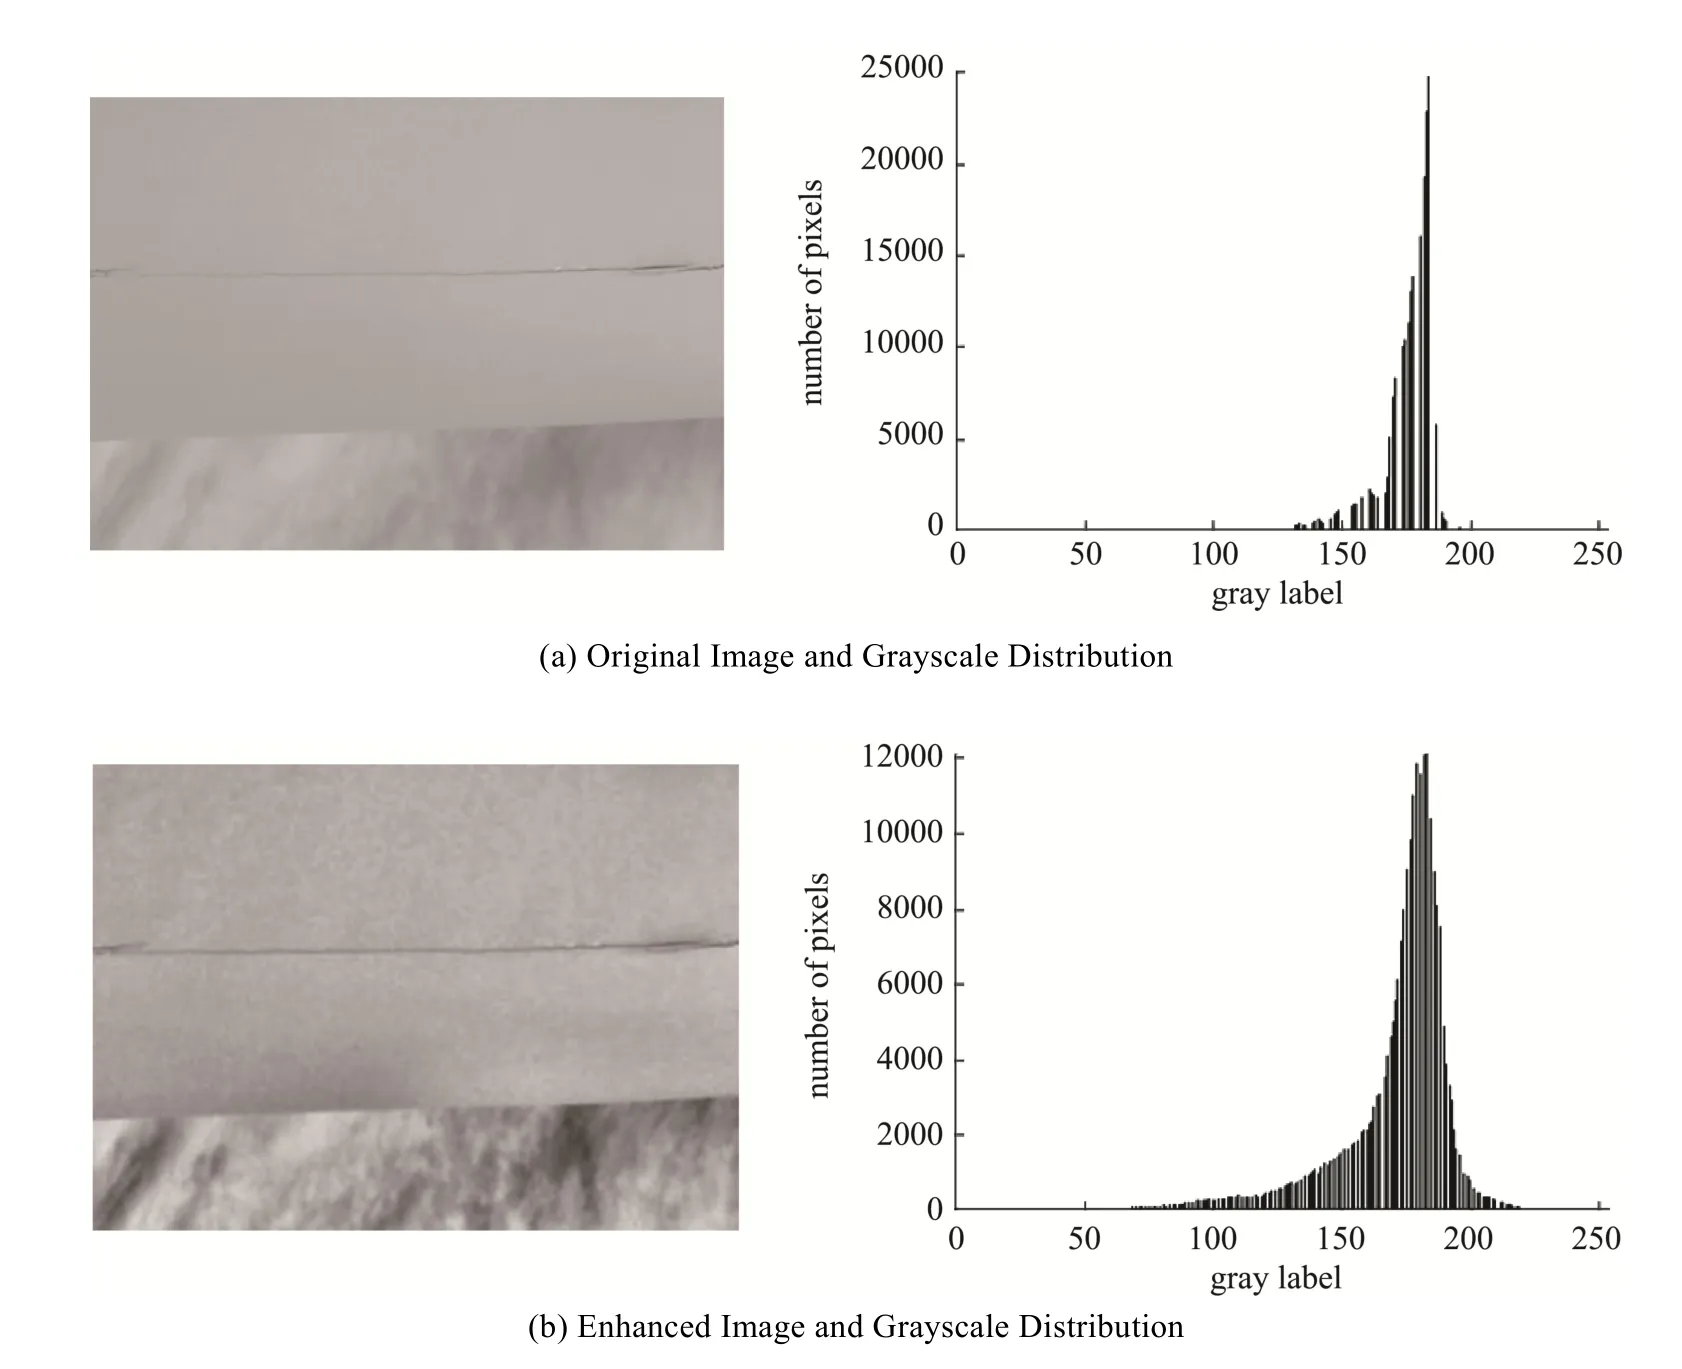
Fig.6 Image Enhancement Rendering Diagram
3.4 Blade Defect Area Detection
The noise reduction and image enhancement processes improve the image clarity and highlight the details to make the defects more visible. In order to enable the detection and extraction of various types of defective features, the next step is to analyze and process the regions where defects exist [16]. To process the defect area, the Laplace Gaussian operator is used to detect the edges of the defect area of the blade, and then the shape selection operator is used to detect the edges of the image with cracks and trachoma as the standard form, and then the closure operator is used to merge the interconnected areas and close the edge contour of the defect to obtain the complete defect area.
This section uses the method of custom threshold method and iterative threshold method for the segmentation of the image defect area, using this method can effectively retain the geometric characteristics of the blade defect area, better reflect the relationship between the whole and local image, to achieve the segmentation defect target. The image segmentation algorithm implementation steps:
(i) Select an initial threshold G, G = (Gmin+Gmax)/2, where Gminis the minimum gray value of the defective image and Gmaxis the maximum gray value of the defective image.
(ii) The given image is segmented into two sets of images according to the threshold G, denoted as R1and R2; R1consists of all pixels with gray values greater than G and R2consists of all pixels with gray values less than or equal to G.
(iii) Calculate the R1and R2mean values μ1and μ2;calculate the new threshold G1, and G1= (μ1+μ2)/2;
(iv) If G1no longer changes, then G1is the threshold value; otherwise, go to step (2) and recalculate until the difference of G in successive iterations is less than the predetermined value. The algorithm flow is shown in Fig.7.
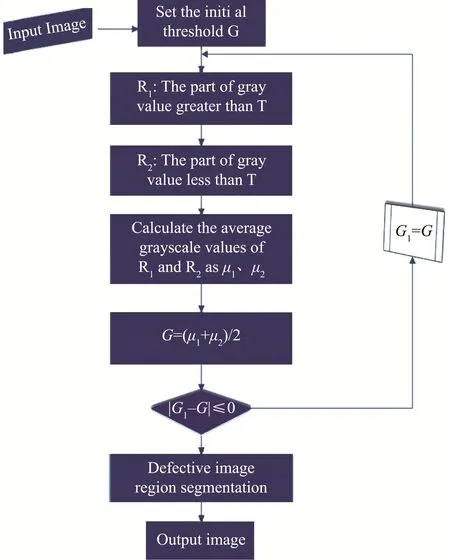
Fig.7 Image Segmentation Algorithm Flowchart
For the defect detection of the image, it is necessary to measure the scale and distinguish the categories of defect features such as trachoma and crack first. Here the shape selection operator is used to select the image defect area by a specific value. This study uses the number of pixels as the selection feature. Here the trachoma defect is defined as 20–200 pixels, the scratch as 200–4000 pixels, and the crack defect as 300–5000 pixels. The final detection result is shown in Fig.8.

Fig.8 Final Test Results
4 Analysis of Experimental Results
To verify the effectiveness of the algorithm proposed in this paper, 60 defect images containing trachoma, cracks, and scratches were selected from the blade images collected by the UAV as the samples for this experiment. The detection results of the defective areas of the blade after the processing of the algorithm in this paper are shown in Table 2.

Table 2 Blade Defect Detection Results
As can be seen from Table 2, the detection accuracy of this paper is lower for trachoma-type defects and higher for crack defects because cracks and other defects have larger area characteristics than trachoma-type defects. But the paper overall still achieves a good detection effect, can accurately detect the typical blade surface defects, and can meet the field inspection requirements.
5 Conclusion
This paper proposes a method to detect and extract surface defects of wind turbine blades based on the characteristics of images collected by UAVs on wind turbine blades and addresses the current problems of low accuracy and low efficiency in blade defect detection.
(1) Denoising the mixed noise on the UAV acquisition images using an adaptive filtering algorithm.
(2) Proposed the Contrast-Limited Adaptive Histogram Equalization algorithm (CLAHE), which can effectively improve the image quality while limiting the image contrast, with better results than traditional image enhancement methods.
(3) A combination of custom thresholding method and iterative thresholding method is proposed to deal with the image defect problem and achieve image defect region segmentation.
After experimental testing, the algorithm proposed in this paper can achieve the detection of defects such as blade gelcoat shedding, cracks, scratches, and trachoma with an accuracy rate of more than 90%,which can play a good role in the detection and later operation and maintenance of wind turbine blades.
- Instrumentation的其它文章
- Design of a Logistics Automated Guided Vehicle
- Iris Segmentation Based on Matting
- Research on Hand-eye Calibration Technology of Visual Service Robot Grasping Based on ROS
- Target Path Tracking Method of Intelligent Vehicle Based on Competitive Cooperative Game
- Time Symmetry Analysis of Nonlinear Parity Based on S-P Compensation Network Structure
- Non-destructive Testing Method for Crack Based on Diamond Nitrogen-vacancy Color Center

