
Comprehensive evaluation of microRNA as a biomarker for the diagnosis of hepatocellular carcinoma
2022-08-12 08:10JulianeMalikMartinKlammerVinzentRolnyHenryLikYuenChanTeerhaPiratvisuthTawesak
World Journal of Gastroenterology 2022年29期
Juliane Malik,Martin Klammer, Vinzent Rolny, Henry Lik-Yuen Chan,Teerha Piratvisuth,Tawesak
Tanwandee, Satawat Thongsawat,Wattana Sukeepaisarnjaroen, Juan Ignacio Esteban, Marta Bes, BrunoKohler,Magdalena Swiatek-de Lange
Abstract
Key Words: Carcinoma; Hepatocellular; MicroRNAs; Biomarkers; Alpha-fetoprotein; Protein induced by vitamin K absence-II; Diagnosis
lNTRODUCTlON
According to the World Health Organization report of cancer cases worldwide, hepatocellular carcinoma (HCC) was the sixth most common cancer in terms of new cases and the fourth most common cause of cancer-related deaths in 2018[1]. HCC accounts for 85%-90% of all primary liver cancers[2], and in most cases develops in cirrhotic livers. Cirrhosis arises as a consequence of chronic liver injury and inflammation caused by viral and non-viral factors. About 70% of all HCC cases are caused by viral liver infections like hepatitis B virus (HBV) and hepatitis C virus (HCV)[3]. Approximately 80% of HCC cases occur in eastern Asia and sub-Saharan Africa, where the dominant risk factor is chronic infection with HBV and exposure to aflatoxin B1. In contrast, the main risk factors for HCC development in North America, Europe and Japan are infection with HCV or alcohol misuse, diabetes and obesity[4]. The mortality rate of HCC is high, with 5-year overall survival rates of 19.5%[5].
Limited treatment options exist for patients with HCC when diagnosed at advanced stages, so early detection is crucial to reduce mortality. If diagnosed early, treatment options such as resection, local ablation and liver transplantation are available and increase the 5-year overall survival rate for very early HCC [Barcelona-Clinic Liver Cancer (BCLC) stage 0] to 70%-90% and for early HCC (BCLC stage A) to 50%-70%. Intermediate to end-stage HCCs are unresectable and have a median survival of 16 mo for intermediate HCC (BCLC stage B), 6 mo for advanced HCC (BCLC stage C) and 3-4 mo for end-stage HCC (BCLC stage D)[6].
HCC is often asymptomatic, making its early diagnosis challenging. Major international guidelines recommend surveillance of high-risk patients [patients with severe chronic liver disease (CLD) such as chronic HBV or HCV infections, alcohol abuse or non-alcoholic steatohepatitis, leading to cirrhosis of the liver) at 6-mo intervals using abdominal ultrasound (US) with (The Asian Pacific Association for the Study of the Liver, American Association for the Study of Liver Diseases) or without (European Association for the Study of the Liver-European Organisation for Research and Treatment of Cancer)measurement of alpha-fetoprotein (AFP) levels in serum[7-9]. Japanese guidelines on HCC management propose the use of US and measurement of AFP, lectin-reactive AFP and protein induced by vitamin K absence/antagonist-II (PIVKA-II; also known as des-gamma-carboxy prothrombin) for routine followup in patients at high risk for developing HCC[10]. Other recommended imaging methods are computed tomography (CT) and magnetic resonance imaging; however, these are very cost-intensive, not easily accessible and have potential adverse effects like radiation exposure (CT)[6-8,11]. US use is also not without problems, as its performance is operator-dependent[12] and is limited in the setting of nonalcoholic steatohepatitis[13]. Adjunctive use of AFP may improve HCC detection rates. Although it has limited sensitivity for early-stage HCC, its addition to US improved sensitivity from 45% to 63% (P=0.002)[11,14]. PIVKA-II is more sensitive but less specific than AFP for diagnosis of HCC in patients affected by chronic HCV infection[15]. Thus, there is a great need for new, non-invasive diagnostic tools to improve the detection of early HCC and eliminate operator-dependent variability.
MicroRNAs (miRNAs) are small (approximately 22 nucleotides), non-coding RNA molecules that post-transcriptionally modify gene regulation by base-pairing to mRNA[16]. The target mRNA is then either degraded (complementary or near-perfect complementary binding) or the translation is inhibited(partial complementarity), thus inhibiting protein expression[17].
In the cancer research field, the role of miRNAs has been discussed extensively. In the context of human cancers, miRNAs are associated with cell proliferation, genomic instability, tissue invasion,metastasis, angiogenesis, evasion of apoptosis and immune response. They can also act as oncogenes or tumor suppressor genes[18]. Clinical applications of miRNAs have been studied in various malignant tumors, such as lung, breast and prostate cancers[19]. Primarily, miRNAs from serum and plasma are of particular interest for diagnosis of cancer and the study of disease prognosis. The main advantage of miRNA-based diagnosis is the high stability of these molecules in blood and other biological fluids that can be easily sampled[20-22].
In HCC, the role of miRNAs for diagnosis and therapy has been exhaustively analyzed, although with contradictory results[23]. The expression of several miRNAs in different HCC tumor tissue samples was both elevated and decreased compared with a control group (non-tumorous tissue) in different studies[24]. Additionally, numerous circulating miRNA candidates or signatures composed of several miRNAs have been published as biomarker candidates for HCC (e.g., hsa-miR-206, hsa-miR-141-3p and hsa-miR-433-3p)[25]. In some cases, both increases and decreases in the expression of the same miRNA (e.g., hsa-miR-143, hsa-miR-155, hsa-miR-195) have been reported[26]. While previous studies have given some indication that miRNAs may be useful biomarkers for HCC, no miRNA has been found as a reliable biomarker in the diagnosis of early-stage HCC. To date, studied cohorts have been small, or control cohorts contained only one group of patients with a disease having a high risk for HCC[27], only healthy individuals[28] or did not include patients with early HCC[29]. A large cohort is necessary to obtain statistically significant results[30], and an HCC biomarker should show high sensitivity and specificity in patients at risk for HCC (including those with HBV, HCV and cirrhosis).
The aim of this study was to identify and clinically validate potential miRNAs for the early detection of HCC in human plasma samples through a comprehensive, prospective, multicenter, case-control study. To this end, a large cohort including 660 HCC (early and late stage) and CLD patients was studied. The potential improvement of the diagnostic performance of already established protein biomarkers for HCC (AFP and PIVKA-II) in combination with miRNA biomarkers was also assessed.
MATERlALS AND METHODS
Patient sample collection
Between 2014 and 2016, EDTA-plasma samples from 354 CLD controls, including HBV and HCV with and without cirrhosis, and 306 HCC (early and late stage) patients were provided by the following institutions: Maharaj Nakorn Chiang Mai Hospital, Chiang Mai, Thailand; Siriraj Hospital, Bangkok,Thailand; Songklanagarind Hospital, Hat Yai, Thailand; Srinagarind Hospital, Khon Kaen, Thailand;Prince of Wales Hospital, Shatin, Hong Kong; NCT University Hospital Heidelberg, Heidelberg,Germany; and Vall d’Hebron University Hospital, Barcelona, Spain. Full inclusion and exclusion criteria have been previously described[31].
Written informed consent was obtained from all participants. The study was conducted in full conformance with the principles of the Declaration of Helsinki and with approval of independent ethics committees. Plasma samples were collected before treatment (surgery, percutaneous ethanol injection,chemotherapy, radiotherapy) according to the appropriate standard operating procedures and stored at-70 °C until analysis. Repeated freeze-thaw cycles were avoided. HCC diagnosis was verified using imaging (ultrasonography, CT, magnetic resonance imaging) or biopsy, followed by histopathological analysis.
Description and clinical data of patients
The demographic and clinical characteristics of the study participants are presented in Supplementary Table 1. All diagnosed HCC cases were classified according to BCLC guidelines upon sample collection. Early-stage HCC was defined as BCLC 0 and A and late-stage HCC as BCLC B, C and D.CLD controls were individuals with HBV or HCV with or without cirrhosis. Some patients had additional underlying diseases, which were not considered when distributing them into the four groups. All clinical data, including the patients’ diagnoses, were blinded to laboratory operators to avoid measurement bias.
Study design
CLD and HCC patient samples were randomly distributed into four panels: a screening panel for realtime quantitative (RT-q) PCR (n= 60), a screening panel for next-generation sequencing (NGS) (n= 100),a training panel (n= 200) and a validation panel (n= 300) (Supplementary Table 1). Comparisons were made for: (1) All HCC (early + late stages)vscontrols (HBV and HCV, with and without cirrhosis); (2)Early HCCvscontrols; and (3) Early HCCvscirrhosis (Figure 1).
miRNA isolation
The following methods for miRNA isolation from plasma were validated: TaqMan miRNA ABC Purification Kit, mirVana PARIS Kit (both LifeTechnologies, Carlsbad, CA, United States) and the miRCURY RNA Isolation Kit-Biofluids (Exiqon, Vedbaek, Denmark). The best performance for the isolation of small RNA was found using the last method; therefore, all isolation experiments were performed using the miRCURY RNA Isolation Kit-Biofluids. The starting material was 250 μL of EDTAplasma per patient. Handling was according to the manufacturer’s protocol with the following adaption: after adding the protein precipitation solution and subsequent centrifugation, only 200 μL of supernatant was transferred into a new tube; the remaining volume was discarded. For quality control,spike-ins UniSp2, UniSp4 and UniSp5 from the miRCURY Universal RT microRNA PCR, RNA Spike-in kit (Exiqon) were added to all samples prior to isolation. Isolated small RNA (including miRNA) was stored at -80 °C until analysis.
NGS
NGS of miRNAs from EDTA-plasma samples was performed by Exiqon. Briefly, RNA was isolated following quality control by RT-qPCR. Next, the miRNA library was prepared, followed by quality controlviaRT-qPCR and bioanalyzer. Finally, miRNAs were sequenced on a Nextseq500 (Illumina, San Diego, CA, United States) with 10 million reads per sample and 50 nucleotide single-end read. The annotation reference used was miRBase 20 (http://mirbase.org/). In the following data analyses, the reads were mapped and classified based on their sequence as: (1) Known miRNA; (2) Predicted(putative) miRNA; (3) Outmapped; (4) Unmapped; (5) Genome; and (6) Small RNA. In the NGS report from Exiqon, putative miRNAs were described as miRNAs predicted from the sequences that do not map to any organism found in miRBase or to other known RNA sequences. miRPara was used to analyze the potential folding of these sequences[32]. These results were combined to identify putative novel miRNAs. The differential expression analyses were done using the trimmed mean ofM-value normalization method in the EdgeR statistical software package.
Putative miRNA primer design
For the evaluation of the putative miRNA (put-miRs), the following RT-qPCR primers were designed using the Exiqon tool for primer design: put-miR-25, put-miR-46, put-miR-56, put-miR-66, put-miR-79,put-miR-99, put-miR-83, put-miR-86, put-miR-91, put-miR-100, put-miR-118 and put-miR-128. Three primer sets for each put-miR were tested in the three EDTA-plasma samples that had shown the highest expression for the respective put-miR in NGS. The put-miRs that showed a cycle threshold (Ct) lower than 35 were selected for clinical validation. The primer set with the lowest Ct of all three primer sets was used for the following RT-qPCR analyses. Details on the put-miRs and their corresponding chromosome location, chromosome strand, start and stop position, sequence and primer design-IDs from Exiqon can be found in the Supplementary materials (Supplementary Table 2).
Reverse transcription and RT-qPCR
Reverse transcription and RT-qPCR were carried out using the Universal complementary DNA synthesis kit II for reverse transcription and the ExiLENT SYBR Green master mix kit for RT-qPCR(Exiqon) according to the manufacturer’s protocol. For quality control, spike-ins UniSp6 and cel-miR-39-3p from the miRCURY LNA Universal RT microRNA PCR, RNA Spike-in kit were added to all samples prior to reverse transcription. RT-qPCR analysis was performed for: (1) Individual miRNA primer sets;(2) Commercially available predefined ready-to-use panels: Human miRNome panel I and II, V4 which included primers for 752 known miRNAs; and (3) Customized ready-to-use panels [all primer sets and panels from miRCURY LNA Universal RT microRNA PCR Biofluids (Exiqon)]. RT-qPCR was performed on a LightCycler®480 (Roche Diagnostics International Ltd, Rotkreuz, Switzerland). The following modifications to the manufacturer’s protocol were made: (1) In both customized and predefined ready-to-use panels the amount of complementary DNA was doubled; and (2) After adding the PCR mastermix-complementary DNA mix to each well and centrifuging the plate, the reagents in the plate were mixed on a shaker for 20 s and then centrifuged again.
Normalization and miRNA expression

Serum protein assays measurements
AFP and PIVKA-II were measured using microchip capillary electrophoresis and a liquid-phase binding assay on the uTASWako i30 automated analyzer (Fujifilm Wako Pure Chemical Industries, Osaka,Japan).
Biostatistical analyses
The statistical methods and analyses of this study were performed and reviewed by biostatisticians Dr.Martin Klammer and Vinzent Rolny of Roche Diagnostics GmbH.
Univariate analysis
For each miRNA, two-sample Wilcoxon rank-sum testing was performed, and thePvalue was reported.Subsequently, thePvalues were corrected by means of Benjamini-Hochberg false discovery rate correction to account for multiple hypothesis testing (referred to as ‘Q-values’ in the tables).
In the initial global discovery of differentially expressed miRNAs, the rawPvalues (without false discovery rate correction) were used. Here, a higher false-positive rate was deliberately accepted for the sake of minimizing the risk of missing a potential biomarker candidate (i.e., minimizing the falsenegative rate).
Multivariate analysis
To discover the optimal bivariate biomarker combination and reliably estimate its performance in future samples, a two-tier cross-validation workflow employing logistic regression was established. In the first(outer) tier with 200 Monte-Carlo cross-validation runs, the data set was randomly split into training and test set (80% and 20%, respectively) in each run, while maintaining the ratio of cases and controls.The optimal feature combination was then searched for in the second (inner) tier with five-fold crossvalidation, where the training data were again split into an inner training and an inner test set. All possible two-marker combinations (exhaustive search) were then assessed by training a logistic regression model on the inner training data containing only information of the respective two markers(inner selected training data) and testing their performances by means of area under the curve (AUC) of the receiver operating characteristics curve with the respective inner test set (inner selected test data).The combination showing the best inner cross-validation results (i.e., maximum mean AUC across the five cross-validation runs) was then selected and used to train a model in the outer tier. As with the inner tier, logistic regression was used, and the performance of the test set (selected test data) for each of the 200 Monte-Carlo cross-validation runs was then assessed; the mean AUC represented the estimated overall performance.
Since the feature selection procedure was part of the outer cross-validation tier, it was possible that different marker pairs were selected in the 200 Monte-Carlo cross-validation runs. However, it was necessary to select the one pair that would be used to train a model to predict future samples. This was achieved by subjecting the entire data set to the inner cross-validation tier (not only the training data, as was done for the performance evaluation) and receiving the final biomarker pair, which was subsequently used to train the final logistic regression model on the entire data set (Figure 2).
In the case of searching for a miRNA that best complements the protein marker (AFP or PIVKA-II),the protein marker itself was fixed as first feature in the feature selection process, and the optimal partner was determined as described above.
RESULTS
Analysis of differentially expressed miRNAs yielded 26 potential biomarker candidates
To find a suitable biomarker for the (early) diagnosis of HCC, a large number of miRNAs were screened, using two independent methods: RT-qPCR (752 predefined miRNAs) and NGS (resulting in 244 miRNAs). We analyzed whether miRNAs were differentially expressed between a group with (early stage) HCC and a control group with CLD (including patients with hepatitis B, hepatitis C and cirrhosis). The miRNAs identified in the screening were then analyzed as potential biomarkers for(early) diagnosis of HCC in an independent training panel using RT-qPCR and validated in an independent panel.
Global miRNome analysis of miRNAs by NGS and human miRNA panels
Compared with RT-qPCR, NGS can identify all known and unknown miRNAs. First, miRNA was isolated from the plasma of 60 patients from the CLD control group (HBV, HCV and cirrhosis; see Supplementary Table 1) and 40 patients from the HCC groups (early and late stages), followed by a quality controlviaRT-qPCR. Six control samples did not pass the quality control and were excluded from NGS. Illumina Nextseq500 sequencing of the prepared library produced an average of 10.9 million accepted reads per sample. After data analysis, two additional outlier control samples were identified and excluded from further analysis. The miRNA expression was compared for the following groups: all HCCvsCLD and early HCCvsCLD, for known and unknown miRNAs, respectively (Supplementary Table 3). The 13 miRNAs with the smallestPvalue, highest AUC and largest fold change(approximately 1.2 or higher) were selected for validationviaRT-qPCR (Table 1).
In the second discovery approach, RT-qPCR panels of preassigned assays for 752 known human miRNAs were applied for the screening of miRNA expression. miRNAs were investigated in the independent sample panel (n= 60, see Supplementary Table 1). After global mean normalization, the miRNA expression was compared between the following groups: (1) All HCCvsCLD; and (2) Early HCCvsCLD (Supplementary Table 4). The 16 miRNAs with the smallestPvalue, highest AUC and largest fold change were selected for further analysisviaRT-qPCR (Table 1). The AUCs and fold changes for the comparison of early HCCvsCLD were generally higher than the AUCs and fold changes when comparing all HCCvsCLD. Twenty-six miRNAs with the highest AUCs and fold changes, resulting from both discovery methods, were selected for further evaluation. Three miRNAs,
hsa-miR-320a (miR-320a), hsa-miR-421 (miR-421) and hsa-miR-21-5p (miR-21-5p), were identified by both independent methods (Supplementary Table 3).

Table 1 Overview of the 26 selected known and putative microRNA candidates from next-generation sequencing and real-time quantitative PCR
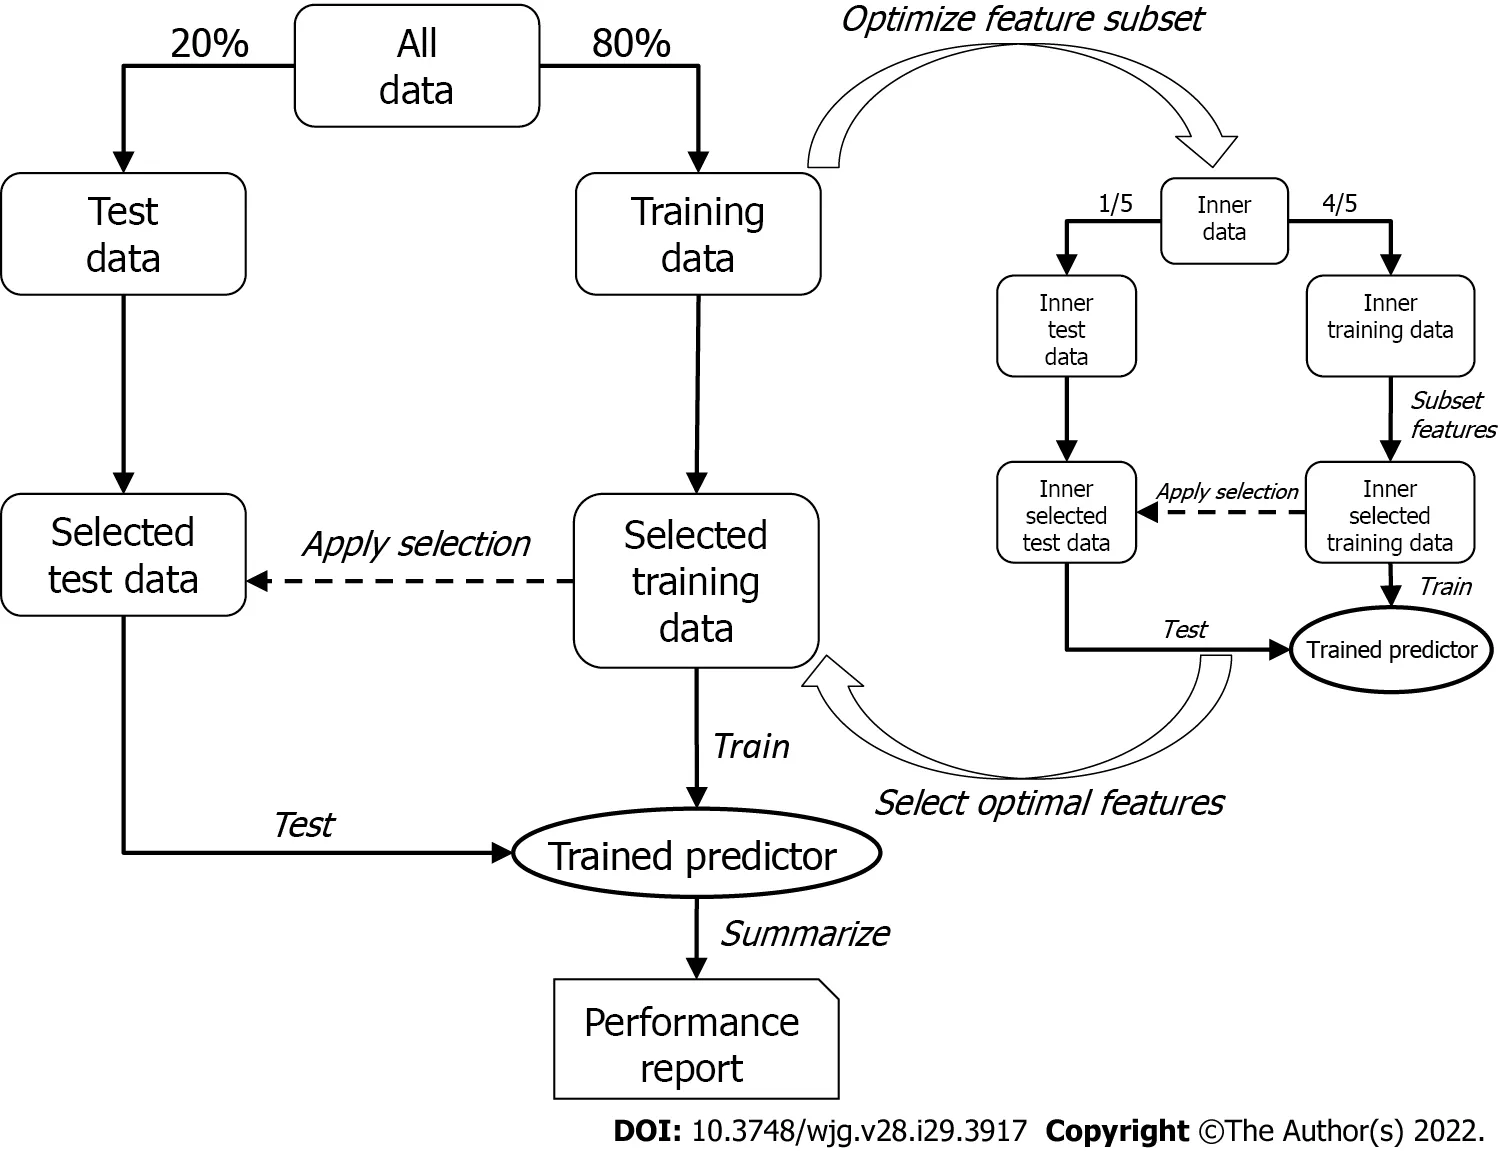
Figure 2 Overview of the two-tier cross-validation workflow employing logistic regression.
Selection of five endogenous control miRNAs for normalization
The 26 selected miRNAs were then analyzed by RT-qPCR in an independent sample panel. As the number of examined miRNAs was very small, the normalization could not be based on the global mean value, which was used for the screening. To select endogenous miRNAs that could be used for normalization, GenEx software (MultiD) was used. Five miRNAs with the lowest SD and SDacc, hsa-let-7i-5p,hsa-miR-222-3p, hsa-miR-23a-3p, hsa-miR-30e-5p and hsa-miR-191-5p, were selected as endogenous controls for normalization (Table 2).
Putative miRNA primer selection
During NGS, sequences that could be potential miRNAs based on their length and structure were identified (= put-miR; Supplementary Table 2). Some showed different expression between the all/early-stage HCC and CLD groups. The 15 potential miRNAs with the smallestPvalues, highest AUCs and largest fold changes detected in the NGS were validated by RT-qPCR in an independent sample panel. For all 15 put-miRs identified, the three plasma samples with the highest expression of the respective put-miR in the NGS were selected, and RNA was isolated with the miRCURY isolation kit and subject to RT-qPCR analysis. In the RT-qPCR, two put-miRs (put-miR-6 and put-miR-99) reached Cts below the cut-off of 35, and their best primer pairs showed a mean Ct of 33.54 (put-miR-6) and 34.17(put-miR-99). The remaining 13 put-miRs showed no expression. Put-miR-6 and put-miR-99 were further analyzed in the training and validation cohorts (Table 1).
RT-qPCR analysis of training cohort: univariate analysis
The 26 (24 known and 2 putative) miRNAs showing the best diagnostic performance and expression fold change in the NGS and RT-qPCR analysis (Table 1) were further validated by RT-qPCR in two independent sample panels: training cohort (200 samples) and validation cohort (300 samples). From the 24 previously selected known miRNAs, only three candidates (miR-21-5p, miR-320a and miR-186-5p)revealed themselves as potential biomarkers through both NGS and RT-qPCR analysis. miRNAs were analyzed alone (univariate) and as a combination of several miRNAs (signature, multivariate). miRNAs were also combined with known protein markers PIVKA-II and AFP (multivariate).
The training cohort consisted of the following plasma samples: HCC group (48 early stage and 52 late stage) and control group (100 HCV and HBV patients with and without cirrhosis). When comparing all HCCvsCLD controls in a univariate analysis, three miRNAs, namely miR-21-5p, hsa-miR-320d (miR-320d) and hsa-miR-423-5p (miR-423), could significantly distinguish (Q< 0.05) between those two groups (Table 3, Supplementary Figure 1).
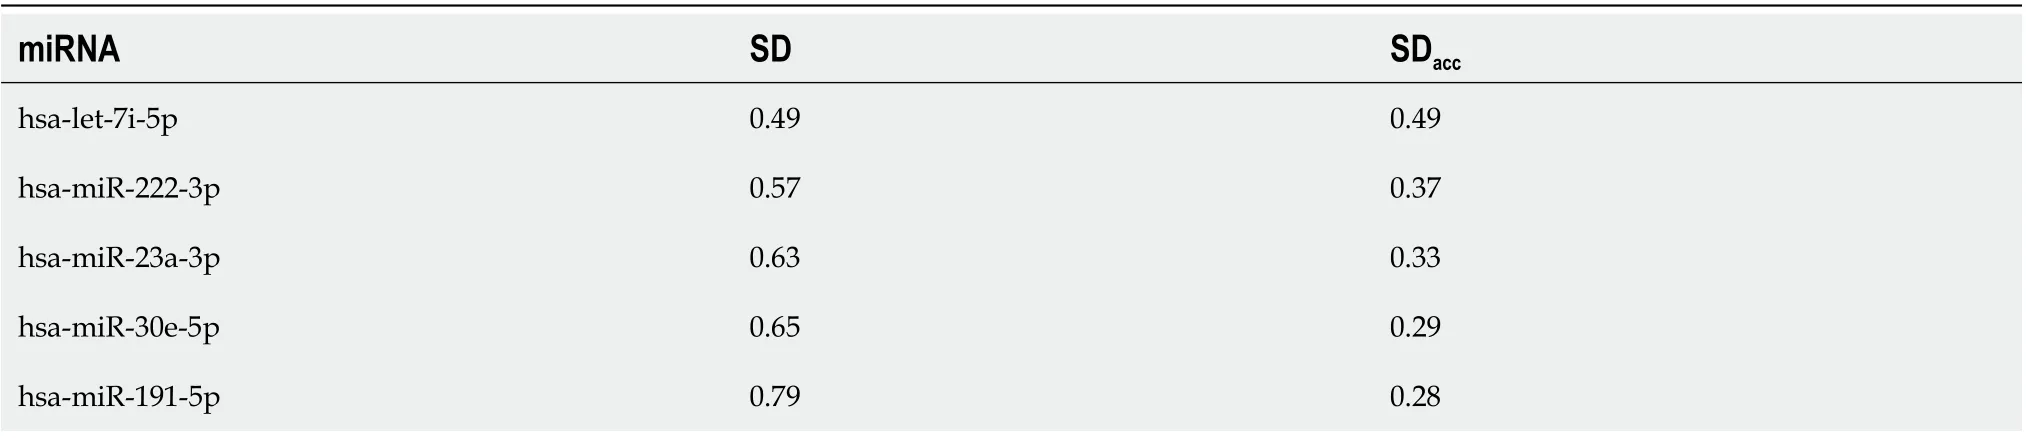
Table 2 lndividual standard deviation and accumulated standard deviation for consecutive microRNA reference genes
For the comparison of early HCCvsCLD, none of the 26 miRNAs could significantly distinguish between early HCC and the control group. After a refined analysis of the control groups, hsa-miR-652-3p (miR-652) demonstrated itself to be a marker significantly distinguishing early HCC from the cirrhosis group (mixed HBV and HCV) (Table 3, Supplementary Figure 1).
RT-qPCR analysis of training cohort: multivariate analysis and combination with protein biomarkers
A combination of several miRNAs did not perform better than the single miRNAs (data not shown).MiRNA marker candidates from the univariate analysis of all HCCvsCLD were then combined with the protein marker PIVKA-II, which is a widely used marker for HCC[33]. As a result, two-tier crossvalidation workflow (see Methods for details) was established, which employed logistic regression and combined two features (PIVKA-II and one of the 26 miRNAs) repeatedly to investigate the potential improvement of the diagnostic performance of PIVKA-II alone. The combined approach resulted in a higher AUC and specificity at 90% sensitivity than PIVKA-II or miR-21-5p alone (Table 4,Supplementary Figure 2A). miR-21-5p was selected as the best PIVKA-II partner in 86% of the crossvalidation runs (Table 5), and PIVKA-II + miR-21-5p was selected as the final biomarker pair.
In the next step, the specificity of the combined approach was tested for early HCCvsCLD. The three best partners for PIVKA-II were miR-21-5p in 60%, miR-320d in 18% and miR-652 in 16% of the crossvalidation runs (Table 5, Supplementary Figure 2B), and PIVKA-II + miR-21-5p was selected as the final biomarker pair.
For the differentiation between early HCC and cirrhotic control patients, the AUC and specificity at 90% sensitivity of the combination PIVKA-II with miRNAs was higher than for single markers (Table 4,Supplementary Figure 2C). The two best miRNA partners for PIVKA-II were miR-652 in 64% and hsamiR-221 in 26% of the cross-validation runs (Table 5), and PIVKA-II + miR-652 was selected as the final biomarker pair.
The multivariate analyses of the miRNA marker candidates combined with protein marker AFP did not show any improvement in diagnostic performance (Supplementary Figure 3).
RT-qPCR analysis of validation cohort: univariate analysis
The validation cohort consisted of the following plasma samples: all HCC group (71 early stage and 79 late stage) and CLD control group [63 cirrhosis (HBV, HCV), 59 HBV and 28 HCV). When comparing all HCCvsCLD, miR-21-5p and miR-423 were confirmed as possible biomarker candidates for the diagnosis of HCC. The performance of miR-21-5p was slightly worse in the validation cohort compared with the training cohort; miR-423 performance remained almost unchanged. The results from the training cohort for miR-320d could not be confirmed (Table 6, Supplementary Figure 4).
For the comparison of early HCCvsCLD with cirrhosis, miR-652 could not be confirmed as a possible biomarker, as seen in the training cohort (Table 6, Supplementary Figure 4).
RT-qPCR analysis of validation cohort: multivariate analysis and combination with protein biomarkers
As no combination of miRNAs could be identified in the training analysis, only PIVKA-II + miRNA combinations were validated here. However, the performance of PIVKA-II as a single marker could not be improved through combination with miRNAs selected in the training cohort for all data sets(Figure 3).
No confirmation of put-miRs as potential biomarkers for HCC
Put-miRs (put-miR-6 and put-miR-99) were tested in the training and validation panels. Put-miR-6 could only be detected in 2 samples, with a Ct of 31.24 in 1 of 200 samples in the training panel and a Ct of 34.00 in 1 of 300 samples in the validation panel. Put-miR-99 Cts between 34.00 and 34.97 (mean valueCt = 34.41) could be detected in 3 of 200 samples in the training panel and Cts between 33.85 and 34.89(mean Ct = 34.42) in 5 of 300 samples in the validation panel. All other samples showed no put-miR-6 and put-miR-99 expression, thus both put-miRs were excluded from further analysis.

Table 3 Univariate analysis of real-time quantitative PCR results for comparison

Table 4 Multivariate analysis of real-time quantitative PCR results for comparison
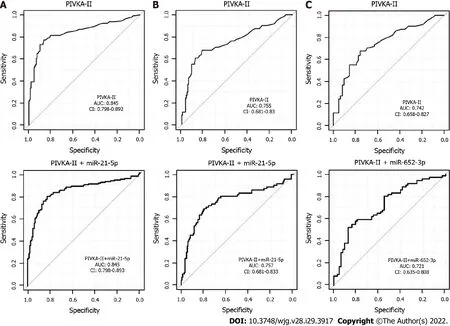
Figure 3 Receiver operating characteristics curves and area under the curve for multivariate analysis of real-time quantitative PCR results. A: Comparison of all hepatocellular carcinoma vs chronic liver disease; B: Early hepatocellular carcinoma vs chronic liver disease; C: Early hepatocellular carcinoma vs cirrhosis. Analyses were for the validation cohort. Upper panel: Protein induced by vitamin K absence/antagonist-II alone; Lower panel: Protein induced by vitamin K absence/antagonist-II in combination with the best miRNA (selected as final pair in the training analysis). AUC: Area under the curve; CI: Confidence interval; CLD: Chronic liver disease; HCC: Hepatocellular carcinoma; miR: MicroRNA; PIVKA-II: Protein induced by vitamin K absence/antagonist-II.
DlSCUSSlON
HCC is a severe disease of the liver and one of the leading causes of cancer-related deaths worldwide[5]. As with all other cancers, early detection is crucial for successful treatment. Recommended detection methods include US, CT, magnetic resonance imaging and measurement of AFP and PIVKA-II.However, these methods are either cost-intensive, operator-dependent or not suitable for the detection of early HCC[6-8,11-13,15]. Previous publications show that single miRNAs, like miR-21, hsa-miR-26a and hsa-miR-101[34,35], as well as miRNA signatures (e.g., hsa-miR-3677, miR-421, hsa-miR-326, hsamiR-424 and hsa-miR-511-2)[36,37] can improve detection of HCC. While these results are promising,the studies were conducted in small cohorts and/or the control group included healthy individuals who were not being screened regularly for HCC.
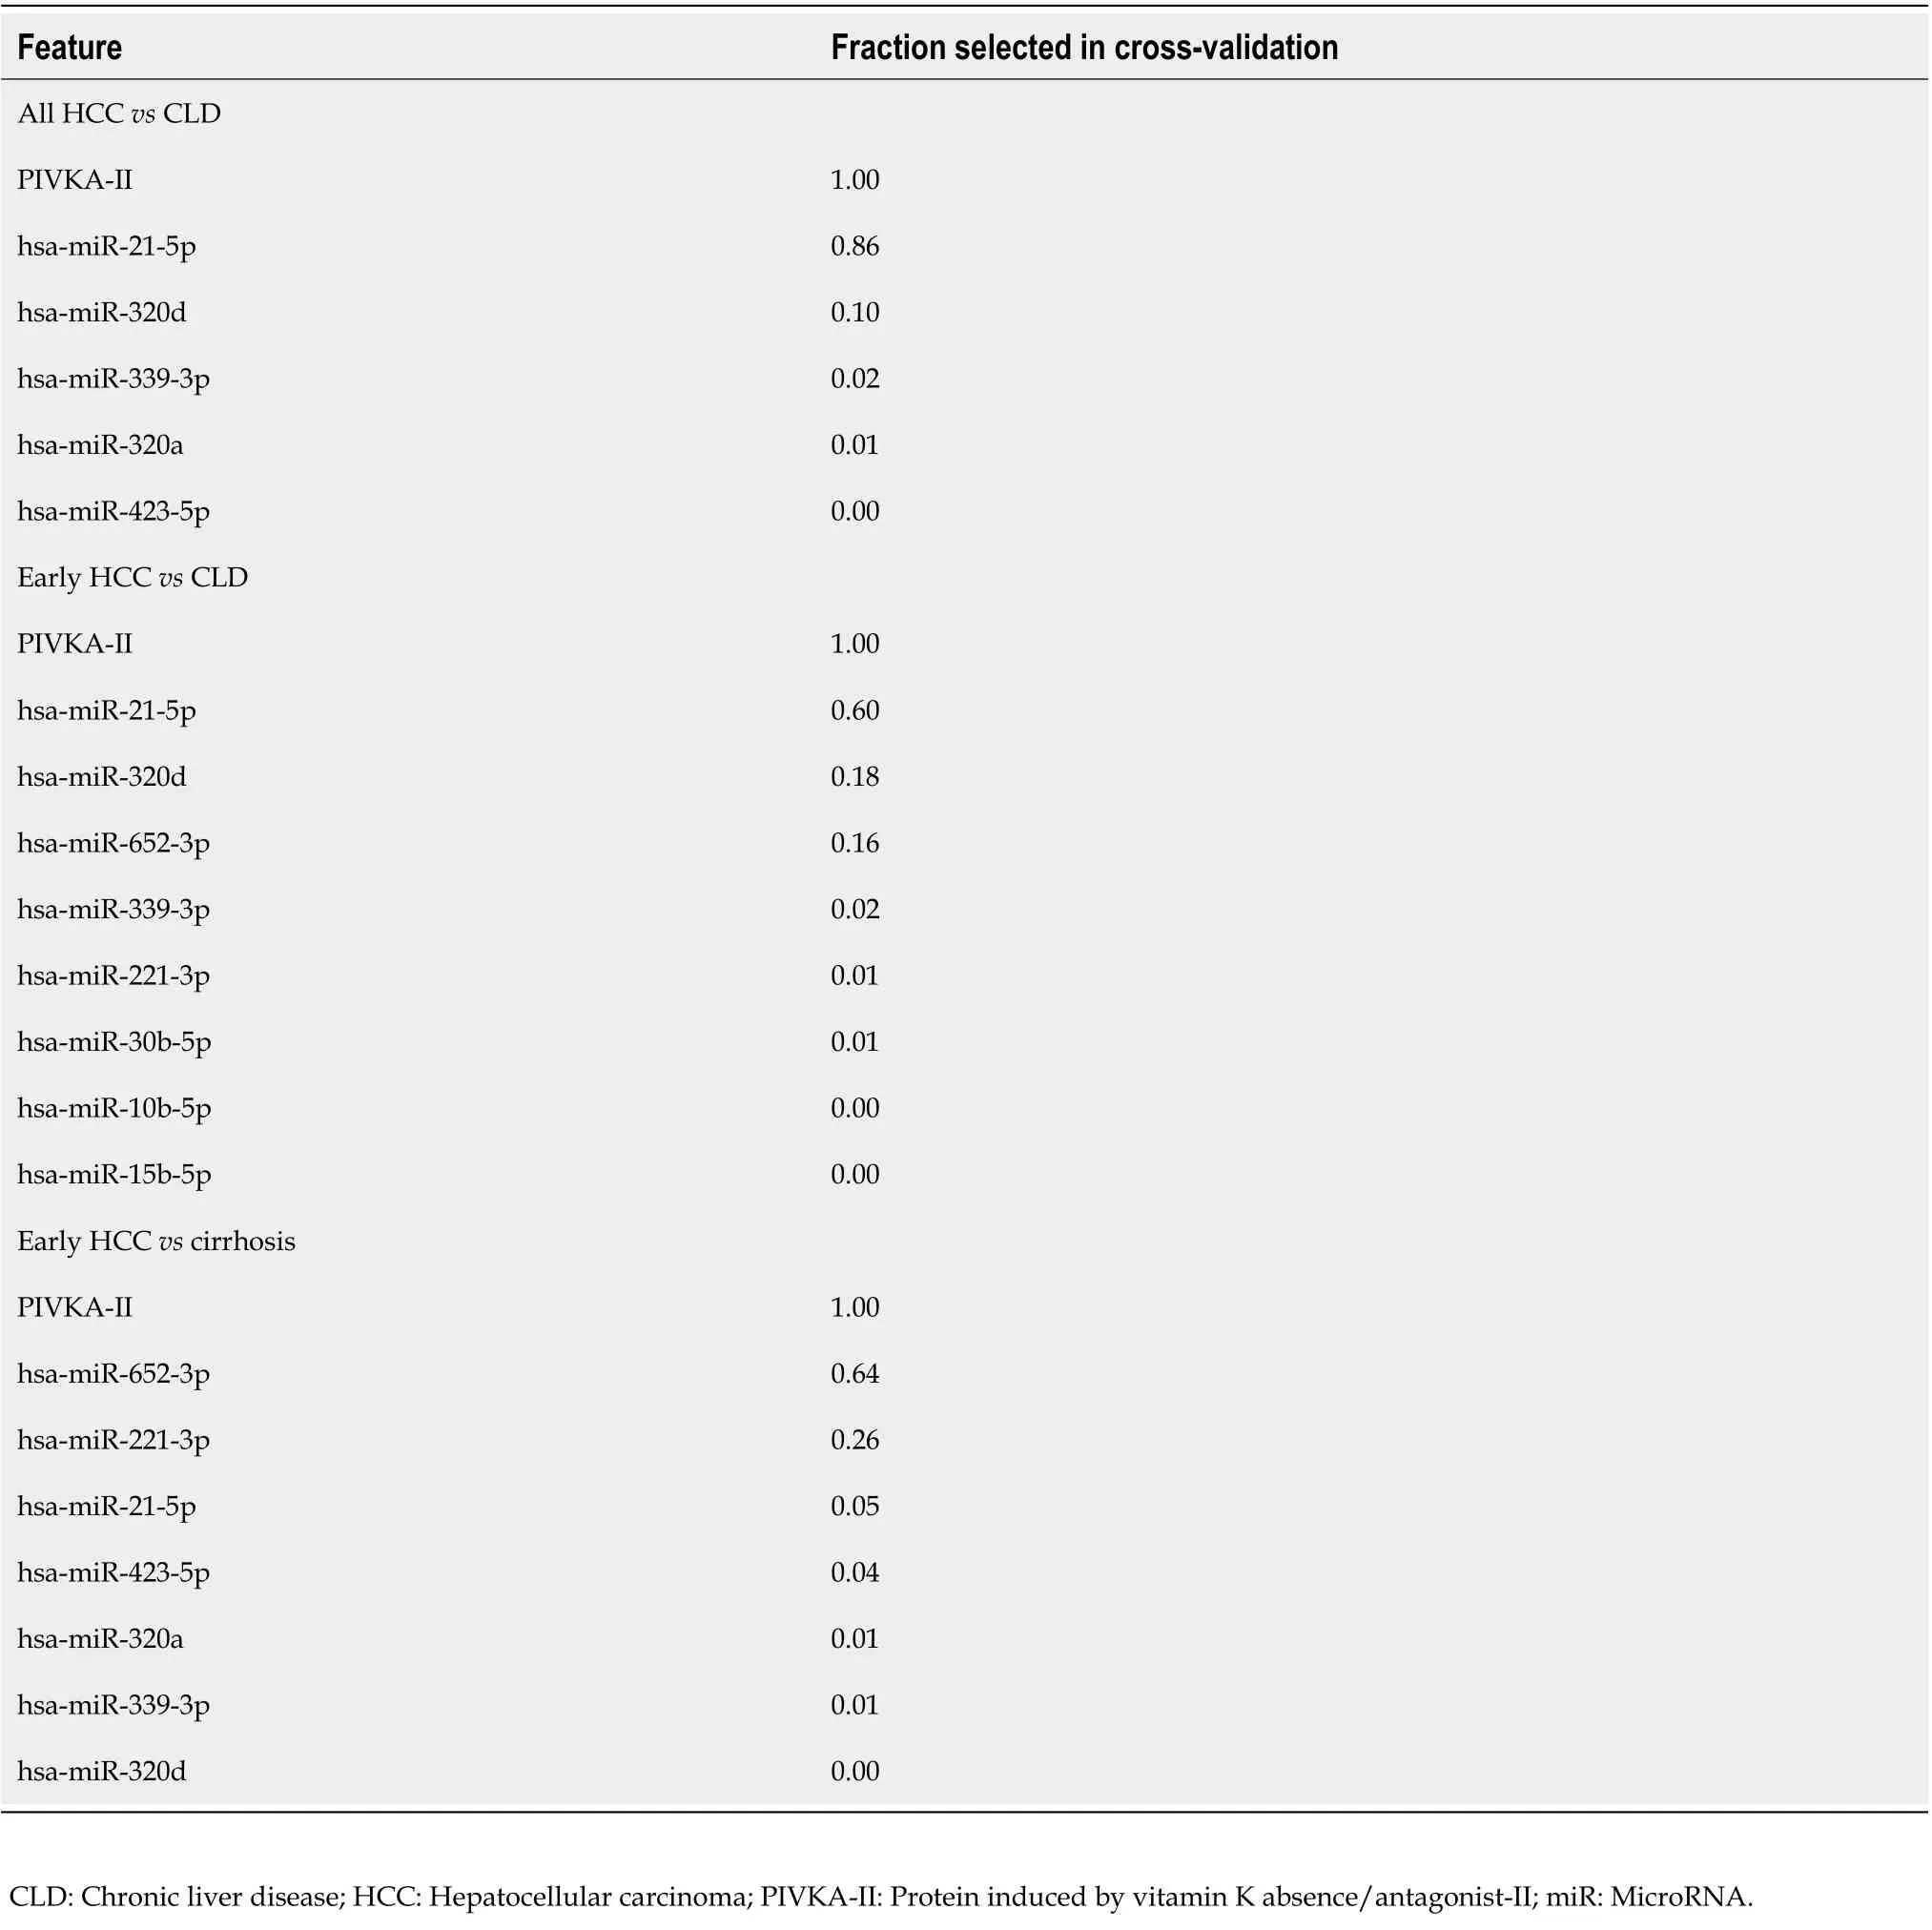
Table 5 Fractions of characteristics (feature) selected during internal cross-validation for evaluating the two-marker combination performance
Therefore, we carried out a comprehensive, prospective, multicenter, case-control study including patient samples with early-stage (n= 147) and late-stage HCC (n= 160), HBV (n= 136), HCV (n= 72)and cirrhosis with HBV and HCV (n= 145). We analyzed plasma samples to evaluate the utility of circulating miRNAs alone and in combination with two established protein markers, PIVKA-II and AFP, as biomarkers for detection (including early detection) of HCC and performed multivariate analysis on the included miRNAs. When compared with other studies of circulating miRNAs, our study is unique for the following reasons. First, we screened a large number of plasma miRNAsviaNGS and RT-qPCR, which enabled us to identify potential diagnostic markers independently of the detection method. Second, we included early-stage and late-stage HCC and for the control cohort included HBV and HCV patients with and without cirrhosis to find a miRNA that can diagnose HCC at an early stage and to validate a biomarker that would be applicable for most of the at-risk population. Third, we used a large sample size of 660 samples with four different independent sample panels to increase statistical power. Finally, we employed an empirically validated set of endogenous reference genes for the normalization of our data.
To find reliable miRNA biomarkers for HCC that were unbiased with respect to the detection method, we followed two different screening approaches (RT-qPCR and NGS) to assess a large number of miRNAs isolated from patient plasma. For each method, we used a different set of plasma samples to receive reproducible results by two independent techniques in a large set of samples. These factorscould explain why we obtained only three miRNAs (miR-21-5p, miR-320a and miR-421) that showed high potential as diagnostic biomarkers for HCC in both screening approaches.

Table 6 Univariate analysis of real-time quantitative PCR results for comparison
The 26 best miRNAs selected by both screening methods, including the three overlapping miRNAs,were then analyzed in two different sample panels (training and validation) and combined with the established protein markers PIVKA-II and AFP. In the training panel, miR-21-5p, miR-320d and miR-423 were the best single markers for distinguishing between the HCC and CLD groups. For the early detection of HCC, our data showed that miR-21-5p has the potential to improve the diagnostic performance of PIVKA-II. In the validation panel, the results from the training panel for the comparison of HCCvsCLD for miR-21-5p (AUC = 0.65) and miR-423 (AUC = 0.59) could be confirmed. However,the hypothesis of finding a miRNA signature specific for the detection of early HCC could not be confirmed, and the combination of all 26 miRNAs and AFP did not reveal greater diagnostic potential than AFP alone.
MiR-21-5p was one of the two miRNAs with significantly higher expression in the HCC group compared with the CLD group in both the training and validation cohorts. Other publications have shown similar results. Amret al[38] demonstrated that the expression of serum miR-21 was increased in HCC compared with chronic hepatitis, while Gedawyaet al[39] revealed overexpression of plasma miR-21 in an HCC group (P< 0.05) compared with both CLD and healthy subjects from a cohort in Egypt.However, miR-21 was also reported as a circulating diagnostic biomarker for various other cancers[40]such as breast cancer[41], glioma[42] and non-small cell lung cancer[43]. MiR-21 has been described as an oncogene, targeting tumor suppressors like TP63, TP53, TGF-β and PTEN, leading to the inhibition of apoptosis[44,45]. Furthermore, miR-21 contributes to the epithelial-to-mesenchymal transition in cervical cancer by modulating the expression of theRasa1gene (RAS p21 protein activator 1). Therefore,by indirectly influencing the activity of Ras, miR-21 contributes to the migration potential of these cells.Another described oncogenic effect is that miR-21 modulates angiogenesis in prostate cancer cells[46].Thus, the underlying biology of miR-21 supports its role in HCC development and its potential diagnostic value in HCC as well as other cancers.
MiR-423 also showed differential expression when comparing HCC and CLD in both the training and validation groups. Previously, it was revealed that the expression of miR-423 was significantly increased in HCC tissues compared with adjacent normal tissues[47,48]. In serum samples from HCC patients,miR-423 was also found to be significantly upregulated compared with a control group consisting of patients with cirrhosis or chronic hepatitis[49]. In the training and validation panels (total of 500 independent samples), miR-423 levels were elevated in the HCC group. MiR-423 expression has also been found to be upregulated in breast cancer tissue[50], human prostate cancer tissues and prostate cancer PC3 cells[51] and plasma of patients with oral squamous cell carcinoma[52]. This indicates that miR-423 is not limited to the detection of HCC and can also detect several other cancer types. It can act as an oncogene by enhancing the proliferation and migration of gastric cancer cellsin vitroandin vivowhen overexpressed[53]. Furthermore, when knocking down miR-423, proliferation of PC3 cells was inhibited, and apoptosis was promoted[51]. In summary, although miR-21 and miR-423 are upregulated in several diseases, their overexpression in a high-risk population could be indicative of early HCC development.
Our results indicate that miR-320d and miR-652 might not be robust biomarkers to diagnose (early)HCC as the results from the training cohort could not be validated. However, they seem to play a role in the development of cancer in general, which requires further investigation.
The 15 putative miRNAs detected by NGS in the screening phase that were differentially expressed between HCC and CLD could not be confirmed as potential biomarkers by RT-qPCR in the training and validation panel. Nonetheless, they could be detected in a small number of samples by both NGS and RT-qPCR. Though the putative miRNAs only showed a relatively low expression, they could be novel miRNAs and should be considered in further investigations.
In the training panel, the combination of the HCC biomarker PIVKA-II with the 26 miRNAs selected in the screening phase improved diagnostic capability, and AUC was increased compared with PIVKAII alone. However, this could not be confirmed in the validation panel, which included more samples than the training panel. The combination of AFP and miRNA also did not show any improvement in AFP diagnostic capability in the training panel and was therefore not analyzed in the validation panel.We observed that individual miRNAs identified the same set of patients as those identified by AFP, thus the miRNAs did not add any significant value in this case. However, as the performance of PIVKA-II in the same cohort was between 5% and 20% lower than the performance of AFP, the miRNAs therefore had higher additive value when combined with PIVKA-II. Our results demonstrate that the protein markers AFP and PIVKA-II are more robust biomarkers for HCC than miRNAs.
CONCLUSlON
In conclusion, our study found that two miRNAs (miR-21-5p and miR-423) demonstrated significant differential expression between the HCC group and CLD control group. However, the combination of miRNAs with established protein biomarkers (AFP and PIVKA-II) did not improve diagnostic performance of either protein. Further investigation of the molecular mechanisms by which miRNAs,specifically miR-21-5p and miR-423, support HCC development may help in diagnosing and treating this highly malignant tumor.
ARTlCLE HlGHLlGHTS
ACKNOWLEDGEMENTS
The authors would like to acknowledge Heike Wegmeyer for her help with study protocol design and sample collection and Gloria Tabares for her help with study design and interpretation. LightCycler 480 is a trademark of Roche. All other product names and trademarks are the property of their respective owners.
FOOTNOTES
Author contributions:Swiatek-de Lange M provided study supervision; Malik J and Swiatek-de Lange M contributed to project development; Chan HL-Y, Piratvisuth T, Tanwandee T, Thongsawat S, Sukeepaisarnjaroen W, Esteban JI,Bes M and Köhler B contributed to sample collection; Malik J contributed to development of methodology and collection of data; Malik J, Klammer M and Rolny V contributed to the biostatistical analysis of the data; Malik J,Klammer M, Rolny V and Swiatek-de Lange M contributed to the interpretation of the data; Malik J, Klammer M and Swiatek-de Lange wrote the manuscript; Malik J and Swiatek-de Lange M provided critical review and editing of the manuscript; All authors have read and approved the final manuscript.
lnstitutional review board statement:The study was approved by the following review boards: Siriraj Institutional Review Board; Research Ethics Committee of the Faculty of Medicine, Chiang Mai University; Joint Chinese University of Hong Kong - New Territories East Cluster Clinical Research Ethics Committee; Ethikkommission Medizinische Fakultät Heidelberg; Research Ethics Committee, Faculty of Medicine, Prince of Songkla University;Clinical Research Ethics Committee of Vall d’Hebron University Hospital; and Khon Kaen University Ethics Committee for Human Research.
lnformed consent statement:Written informed consent was obtained from all participants.
Conflict-of-interest statement:Malik J, Klammer M, Rolny V and Swiatek-de Lange M are employees of Roche Diagnostics GmbH and shareholders in Roche Diagnostics.
Data sharing statement:No additional data are available.
STROBE statement:The authors have read the STROBE Statement—checklist of items, and the manuscript was prepared and revised according to the STROBE Statement—checklist of items.
Open-Access:This article is an open-access article that was selected by an in-house editor and fully peer-reviewed by external reviewers. It is distributed in accordance with the Creative Commons Attribution NonCommercial (CC BYNC 4.0) license, which permits others to distribute, remix, adapt, build upon this work non-commercially, and license their derivative works on different terms, provided the original work is properly cited and the use is noncommercial. See: https://creativecommons.org/Licenses/by-nc/4.0/
Country/Territory of origin:Germany
ORClD number:Juliane Malik 0000-0003-2306-3920; Martin Klammer 0000-0001-6426-0029; Ⅴinzent Rolny 0000-0001-8229-0002; Henry Lik-Yuen Chan 0000-0002-7790-1611; Teerha Piratvisuth 0000-0002-5249-9208; Tawesak Tanwandee 0000-0001-7634-0843; Satawat Thongsawat 0000-0003-3302-3930; Wattana Sukeepaisarnjaroen 0000-0001-5065-9397; Juan Ignacio Esteban 0000-0001-5085-917X; Marta Bes 0000-0001-6103-072X; Bruno Köhler 0000-0002-7308-0377; Magdalena Swiatek-de Lange 0000-0003-1406-3232.
S-Editor:Chang KL
L-Editor:Filipodia
P-Editor:Chang KL
 World Journal of Gastroenterology2022年29期
- World Journal of Gastroenterology的其它文章
- Mechanistic and functional extrapolation of SET and MYND domain-containing protein 2 to pancreatic cancer
- Clinical challenge for gastroenterologists-Gastrointestinal manifestations of systemic mastocytosis: A comprehensive review
- Structural changes of proteins in liver cirrhosis and consequential changes in their function
- Epidemiologic and socioeconomic factors impacting hepatitis B virus and related hepatocellular carcinoma
- Enhanced endoscopic ultrasound imaging for pancreatic lesions: The road to artificial intelligence
- Qingyi decoction attenuates intestinal epithelial cell injury via the calcineurin/nuclear factor of activated T-cells pathway